
The US Dollar Index (DXY) advances in the extreme bearish sentiment zone finding an intraday support on Monday’s trading session at 92.016. During this intraday bounce, the price jumped to the extreme bearish zone’s resistance, where the price action started to consolidate. Even considering this intraday recovery, the Greenback accumulates losses of nearly 4.40% (YTD).
Technical Overview
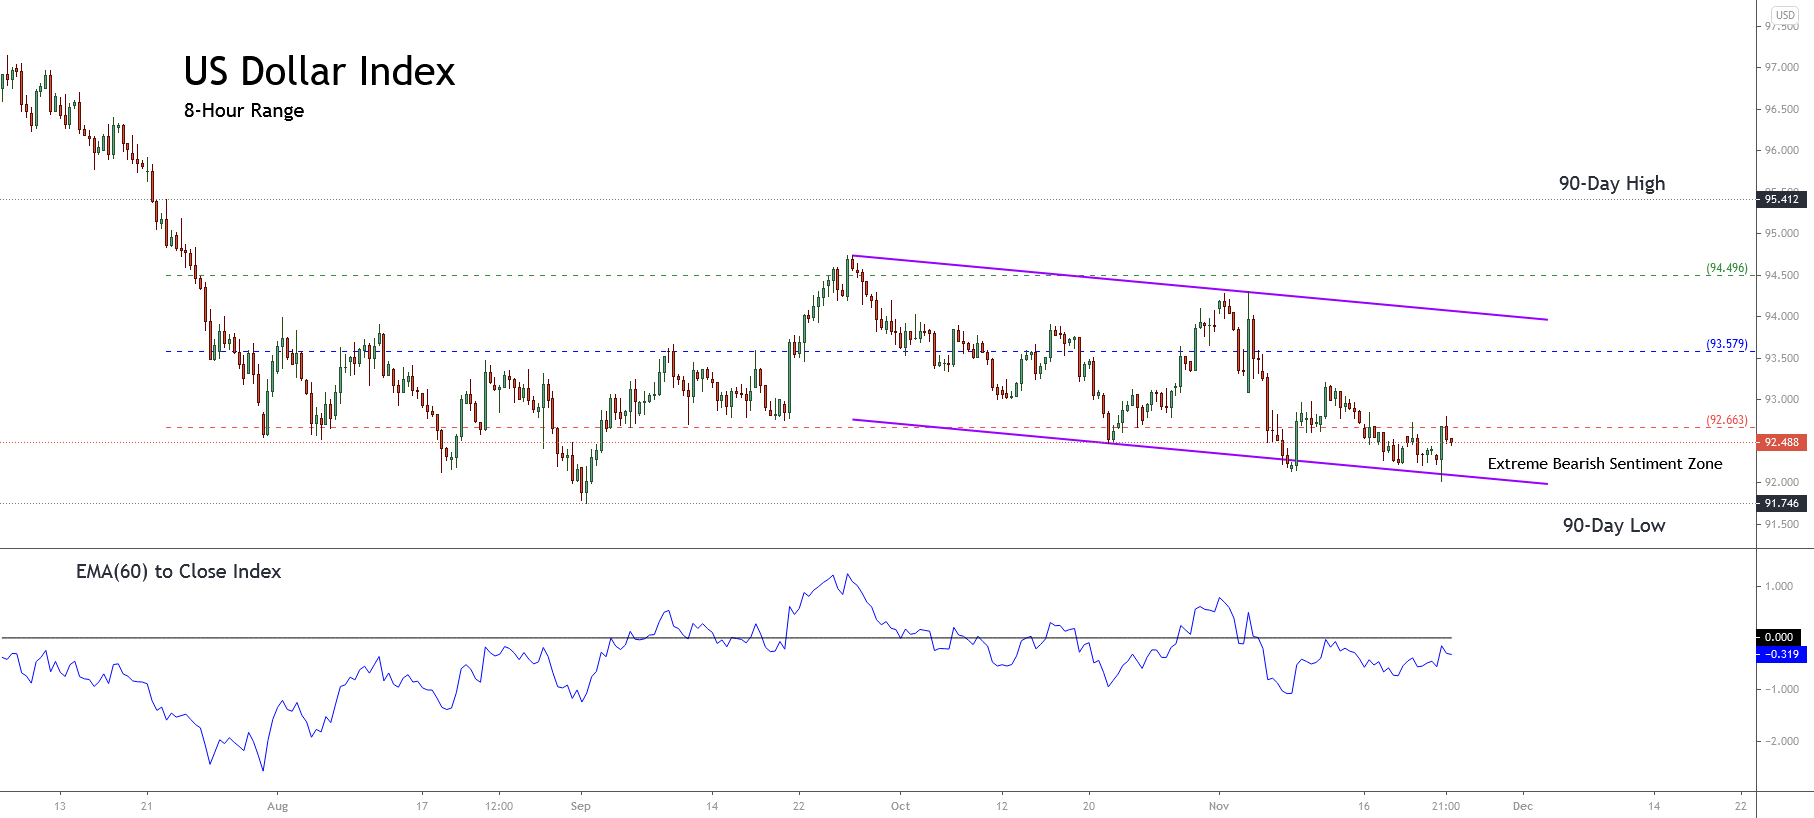
The US Dollar Index, represented in its 8-hour chart, shows the market sentiment’s participants moving within its 90-high and low range, and it reveals the bearish pressure on the Greenback. In this regard, as long as the price keeps moving below 92.663, the short-term trend should stay mostly bearish.
On the other hand, the big picture under the Elliott Wave perspective illustrated in its 8-hour chart reveals the progress in an incomplete corrective formation, which could correspond to a flat pattern.
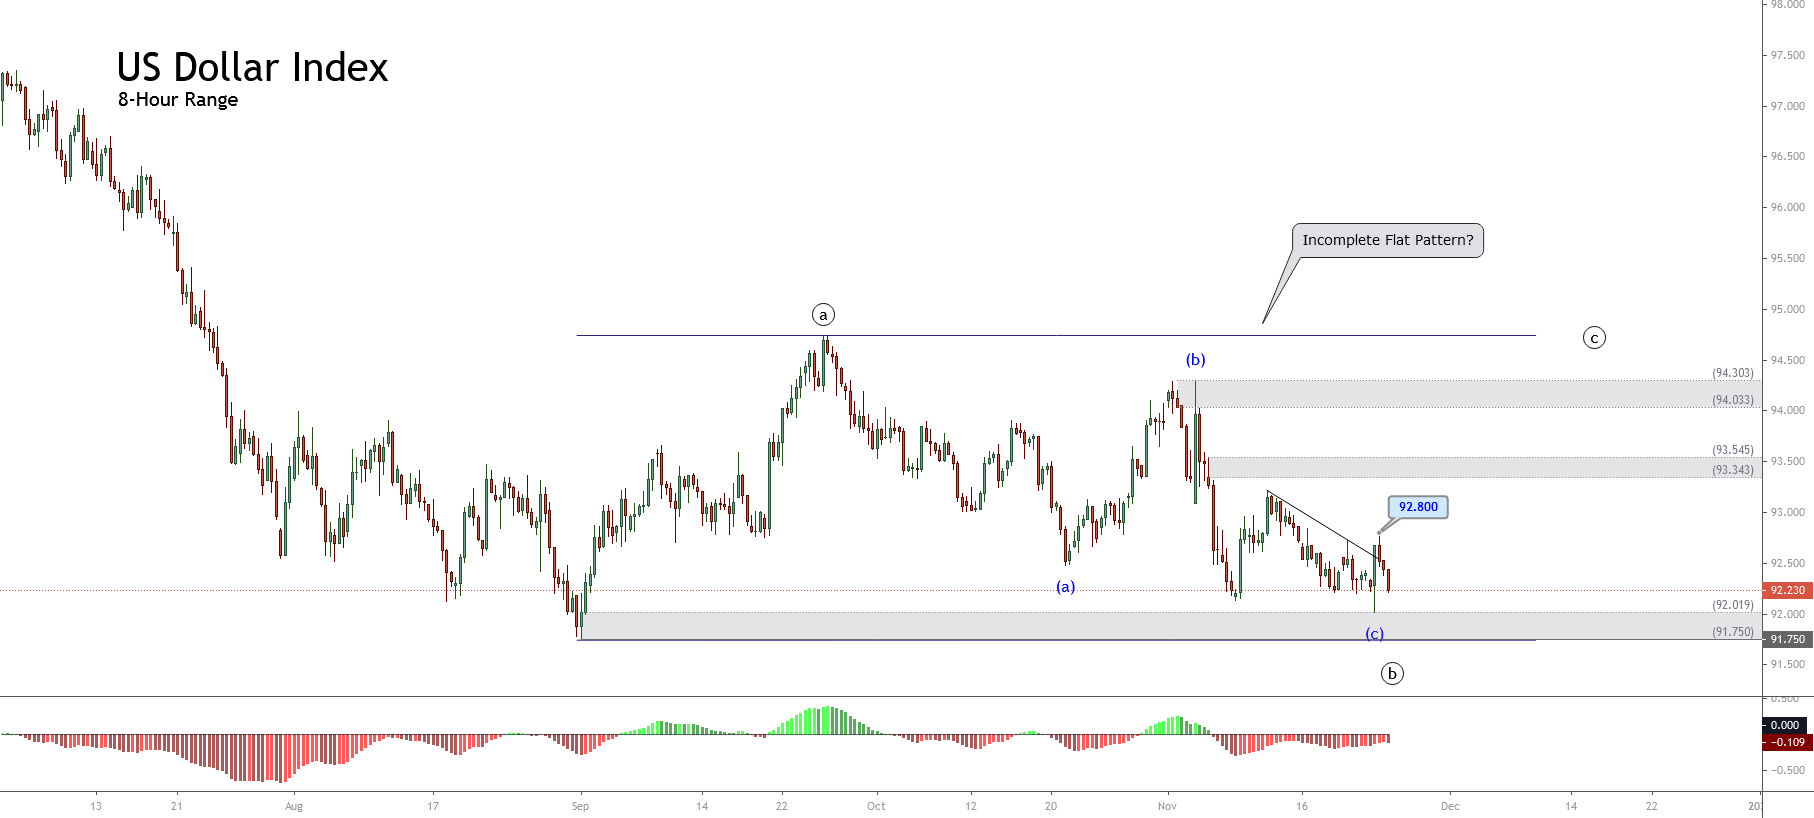
According to the wave theory, the flat pattern follows an internal sequence subdivided into 3-3-5. In this case, the Greenback should advance in a rally in a wave ((c)) of Minute degree identified in black subdivided into five segments.
An alternative scenario considers the possibility of a triangle pattern (3-3-3-3-3) or a double-three (3-3-3) in progress. However, the structure observed until this point doesn’t allow us to confirm or discard any of these potential Elliott wave formations.
Short-term Technical Outlook
The Greenback in its 4-hour range unveils the completion of the wave ((b)) of Minute degree labeled in black in the demand zone between 92.019 and 91.750, where the price bounced from on Monday’s trading session until 92.800.
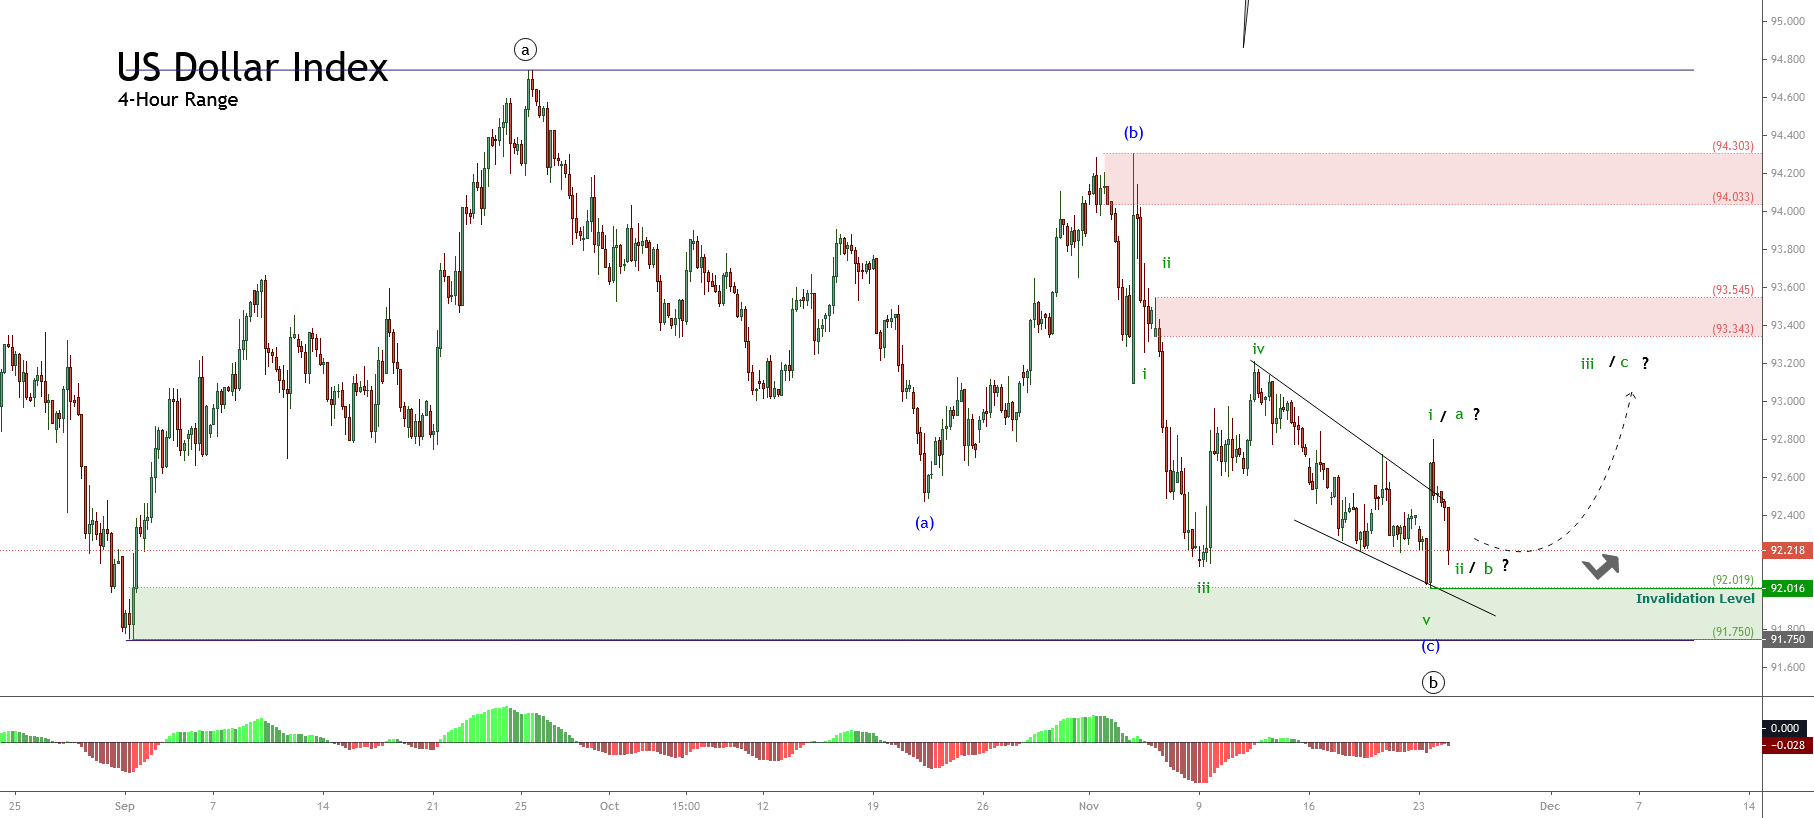
Once the price reacted mostly upward, the US Dollar Index began to decline in a wave ii or B of Subminuette degree identified in green. In this regard, a bullish confirmation should lead us to expect further upward movements that could boost the price toward the next supply zone between 93.343 and 93.545.
If the Elliott wave formation corresponds to a Flat pattern, the price could surpass the supply zone level of 94.303 and seek to test the end of wave ((a)) located on 94.742.
On the other hand, we should be aware that a rally in the US Dollar Index implies a potential drop in the pairs against the US Dollar, for example, EURUSD or GBPUSD.
Finally, the return to a bullish scenario holds its invalidation level at 92.016, which corresponds to the bottom of the first upwards move identified in green.