
Introduction
The global macro analysis of the EUR/CAD pair will analyze endogenous factors that drive the domestic GDP in the EU and Canada. We’ll also analyze exogenous factors that affect the dynamics of the EU and Canada economies, hence affecting the EUR/CAD exchange rate.

Ranking Scale
We’ll rank both endogenous and exogenous factors on a sliding scale from -10 to +10. When the endogenous factors are negative, it means they caused the domestic currency to depreciate. A positive ranking means they resulted in an appreciation of the currency during the period under review. The endogenous scores are based on correlation with the domestic GDP growth.
Similarly, when the exogenous factors get a negative score, they resulted in a drop in the exchange rate. A positive exogenous score means it increased the exchange rate of the EUR/CAD pair. The exogenous scores are based on a correlation with the price of the EUR/CAD pair.
EUR Endogenous Analysis – Summary
The endogenous analysis of the EUR has presented a score of -3. Based on the indicators that we have analyzed, we can conclude that the Euro has depreciated marginally this year.

CAD Endogenous Analysis – Summary
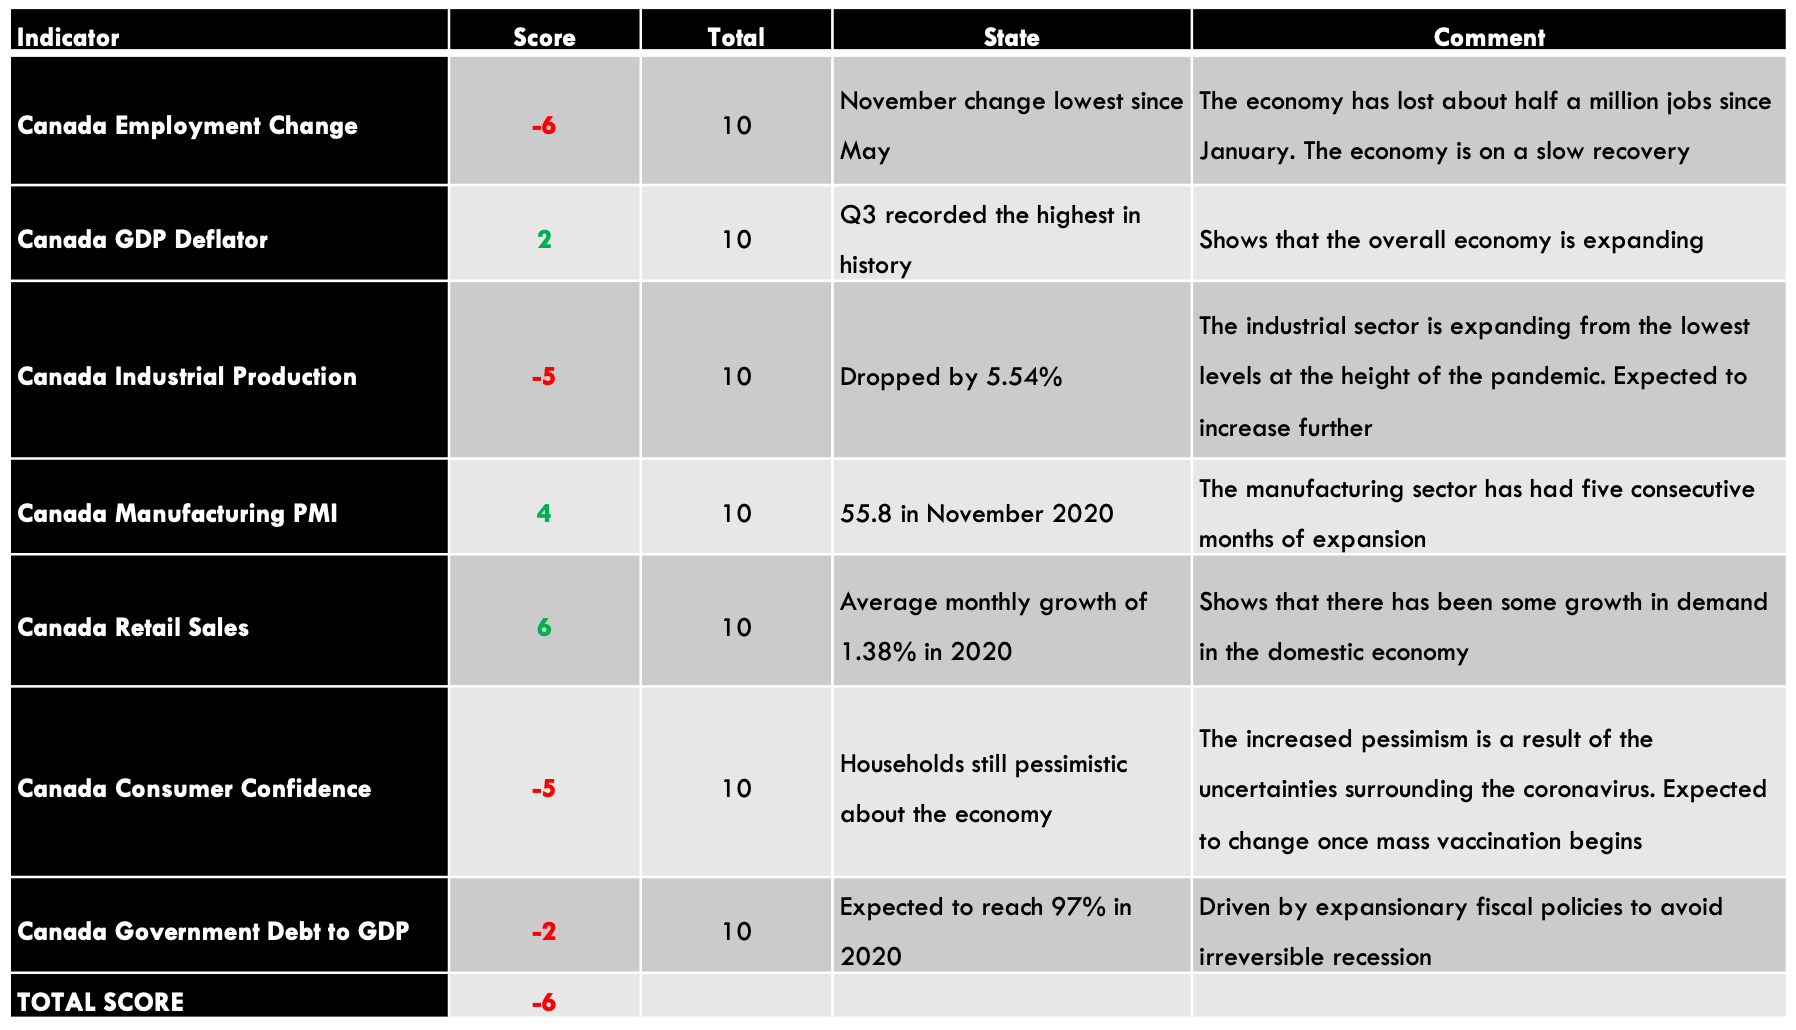
- Canada Employment Change
This economic indicator shows the monthly change in the number of Canadians who are employed. It covers both full-time and part-time employment. Normally, employment changes correspond to an increased business activity, which corresponds to changes in the GDP.
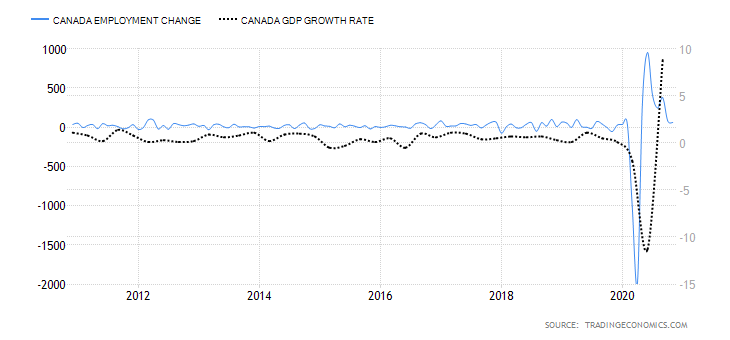
In November 2020, employment in Canada increased by 62,000, down from the 83,600 increase registered in October. The November employment change was the lowest since May 2020, when economic recovery from the effects of the coronavirus began. Up to November 2020, the Canadian economy has shed about half a million jobs. We assign a score of -6.
- Canada GDP Deflator
The GDP inflator is a comprehensive measure of the change in the inflation rate in Canada. It is comprehensive since it reflects the changes in the prices of all goods and services produced within the economy. This contrasts with other measures of inflation like the CPI, which only measures changes in the price of a select basket of goods and services.
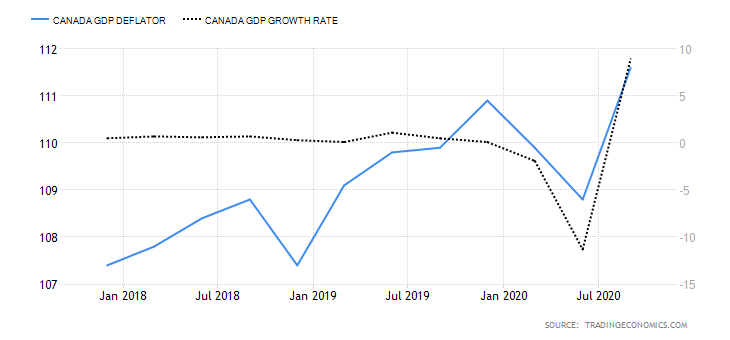
In Q3 of 2020, the GD deflator in Canada rose to 111.6 from 108.8 in Q2. Q3 reading is the highest ever in the history of Canada. This shows that the Canadian economy is bouncing back from the economic downturn brought about by the pandemic. We assign a score of 2.
- Canada Industrial Production
This indicator measures the total output from businesses operating in the industrial sector. Canadian industrial production comprises mining, manufacturing, and utilities. It is the backbone of the Canadian economy, with crude oil production alone accounting for almost 10% of the GDP.

In September 2020, the YoY Canadian industrial production dropped by 7.9%, while the MoM increased by 1.41%, up from the 0.13% drop in August. Up to September, the overall industrial production is down 5.54%. We assign a score of -5.
- Canada Manufacturing PMI
This indicator measures the Canadian manufacturing sector’s performance from the perspective of firms’ purchasing managers in the sector. The PMI aggregates the following indexes; inventories, employment, new orders, output, and suppliers’ deliveries. The sector is expanding if the index is above 50, while a reading below 50 shows contraction.
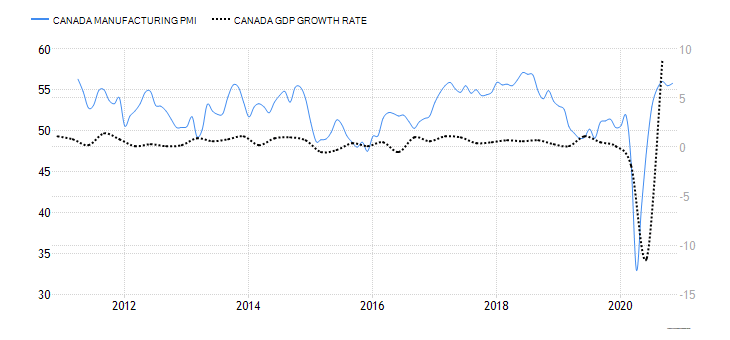
In November 2020, the Canada Manufacturing PMI rose to 55.8 from 55.5 in October. This marked the fifth consecutive expansion in the manufacturing sector from July 2020. Thus, we assign a score of 4.
- Canada Retail Sales
The Canada retail sales data measures the changes in the value of final goods and services purchased by households over a particular period. It is a critical leading indicator of the overall economic growth since households’ consumption is considered the primary driver of GDP growth.

In September 2020, the MoM retail sales in Canada increased by 1.1% compared to a 0.5% increase in August. YoY retail sales rose by 4.6% compared to 3.7% in August 2020. Up to September 2020, the retail sales figure has risen by an average of 1.38%. We assign a score of 3.
- Canada Consumer Confidence
Canada consumer confidence is calculated from an aggregate of 11 questions from the survey of households. This survey estimated the current situation to that expected by households in about six months. The questions touch on the areas of the economy, personal finances, job security, household purchases, and savings vs. expenditure goals. Their confidence is measured on a scale from 0 to 100.
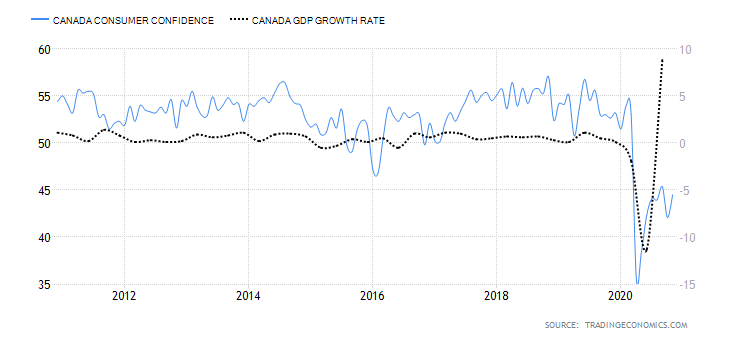
In November 2020, consumer confidence in Canada rose to 44.5 from 42.08 in October. It is, however, still lower than during the pre-pandemic period. We assign a score of -5.
- Canada Government Gross Debt to GDP
In 2019, Canada had a government debt to GDP ratio of 88.6%, down from 89.7% in 2018. The 2019 ratio was the fourth consecutive year since 2016, when the government debt to GDP ratio dropped.
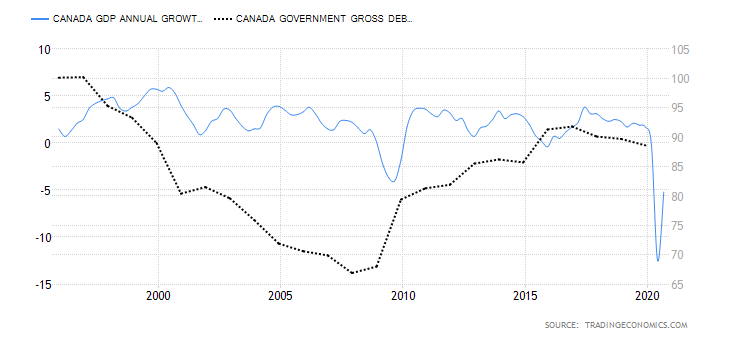
In 2020, it is projected that the Canadian government debt to GDP ratio will increase to 97%. This increase is due to the increased expenditure to alleviate the economy during the coronavirus pandemic. Over the long term, Canada’s government debt to GDP ratio is expected to stabilize around 90%. We assign a score of -2.
In the next article, you can find the exogenous analysis of the EUR/CAD forex pair where we have qualitatively forecasted the future price movement of this pair. Cheers.