Introduction
In conducting the global macro analysis for the EUR/NZD pair, we will analyze the endogenous factors that impact the EU and New Zealand economic growth. We’ll also analyze exogenous economic factors that affect the EUR/NZD pair’s exchange rate in the forex market.
Ranking Scale
We will rank the effects of the endogenous and exogenous factors on a sliding scale of -10 to +10. The endogenous factors will be ranked based on correlation analysis with the GDP growth rate. When the endogenous ranking is negative, it means that the domestic currency will depreciate and appreciate when positive.
Similarly, the exogenous factors are scored based on correlation analysis with the EUR/NZD pair’s exchange rate. A positive score means that the EUR/NZD pair’s price will rise and drop if the score is negative.
Summary – EUR Endogenous Analysis
Based on the factors we have analyzed, we have got a score of -3, and we can expect the Euro to be marginally depreciating in 2020.

Summary – NZD Endogenous Analysis
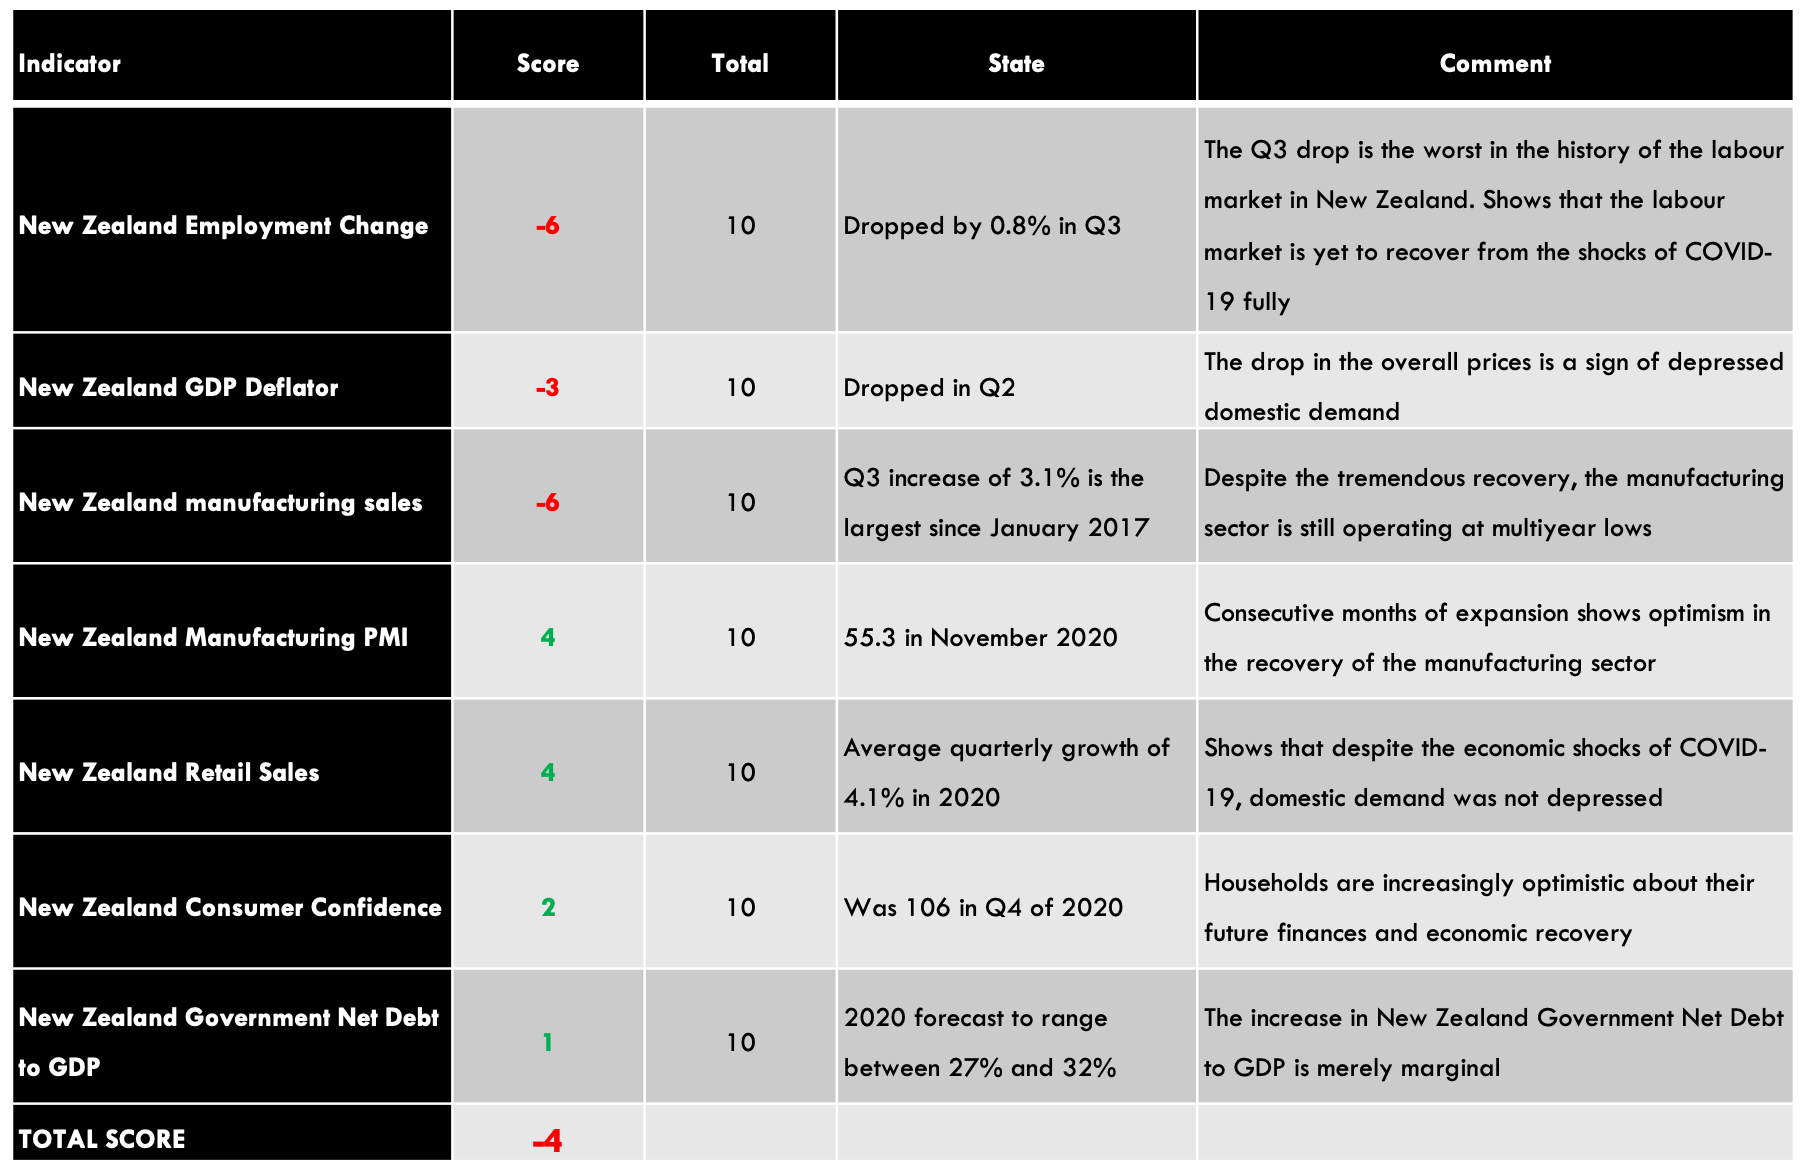
A score of -4 on NZD Endogenous Analysis implies that in 2020, the NZD has depreciated as well.
- New Zealand Employment Change
Employment change measures the quarterly change in the number of people who are gainfully employed. It can be used as a comprehensive measure of the labor market changes, which corresponds to economic growth.
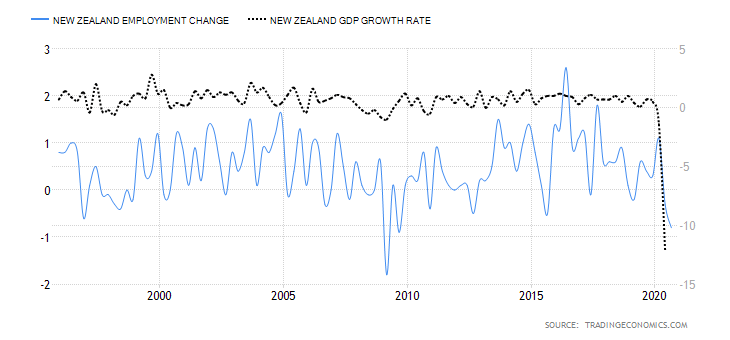
In Q3 of 2020, Employment in New Zealand dropped by 0.8%, from a 0.3% drop in Q2 to 2.709 million. The Q3 reading is the largest drop in QoQ employment since Q1 of 2009. We assign a score of -6.
- New Zealand GDP Deflator
This indicator measures the quarterly changes in the price of all economic output in New Zealand. It is regarded as the most specific inflation measure since it covers price changes for every good and service produced.
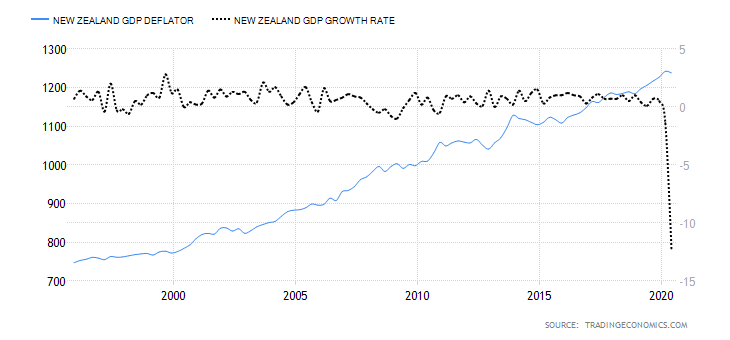
In Q2 of 2020, the New Zealand GDP deflator dropped to 1238 points from 1242 in Q1. This shows that the economy contracted in Q2. Hence, we assign a score of -3.
- New Zealand Manufacturing Sales
New Zealand manufacturing sales track the change in the volume of total sales made in the manufacturing sector. The indicator tracks the sales in 13 industries, which comprehensively represents New Zealand’s economy. The changes in the volume of sales are directly correlated to the growth of the economy.
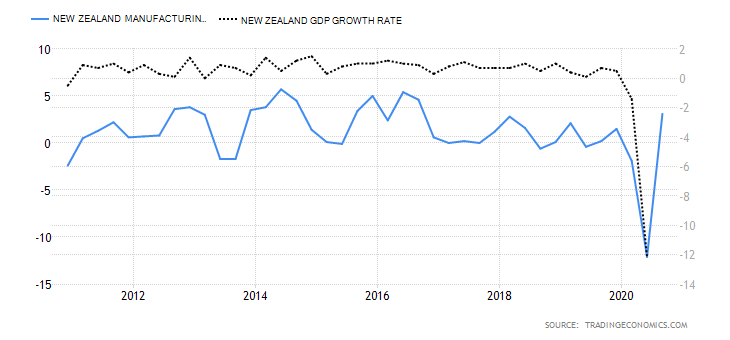
In Q3 of 2020, the YoY manufacturing sales in New Zealand increased by 3.1% after dropping by 12.1% in Q2 and 1.9% in Q1. The increase in Q3 is the largest recorded since January 2017. However, since the overall industrial production is still at multi-year lows, we assign a score of -6.
- New Zealand Manufacturing PMI
This index is aggregated from a survey of purchasing managers in the manufacturing sector. It is a composite of scores regarding output in the sector, prices, expected output, employment, new orders, and inventory. When the PMI is above 50, it means that the manufacturing sector is expanding. A PMI score below 50 shows that the sector is contracting. Naturally, these periods of expansions and contractions are leading indicators of changes in the GDP growth rate.

In November 2020, the New Zealand manufacturing PMI rose to 55.3 from 51.7 in October. The rise was due to increased new orders, inventory, production, and deliveries, as uncertainties surrounding COVID-19 decreased. We assign a score of 4.
- New Zealand Retail Sales
The retail sales track the changes in the quarterly purchase of final goods and services by households in New Zealand. Although retail sales are often affected by seasonality and tend to be highly volatile, it is a significant measure of the overall economic growth since consumer expenditure is one of the primary drivers of GDP growth.
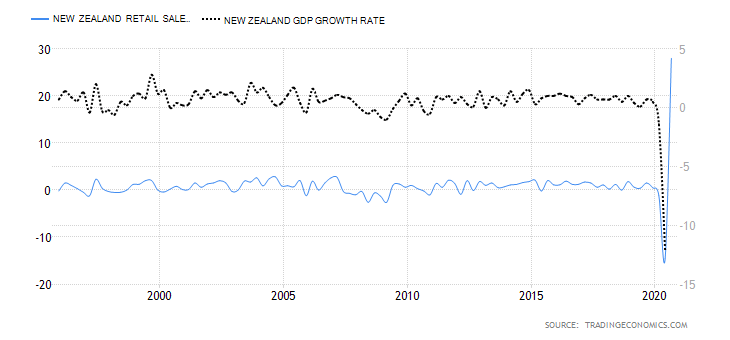
In Q3 of 2020, New Zealand retail sales increased by 28% from 14.8% recorded in Q2. Historically, the Q3 retail sales increase is the largest rise recorded in New Zealand since 1995. The increase was driven by increased expenditure on groceries, vehicles, and household goods. On average, the QoQ New Zealand retail sales figure has grown by 4.1%. We assign a score of 4.
- New Zealand Consumer Confidence
The New Zealand consumer confidence is also called the Westpac McDermott Miller Consumer Confidence Index. The index measures the quarterly change in consumers’ pessimism or optimism about the performance of the economy. When the index is above 100, it shows increased optimism by households, and that below 100 shows pessimism.
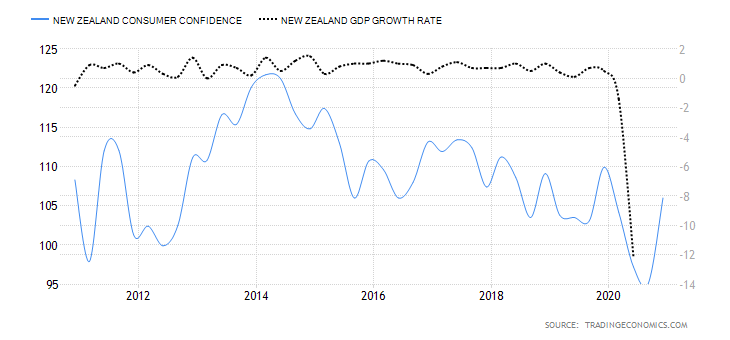
In the fourth quarter of 2020, New Zealand consumer confidence rose to 106 from 95.1 in Q3. The increased optimism was driven by higher readings in both the current and expected financial situation. We assign a score of 2.
- New Zealand Government Net Debt to GDP
Investors use this ratio to determine if the economy is capable of servicing its debt obligations. Consequently, the government’s net debt to GDP affects the government securities yield and determines a country’s borrowing costs. Typically, levels below 60% are deemed favorable.

In 2019, the New Zealand Government Net Debt to GDP dropped to 19% from 19.6% in 2018. In 2020, it is projected to range between 27% to 32%, which would be the highest since 1998. We assign a score of 1.
In the next article, we have done the exogenous analysis of both EUR and NZD pairs to accurately forecast this currency pair’s future trend. Please check that out. Cheers.