Introduction
To properly understand the dynamics of the price of the GBP/USD pair, we’ll conduct endogenous and exogenous analyses of the UK and the US economies.

The endogenous analysis will focus on the significant fundamental economic indicators that drive economic growth in either country. The exogenous analysis will dig deeper into how both the US and the UK economies interact with each other in terms of international trade that impact the currency exchange.
Ranking Scale
Both the endogenous and the exogenous factors that we will analyse will be ranked on a sliding scale from -10 to +10. A negative score means that the indicator resulted in currency depreciation, while a positive score implies that it led to currency appreciation.

USD Endogenous Analysis – Summary
The USD endogenous factors recorded a score of -19.1, implying a deflationary effect on the USD. This essentially means that according to these indicators, the USD has lost its value since the beginning of this year.

You can find the complete USD Endogenous Analysis here.
GBP Endogenous Analysis – Summary
The endogenous analysis of the UK economy results in an expansionary score of 2. Therefore, we could expect the GBP increased in 2020.
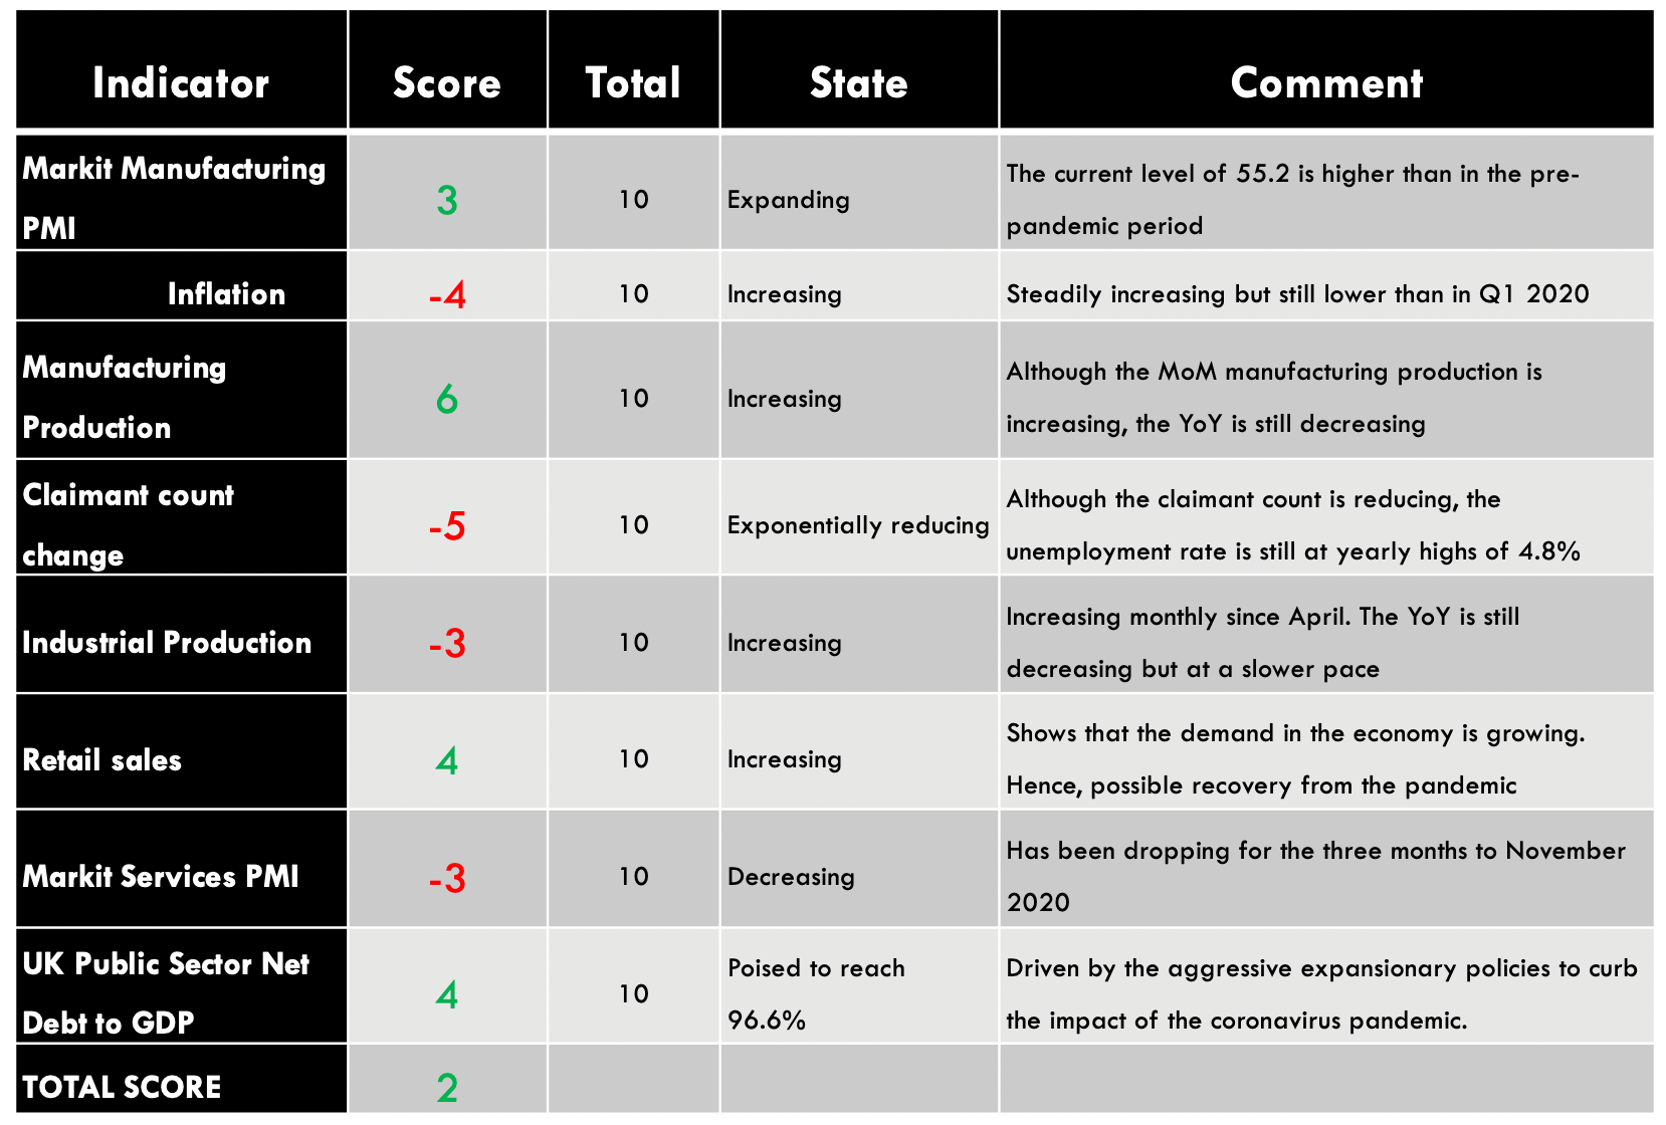
Markit Manufacturing PMI
This is a survey done on about 600 purchasing managers in the manufacturing industry, who rate the level of the business environment such as prices, new orders, inventories, supply deliveries, labour conditions, and production levels.
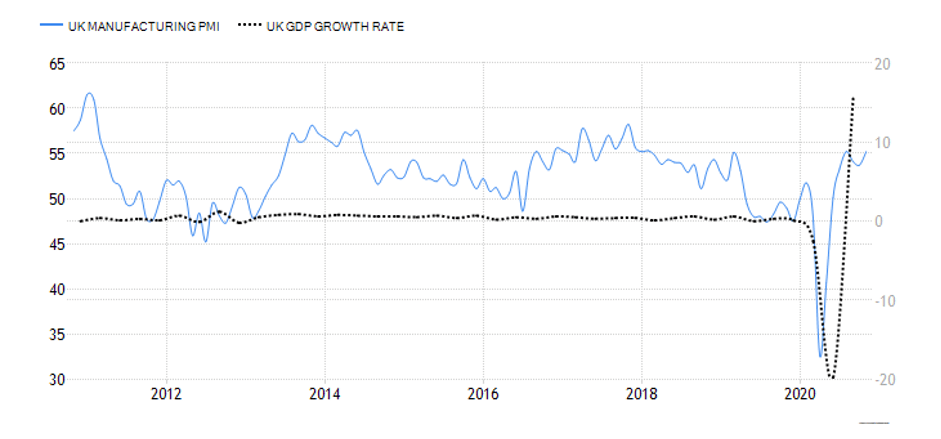
This is a leading indicator for the economy because businesses react almost instantly to the changing operating environment, and the purchasing managers have the most relevant insight. In November 202, the UK Manufacturing PMI was 55.2, showing that the economy is undergoing a sustained recovery. Due to its low correlation with the GDP, we assign an inflationary score of 3.
UK inflation
The CPI is based on a monthly survey done by the Office for National Statistics. This is done by comparing the current average of sample consumer items by the previous month’s prices. The BOE uses the data to adjust interest rates and QE levels to set inflation targets for the economy.
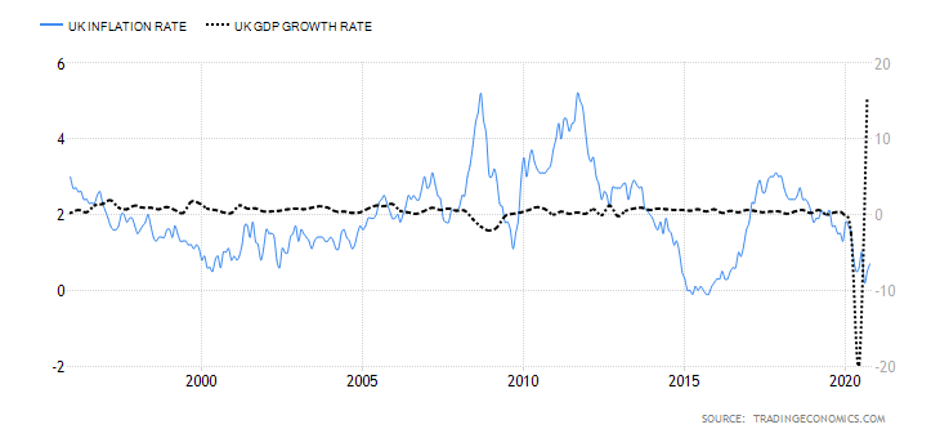
Rising inflation levels lead to higher interest rates, which makes CPI a vital currency valuation indicator. The UK inflation rate increased by 0.7% in October 2020 but is still lower than the rate in the pre-pandemic period. Based on our correlation analysis. We assign it a score of -4.
Manufacturing Production
It measures the change in the total value of inflation-adjusted output by the manufacturers in the whole economy. It is a leading indicator of the economy’s performance since production levels adjust quickly to the business cycles and heavily dependent on consumer conditions like employment changes and earning levels.
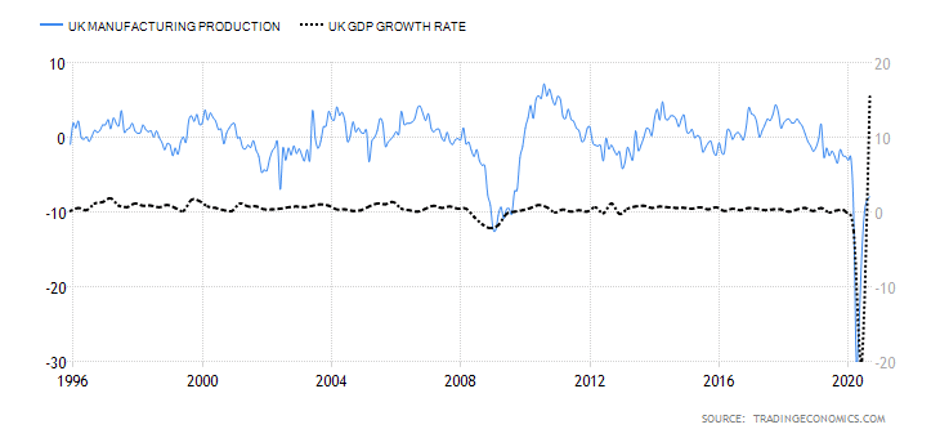
Manufacturing contributes about 80% of the UK’s industrial output and accounts for up to 42.4% of GDP changes. The year-on-year manufacturing production change in September 2020 was -7.9%. This marks the smallest decline since the onset of the coronavirus pandemic. Due to its high correlation with GDP, we assign it an inflationary score of 6.
Claimant count change
It measures the change in the number of people who are seeking unemployment benefits. Hence, it is the primary indicator of unemployment levels, which makes it a vital signal of consumer expenditure levels and labour market conditions. In the UK, claimant count change is considered the best measure of the employment situation, and it accounts for 30% of changes in the GDP.
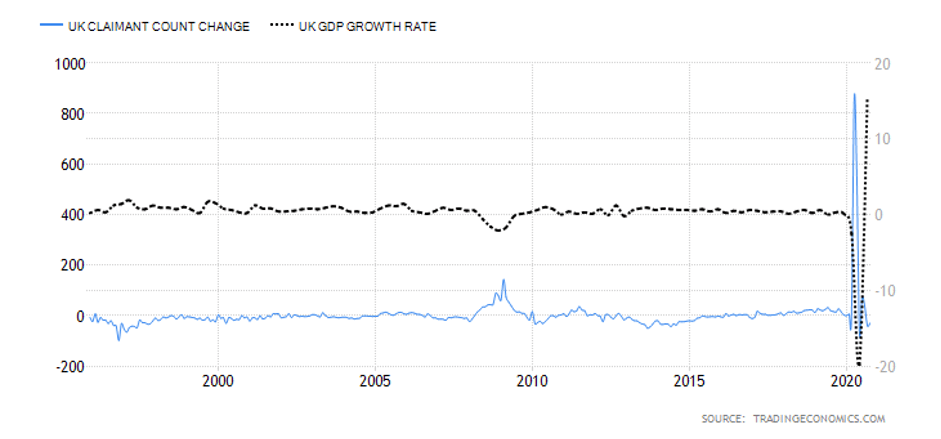
In September 2020, the number of people in the UK who claimed unemployment benefits dropped by 29800. However, the unemployment rate remains at yearly highs of 4.8%. For this reason, we assign a score of -5.
Industrial Production
It measures the change in output from the mines, manufacturers, and utilities, adjusted for inflation. While manufacturing makes up 80% of the industrial production, mines and utilities make up 20%, and their effects on the real economy are thus overshadowed.

It is a significant leading indicator of the economy’s health since industrial activities correspond to labour market conditions and sensitive to business cycles. In September 2020, the UK industrial MoM production increased by 0.5%. However, on a YoY basis, it is down 6.3% from September 2019. In this case, we assign industrial production a score of -3.
Retail Sales
It measures the change in the inflation-adjusted value of all sales at the retail level in the whole economy. It is the primary measure of how much consumer expenditure accounts for most of the country’s economic activity.
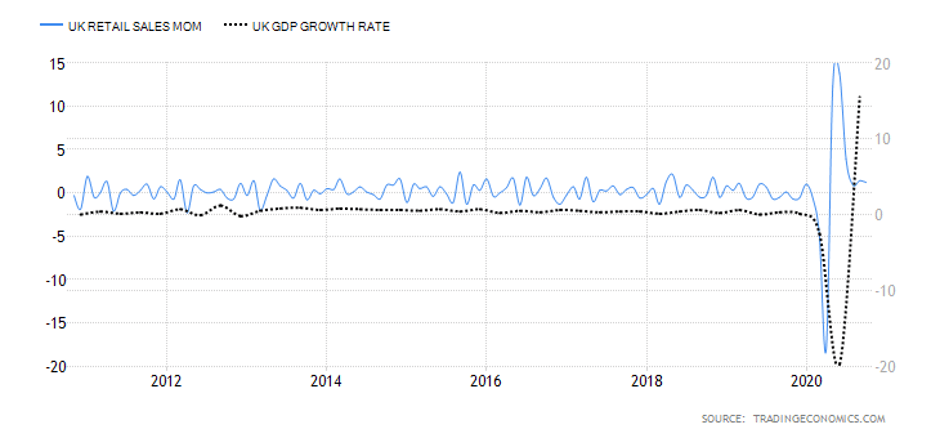
In October 2020, the UK MoM retail sales increased by 1.2%, which is the 6th consecutive increase in retail sales from the slump recorded at the height of the coronavirus pandemic. Based on its correlation with GDP, we assign retail sales an inflationary score of 4.
Markit Services PMI
This is a survey on about 400 purchasing managers in the services industry, who rate the business environment using factors such as employment, new orders, pricing, inventories, and supplier deliveries. A score of above 50 signifies an expansion, while below 50 indicates a contraction in the services industry.
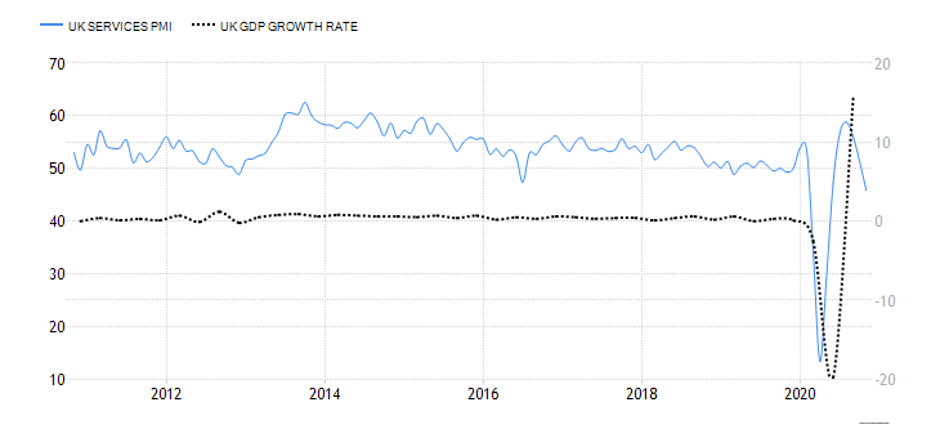
In November 2020, the Marking UK Services PMI was 45.8 – a significant drop from 51.4 in October. Although the Services PMI has increased from the April lows, it is still lower than in January 2020. Combined with its low correlation with the UK GDP, we assign a deflationary score of -3.
United Kingdom Public Sector Net Debt to GDP
This is also called Government Debt to GDP Ratio. Most investors, bilateral and multilateral lenders use this ratio to determine a country’s ability to service any debt they take on. Naturally, when the ratio is higher, it means that the government is piling on more debt, but the GDP is not increasing at the same rate. Since higher GDP would mean higher sources of revenue, if the GDP is not increasing at the same pace as the amount of debt, it implies that the government might struggle with debt repayment.
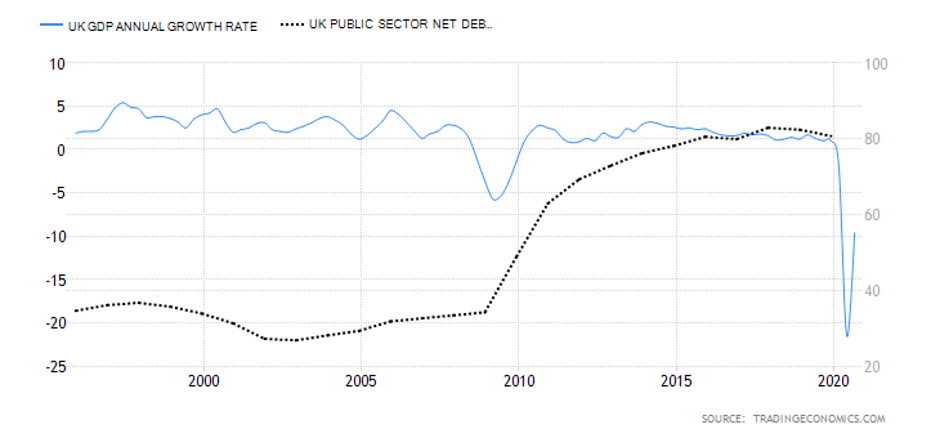
In 2020, the UK Public Sector Net Debt to GDP is projected to reach historic highs of 96.6%. This increase is mainly attributed to governments’ efforts to prop up the economy through aggressive expansionary policies during the pandemic. Based on our correlation analysis, the increase in the United Kingdom Public Sector Net Debt to GDP in 2020 served its purpose to avoid irreversible recessions. We, therefore, assign an inflationary score of 4.
In our next article, we will analyze the Exogenous factors of both USD and GBP to come to an appropriate conclusion.