Categories
Forex Fundamental Analysis

GBP/CHF Global Macro Analysis – Part 1 & 2

Introduction

The global macro analysis of the GBP/CHF currency pair will involve analysing endogenous and exogenous factors. Endogenous factors drive the domestic GDP growth in the UK and Switzerland. Exogenous factors influence the exchange rate for the currency pair.

Ranking Scale

The analysis will rank the endogenous and exogenous factors on a scale from -10 to +10. The score for endogenous factors will be determined from a correlation analysis with the domestic GDP growth rate. If the score is negative, it means that the endogenous factor has led to the domestic currency depreciation. If positive, it has caused the appreciation of the domestic currency.

The exogenous analysis score is from a correlation analysis with the exchange rate for the GBP/CHF pair. When the score is negative, traders can expect the bearish trend for the pair. If positive, then the pair is expected to have a bullish trend.

Summary – GBP Endogenous Analysis

A -15 score implies that GBP has depreciated since the beginning of 2020.

Summary – CHF Endogenous Analysis

A score of 3 implies that CHF has partially appreciated since the beginning of this year.

Indicator Score Total State Comment
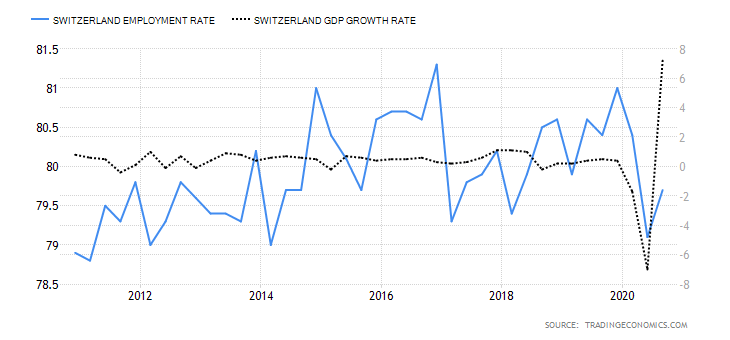
Switzerland Employment Rate -3 10 79.7% in Q3 2020 Slightly below the 80.4% recorded in Q1.
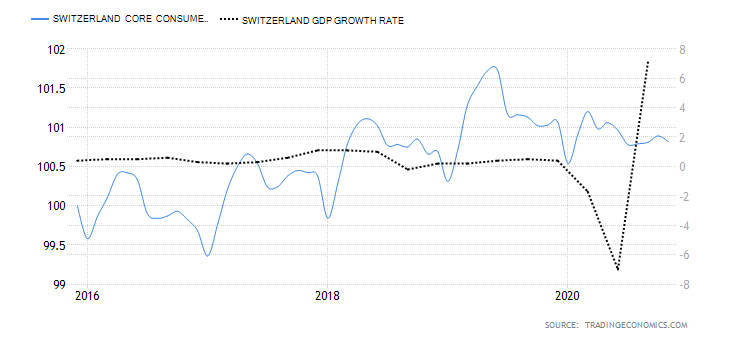
Switzerland Core Consumer Prices 4 10 100.82 points in November Inflation, as measured by the core consumer prices, rose by 0.28 points from January to November
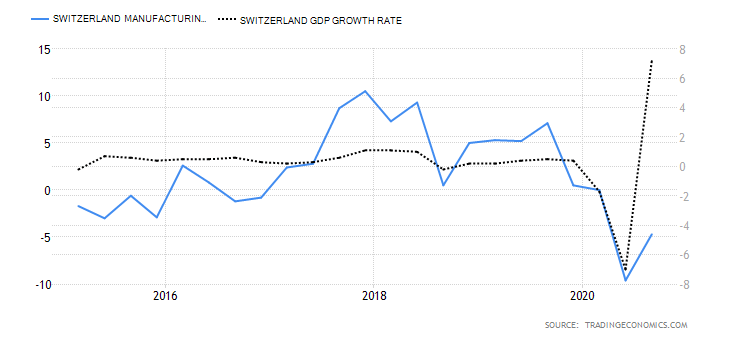
Switzerland Manufacturing Production -2 10 4.7% decrease in Q3 2020 The YoY swiss manufacturing production is recovering
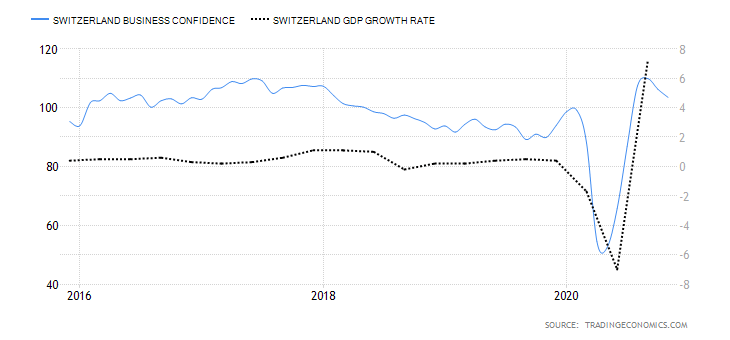
Switzerland Business Confidence 3 10 103.5 in November Swiss KOF Economic Barometer dropped in October and November. The majority of the consecutive drop was driven by private consumption
Switzerland Consumer Spending 5 10 Q3 spending was 91.929 billion CHF Q3 had the highest consumer spending compared to Q1 and Q2.
Switzerland Construction Output -2 10 A 0.4% drop in Q3 2020 Q3 output recovered from the 5% drop in Q2 but is still lower than the 3.1% growth in Q1
Switzerland Government Budget Value -2 10 An expected deficit of 2.2 billion CHF in 2020 Switzerland had a surplus of 8.1 billion CHF in 2019. The projected deficit is on account of aggressive government stimulus program and decreases in revenue due to COVID-19
TOTAL SCORE 3
  1. Switzerland Employment Rate

The Swiss employment rate measures the quarterly change in the percentage of the labour force that is employed. Changes in the number of people employed in the economy are a leading indicator of economic growth. When the economy is expanding, businesses create more job opportunities; hence, higher employment rate. Conversely, a shrinking economy leads to job cuts, which result in a lower employment rate.

In 2020 Q3, the Switzerland employment rate rose to 79.7% from the 6-year lows of 79.1%. Although the Q3 employment rate is lower than the 80.4% recorded in Q1, it shows that the Swiss economy is recovering from the economic shocks of COBID-19. The swiss employment rate scores -3.

  1. Switzerland Core Consumer Prices

Core consumer prices measure the rate of inflation by monitoring the price changes of only a select basket of goods and services. Consumer products with volatile prices are excluded. The rate of inflation is a leading indicator of economic growth. That’s because when inflation rises, it means domestic demand is on the rise, too, hence a higher GDP growth rate. Similarly, a decrease in the inflation rate means domestic demand is depressed, which may be followed by a contracting economy.

In November 2020, the swiss core consumer prices dropped to 100.82 points from 100.89 points in October. However, it is still higher than 100.54 points recorded in January. It has a score of 4.

  1. Switzerland Manufacturing Production

This measures the YoY change in the value of output from the swiss manufacturing sector. This sector plays a significant role in the Swiss economy. Therefore, growth in manufacturing production is accompanied by growth in the labour market and, consequently, the domestic economy’s expansion.

In Q3 of 2020, the YoY swiss manufacturing production dropped by 4.7%. That’s an improvement from the 9.6% drop in Q2. We assign a score of -2.

  1. Switzerland Business Confidence

The KOF Swiss Economic Institute compiles this index. It measures company managers’ optimism based on their perspective of the economy and the growth prospects of their businesses. The business that is surveyed are drawn from multiple sectors in the economy and contains 219 different variables.

In November 2020, the Swiss KOF Economic Barometer dropped to 103.5 from 106.3 in October. This marks the send consecutive month of a drop in the swiss business confidence. Notably, the drop in the index is primarily driven by the manufacturing sector and private consumption. Swiss business confidence has a score of 3.

  1. Switzerland Consumer Spending

This is the value of the total consumption by Swiss households. Domestic consumption is a primary driver of GDP growth. More so, it also an indicator of the performance in the labour market. With a higher rate of employment, disposable income increases, which increases consumer spending.

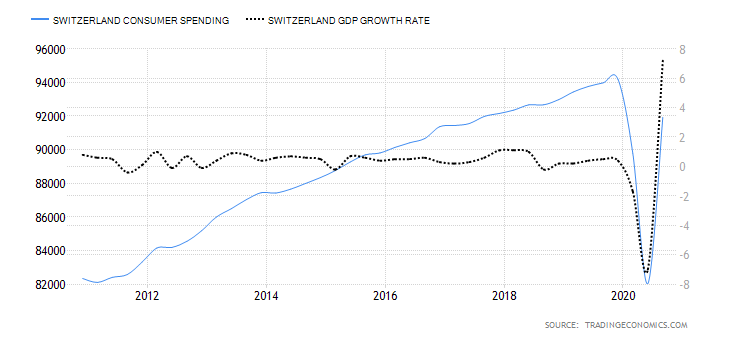
Swiss consumer spending increased to CHF 91.929 billion in the third quarter of 2020, which is the highest recorded compared to CHF 89.79 billion in Q1 and CHF 82.03 billion in Q2. It has a score of 5.

  1. Switzerland Construction Output

This indicator measures the percentage change in the value paid for construction work in Switzerland. The construction work includes building and engineering works done by public and private companies. Typically, when construction work increases, it is expected to be accompanied by an increase in the employment rate and economic growth.

In the third quarter of 2020, the YoY swiss construction output dropped by 0.4%. That is an improvement compared to the 5% drop in Q2 but still less than the 3.1% growth recorded in Q1. It has a score of -2.

  1. Switzerland General Government Budget Value

This represents the difference between the revenues received by the Swiss government and its expenditures. Government expenditure includes all transfer payments and purchases of goods and services. The general government budget value shows if the Swiss government has a surplus or a deficit. Too much deficit means that the economy is probably not responding to expansionary fiscal policies.

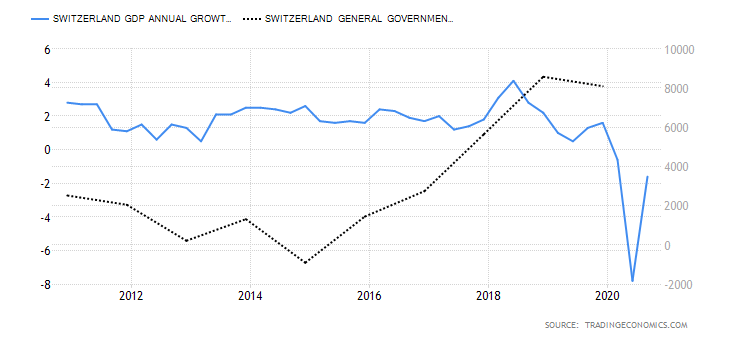
In 2019, the Swiss government had a budget surplus of CHF 8.097 billion. In 2020, the general government budget was expected to hit a deficit of CHF 2.2 billion. This deficit is primarily driven by a significant drop in revenue collection due to COVID-19. It has a score of -2.

In the very next article, you can find the Exogenous analysis of the GBP/CHF currency pair, so make sure to check that out. Cheers.

Categories
Forex Fundamental Analysis

EUR/CAD Global Macro Analysis Part 3

EUR/CAD Exogenous Analysis

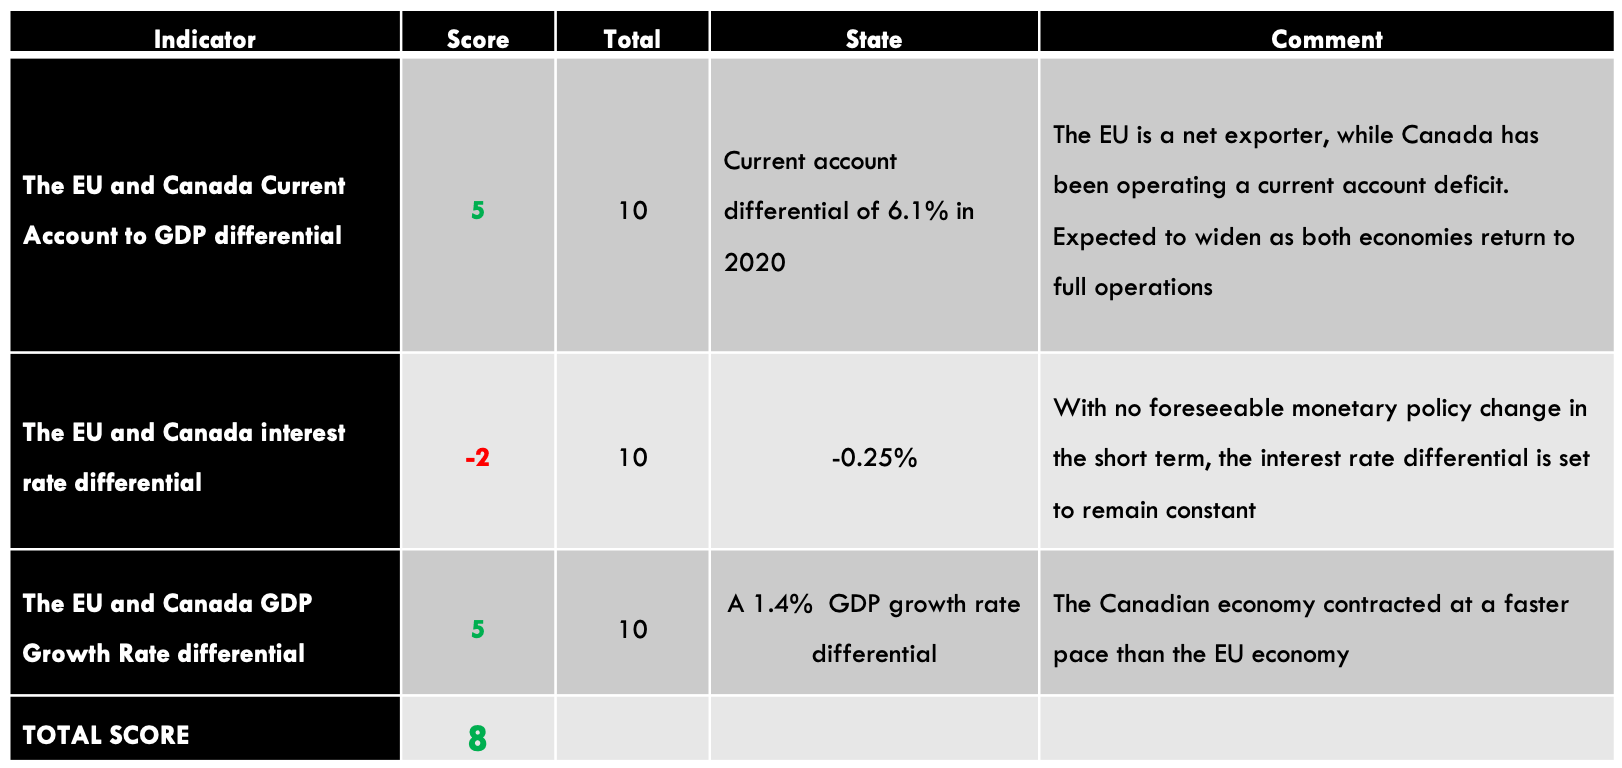
  • The EU and Canada Current Account to GDP differential

When a country has a high current account to GDP ratio, it means that it is running a current account surplus. That implies that the country is highly competitive in international trade as the value of its exports is higher than its imports. Conversely, a country with a low or negative current account to GDP ratio, is running a current account deficit. It means that the value of its imports is higher than exports.

In 2020, Canada’s current account to GDP is expected to hit -2.7% while that of the EU 3.4%. Thus, the current account to GDP differential between the EU and Canada is  6.1%. This means that the EUR is in higher demand in the international market than the CAD. We assign a score of 5.

In the forex market, interest rate differential helps to show investors and traders which currency will earn them higher returns. In a carry trade, forex traders tend to be bullish on the currency that offers a higher interest rate differential. This means that the currency with the higher interest rate will have a higher demand than the lower interest rate.

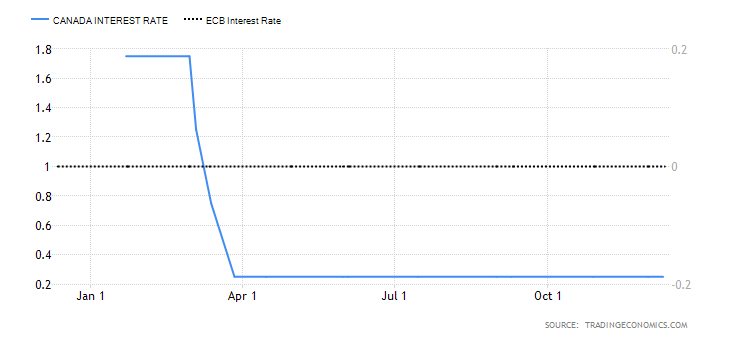
The European Central Bank has maintained interest rates at 0% throughout 2020, while in Canada, interest rates were cut from 1.75% to 0.25%. Thus, the interest rate differential for the EUR/CAD pair is -0.25%. We assign a score of -2.

  • The EU and Canada GDP Growth Rate differential

Since countries vary in the economy’s size, it makes it hard to compare them based on absolute GDP. However, the GDP growth rate helps filter out the effects of the economy size and instead compares countries based on their growth.

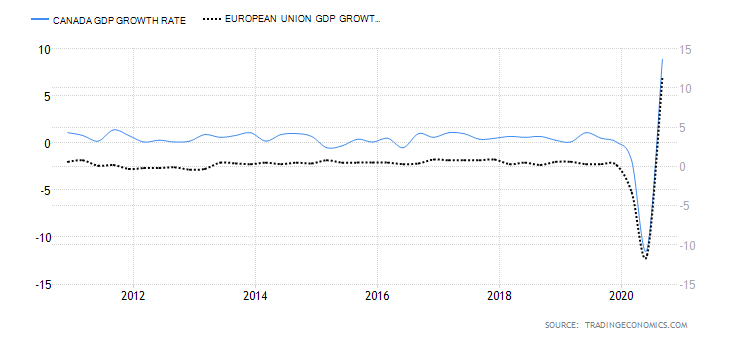
From January to September 2020, the Canadian economy has contracted by 4.3% while the EU economy has contracted by 2.9%. That means that the GDP growth rate differential between the EU and Canada is 1.4%. i.e., the Canadian economy has contracted more than the EU economy. We assign a score of 4.

Conclusion

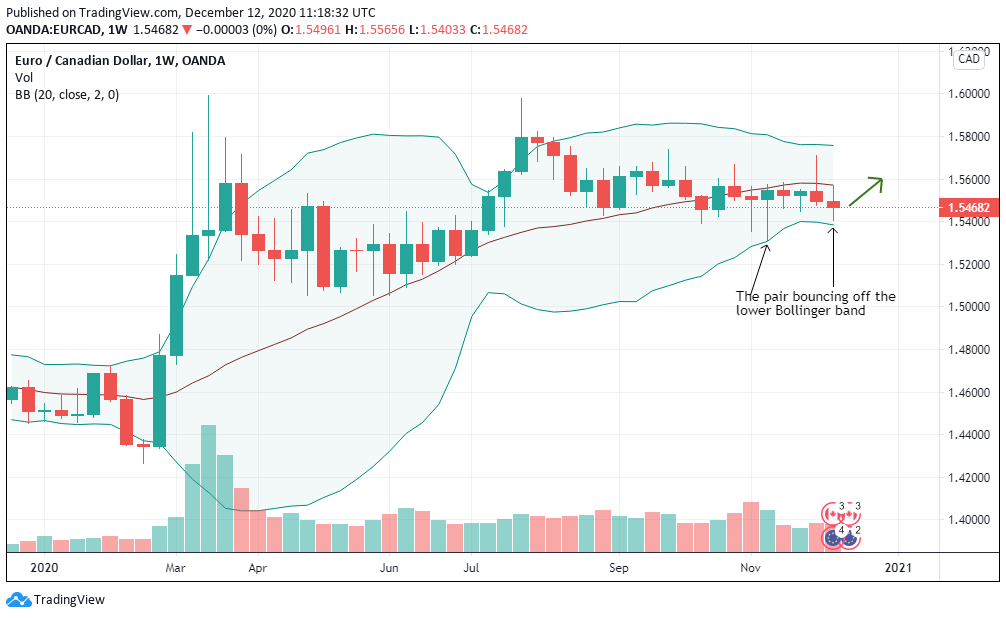
The exogenous analysis of the EUR/CAD pair has a score of 8, which means we can expect a bullish trend for the pair in the short-term. This is supported by our technical analysis, which shows the weekly chart bouncing off the lower Bollinger band, implying that an uptrend is looming.

We hope you find this article informative. In case of any queries, please let us know in the comments below. All the best.

Categories
Forex Fundamental Analysis

EUR/AUD Global Macro Analysis – Part 3

EUR/AUD Exogenous Analysis

  • The EU and Australia Current Account to GDP differential

The current account to GDP shows the percentage of a country’s international trade that makes up the GDP. Countries with higher current account surplus have a higher current account to GDP ratio while those running deficits have a negative current account to GDP ratio.

In this case, if the GDP differential is positive, it means that the exchange rate for the EUR/AUD pair will increase. But if the differential is negative, then the exchange rate for the pair will drop.

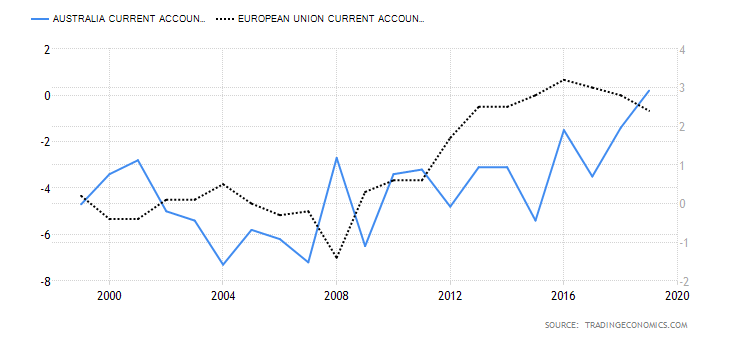
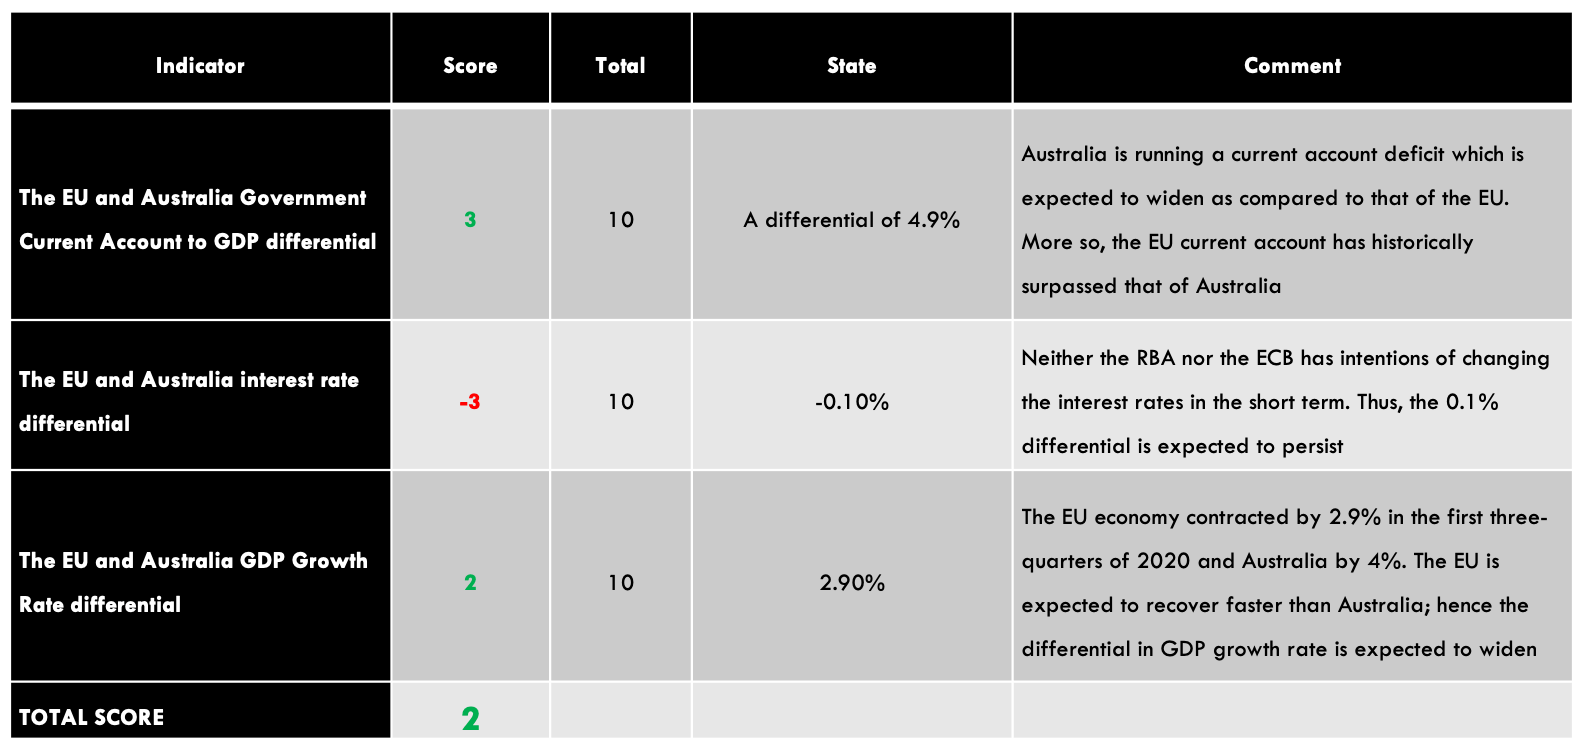
In 2020, the current account to GDP ratio in the EU is expected to hit 3.4% and -1.5% in Australia. Thus, the current account to GDP differential is 4.9%. We assign a score of 3.

Typically, investors put their money into financial instruments that offer higher interest rates. Therefore, the country with a higher interest rate should be expected to have more inflow of funds than that with a lower interest rate. Note that when foreign investors invest in the local economy, they have to convert their money into the domestic currency. This conversion increases the demand for the domestic currency in the forex market hence increasing its value.

In forex trading, if the EUR/AUD pair has a positive interest rate differential, it means that the exchange rate of the pair will increase. Conversely, a negative interest rate differential implies that the pair has a bearish outlook.

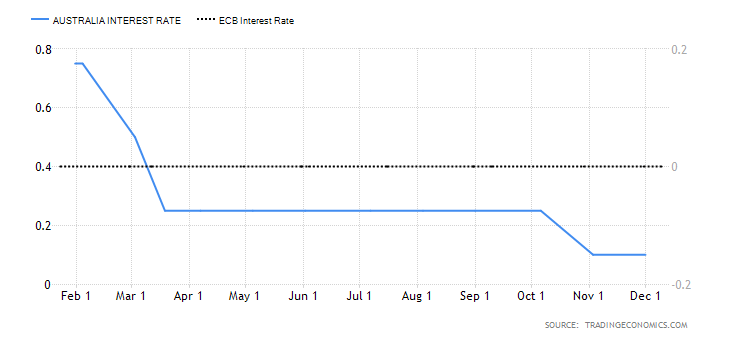
In 2020, the Reserve Bank of Australia cut the cash rate from 0.75% to 0.1%, while the ECB has maintained interest rates at 0%. Therefore, the interest rate differential for the EUR/AUD pair is -0.1%. We assign a score of -3.

  • The EU and Australia Growth Rate differential

In any economy, the value of the domestic currency is mostly determined by the growth of the local economy. Therefore, a country whose economy is growing faster will see its domestic currency appreciate faster.

If the growth rate differential is negative for the EUR/AUD pair, we can expect a bearish outlook. If it is positive, it implies that the exchange rate for the pair will rise.

For the first three quarters of 2020, the Australian economy contracted by 4% and the EU economy by 2.9%. The GDP growth differential is 1.1%. We assign a score of 2.

Conclusion

The EUR/AUD exogenous factors have a score of 2. If the conditions observed in the exogenous factors persist, we can expect that the pair will adopt a bullish trend in the short-term.

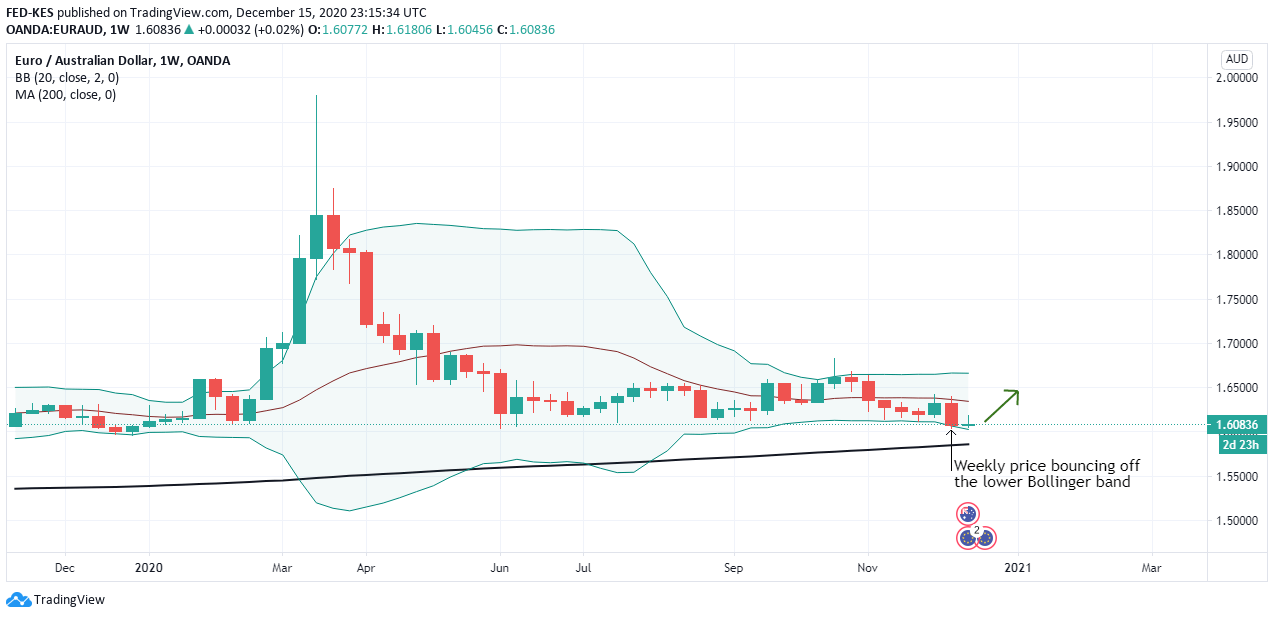
The technical analysis of the EUR/AUD shows the weekly price chart bouncing off the oversold region of the lower Bollinger bands. More so, the pair is still trading above the 200-period MA. All the best.

Categories
Forex Fundamental Analysis

USD/JPY Global Macro Analysis – Part 3

USD/JPY Exogenous Analysis

In the exogenous analysis, we will analyze economic indicators that exhaustively compare the performance of the US and the Japanese economies. These factors impact the dynamic of the USD/JPY pair in the forex market. They include:

  • US and Japan interest rate differential
  • The difference in the GDP growth in the US and Japan
  • Balance of trade

US and Japan interest rate differential

The interest rate differential is the difference between the interest rate in the US and that of Japan. Investors would prefer to invest their funds in a country that offers higher returns. Furthermore, carry traders are often bullish on the currency with a higher interest, which ensures that they earn higher yields.

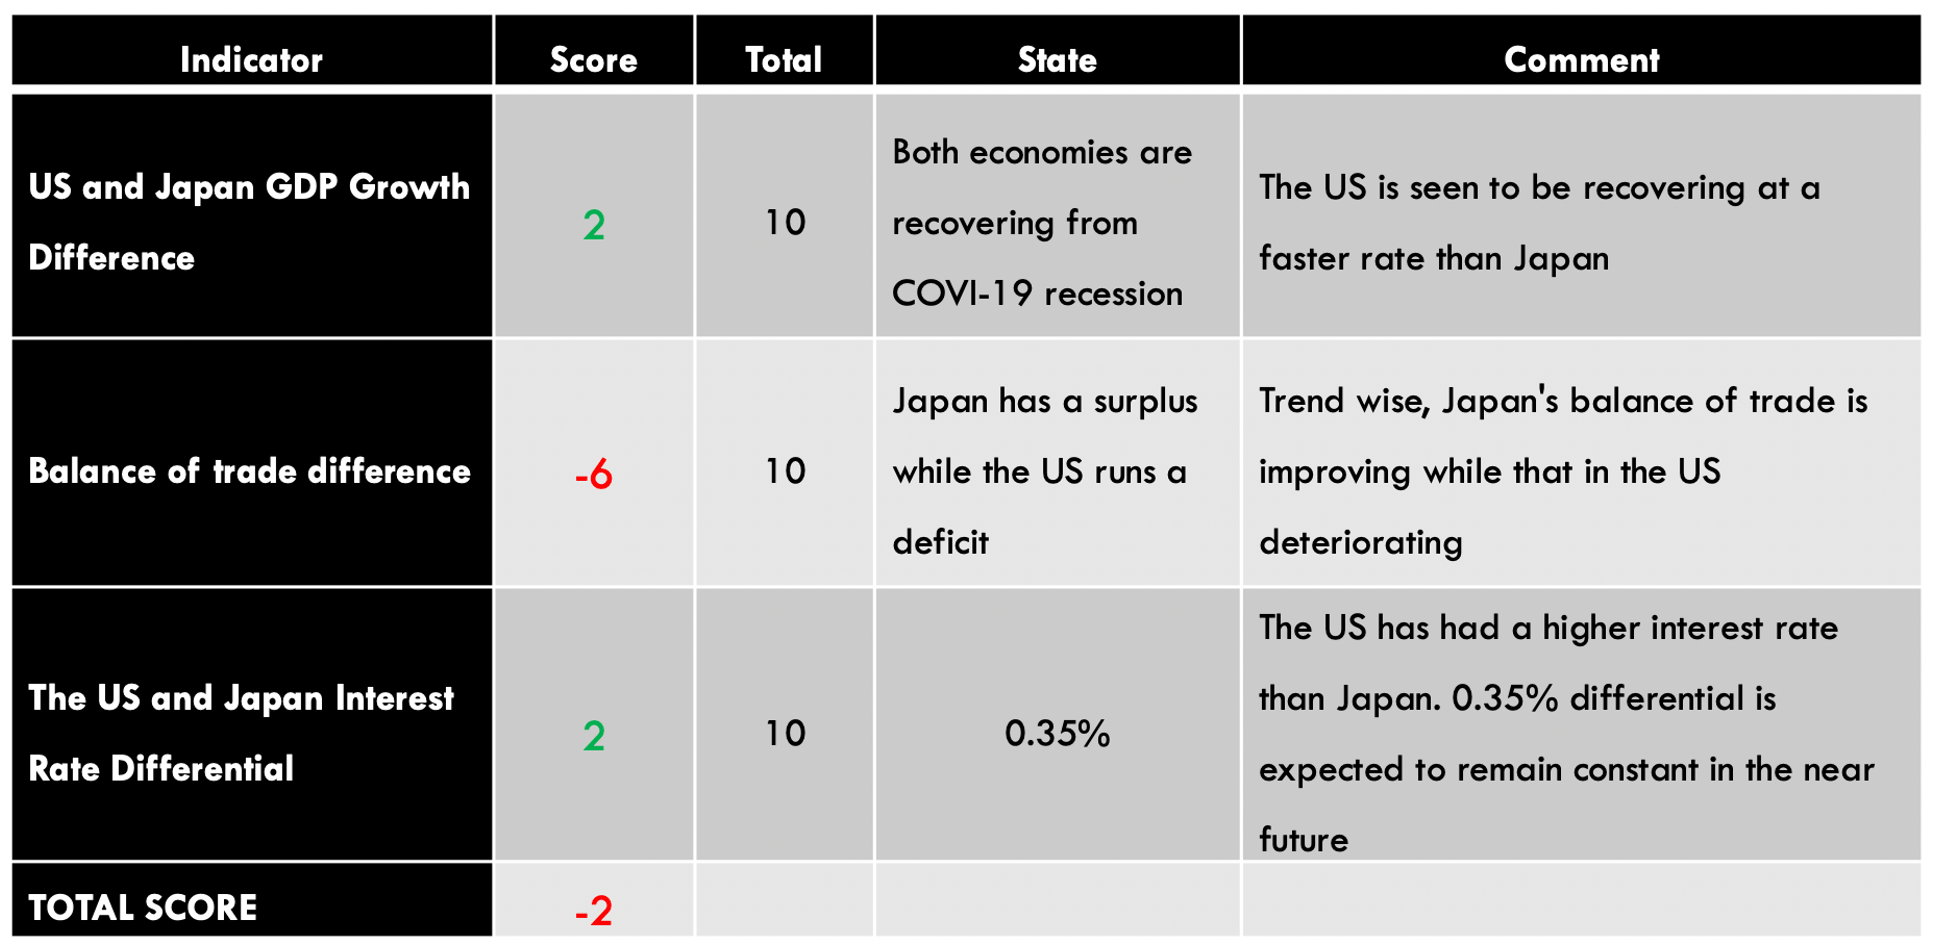
The Bank of Japan has kept the interest rates at -0.1% since 2016. The current federal funds rate in the US is 0.25%. Thus, the interest rate differential for the USD/JPY is 0.35%. Since there are no foreseeable changes in the interest rates in either country, we assign it an inflationary score of 2.

Balance of trade

Balance of trade determines whether a country has a trade surplus or deficit in international trade. A trade surplus results from a country’s exports being of higher value than that of its imports. A deficit occurs when the imports are of higher value than exports. Japan mostly exports machinery and electronics, which puts it at a significant advantage due to the value of these goods. On the other hand, the US is a net importer.

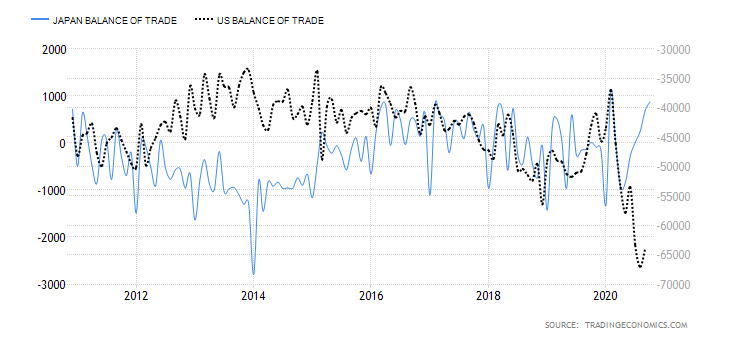
In October 2020, japan has a trade surplus of ¥872.9 billion, which has been steadily increasing since June. The US has a trade deficit of $63.9 billion, which has been growing throughout the year.

The balance of trade differential between the US and Japan has been widening in favor of Japan. Based on our correlation analysis with the USD/JPY, we assign it a score of -6. It means that if this trend persists, we expect the USD/JPY to be bullish in the near term.

The difference in the GDP growth in the US and Japan

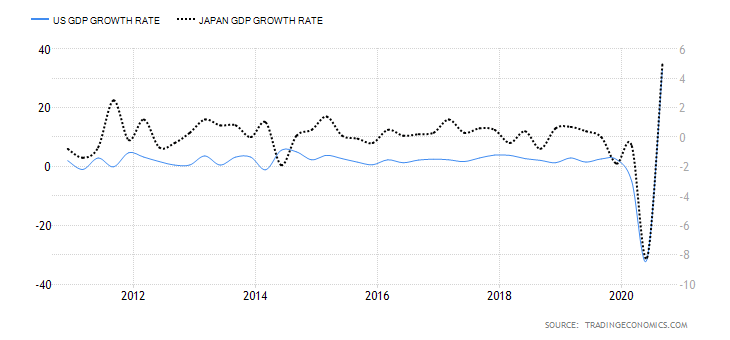
Although the US has a higher GDP than Japan, we can compare the two economies based on their growth rates.

The US economy had a GDP growth rate of 33.1% in Q3 2020, while Japan’s economy expanded by only 5%. The US economy is seen to be expanding at a faster pace than that of Japan. Based on the correlation with the price of the USD/JPY pair, we assign an inflationary score of 2. This means that we should expect a bullish trend on the USD/JPY pair if the US economy keeps expanding faster than that of Japan.

Conclusion

The total score from the exogenous analysis of the USD/JPY pair is -2. This implies that in the near term, we should expect a bearish trend in the pair.

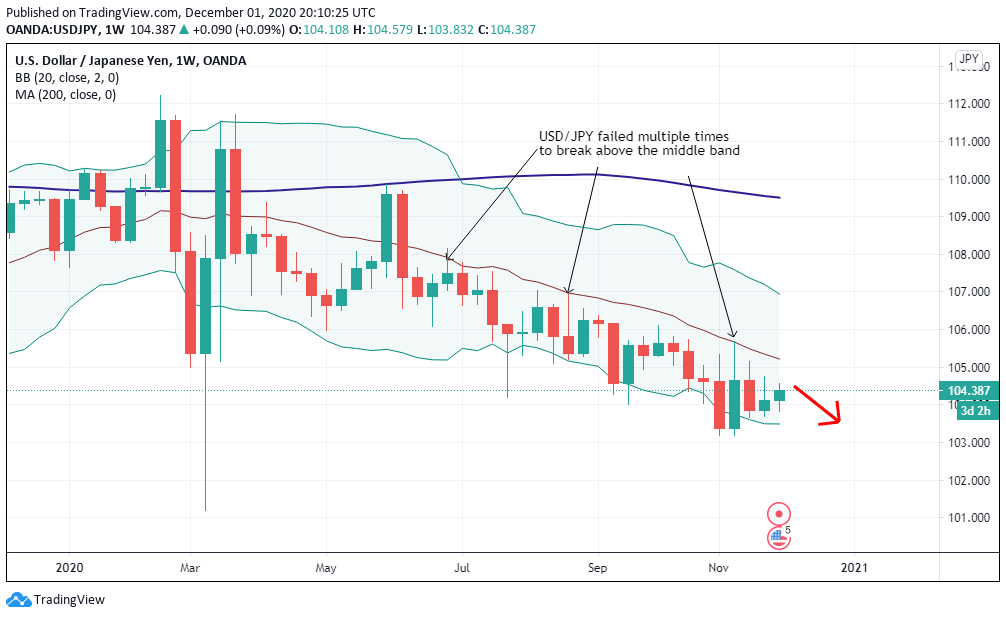
Technical analysis of the USD/JPY pair shows that the weekly chart is still trading way below the 200-period MA. Furthermore, the pair has failed to successfully breach the middle Bollinger band, which has served as its resistance level. All the best!

Categories
Forex Fundamental Analysis

USD/JPY Global Macro Analysis – Part 1 & 2

Introduction

Global macro analysis of the USD/JPY pair involves the analysis of endogenous factors that impact both the USD and the JPY; and exogenous analysis for the USD/JPY pair.

In the endogenous analysis, we’ll focus on domestic macroeconomic factors that drive the domestic growth in the US and Japan. The exogenous analysis will involve the analysis of global macroeconomic factors that define the dynamics of the USD/JPY pair.

Ranking Scale

We will rank both the endogenous and the exogenous factors on a sliding scale of -10 to +10. Whenever the ranking is negative, it means that the macroeconomic indicator led to the depreciation of the currency. A positive ranking means that the indicator had an inflationary impact.

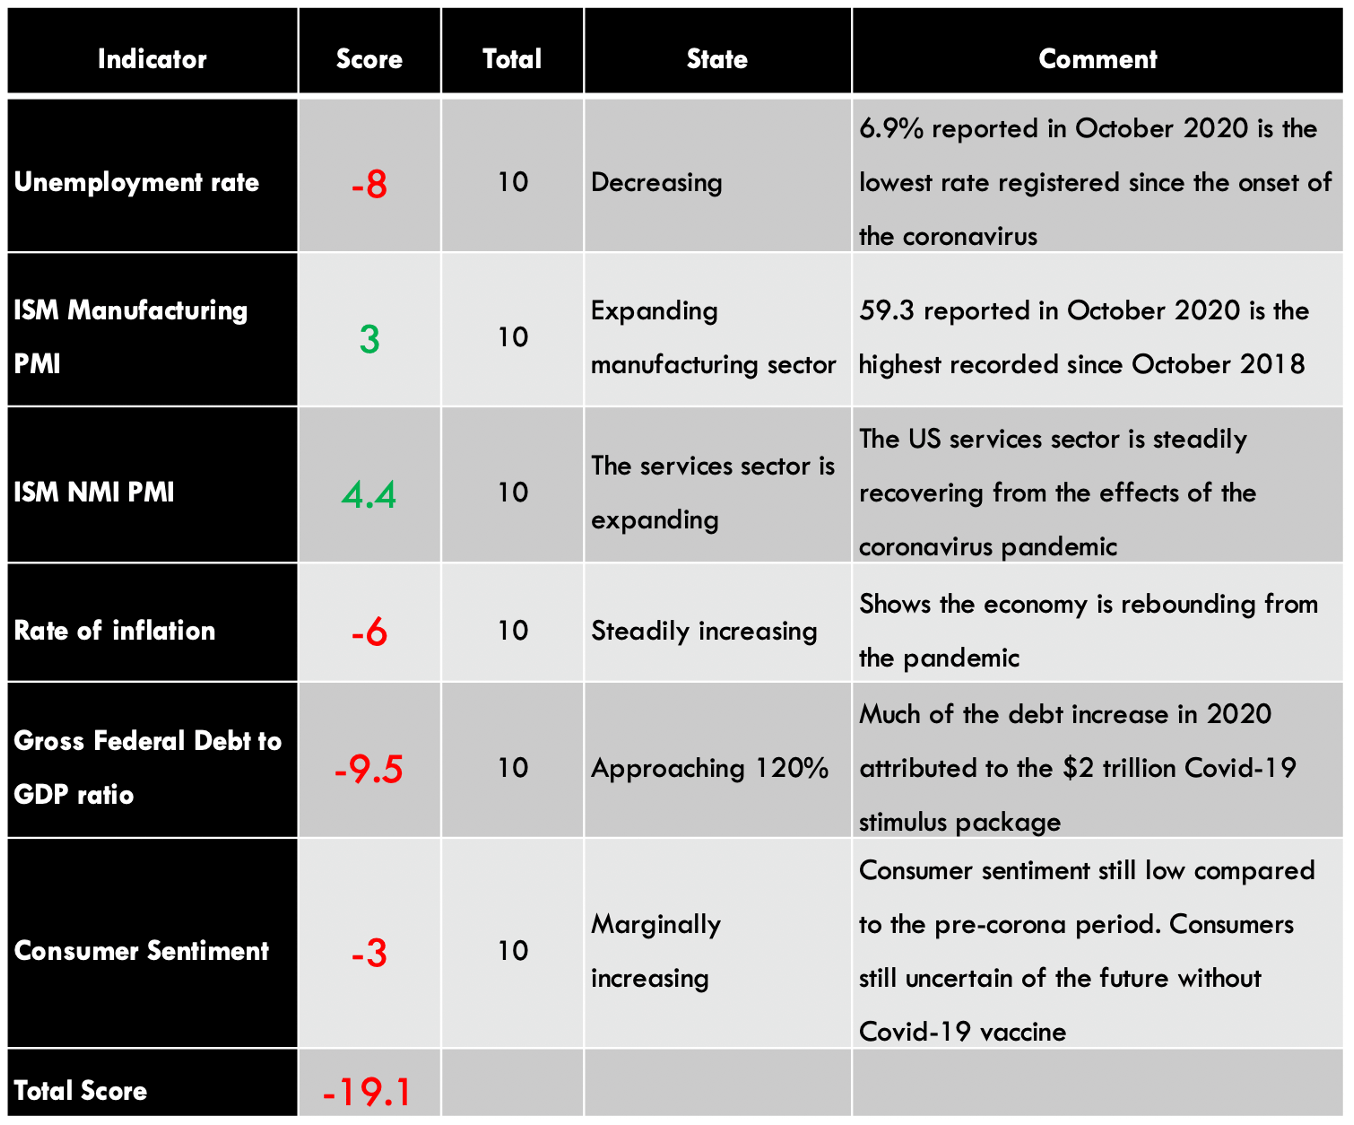
USD Endogenous Analysis – Summary

A score of -19.1 implies a clear deflationary effect on the US Dollar. This means that USD has lost its value since the beginning of 2020, according to these indicators.

You can find the complete USD Endogenous Analysis here.

JPY Endogenous Analysis – Summary

The endogenous analysis for the Japanese economy resulted in an overall inflationary score of 3. Based on this analysis, we can expect that the JPY had appreciated marginally in 2020.

  • Japan Inflation Rate

The inflation rate in Japan is measured by the consumer price index  (CPI). The CPI weights various consumer expenditures depending on their level of importance. Food is weighted at 25%, Housing 21%, transport and communication 14%, recreation 11.5%, energy and water 7%,  medical care 4.3%, and clothing 4%.

A higher rate of inflation is necessary for economic growth. It also forestalls a possible interest rate hike, which is accompanied by currency appreciation.

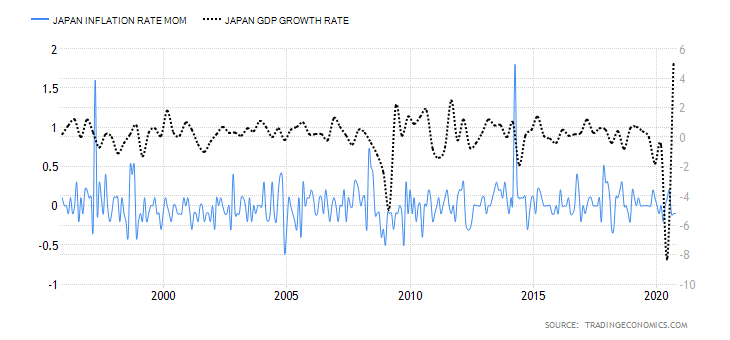
In October 2020, the MoM inflation rate in Japan decreased by 0.1% constant change since August. The YoY inflation rate decline by 0.4%, the first decline in about four years.

Based on our correlation analysis, we assign Japan’s inflation rate, a deflationary score of -2.

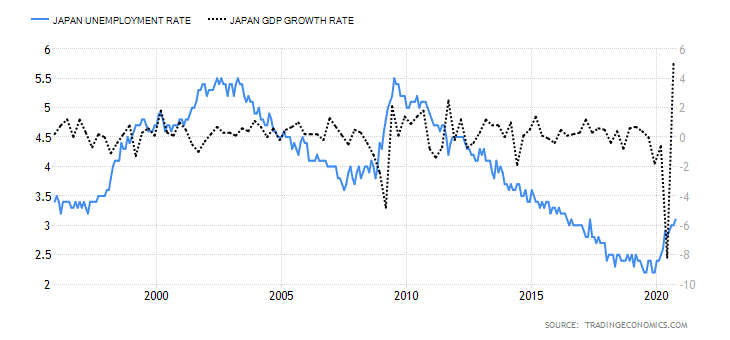
  • Japan Unemployment Rate

The unemployment rate measures the number of Japanese citizens eligible for employment who are currently seeking gainful employment opportunities.

An increasing rate of unemployment means that more jobs are lost in the economy faster than new jobs are being created. That’s an indicator that the economy is contracting.

In October 2020, Japan’s unemployment rate increased to 3.1%, representing 21.4 million people, the highest recorded since May 2017.

Due to the high correlation between the unemployment rate and GDP, we assign it a score of -5.

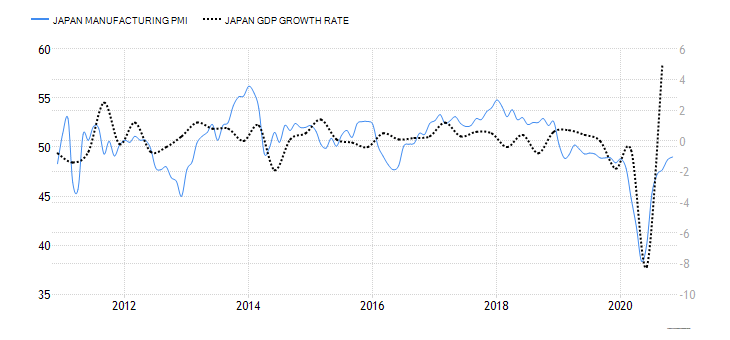
  • Japan Manufacturing PMI

The Japan manufacturing PMI is also known as the Jibun Bank Japan Manufacturing PMI. The PMI is compiled through a series of monthly questionnaires surveying about 400 manufacturers. The manufacturers are segregated depending on their industry’s contribution to GDP, and their responses aggregated into a diffusion index. When the index is above 50, it means that the manufacturing activity increased while a below 50 reading implies a slow-down in the manufacturing sector.

Japan is a highly industrialized economy, and its manufacturing activities have a high correlation with its GDP growth rate.

In November 2020, the Japan Manufacturing PMI was 49, inching closer to the highest recorded 49.3 in January. Since the manufacturing PMI has been steadily increasing from the lows of 38.4 in May, we assign it an inflationary score of 6.

This PMI is also known as Jibun Bank Japan Services PMI. It is a survey of over 400 services companies operating in the Japanese services industry. A Survey of the purchasing managers is used to track industry changes in employment, inventories, sales, and prices. Sectors covered by the survey include transport and communication, personal services, financial services, hotel industry, and IT. The responses are weighted based on the sector’s size and aggregated into an index from 0 to 100.

When the index is above 50, it signals that there is an expansion in the services industry, while below 50 shows contraction.

In November 2020, the Japan services PMI dropped to 46.7 from 47.7 in October. Although the index is above the lows of 21.5 recorded at the height of the coronavirus pandemic, it is still lower than the levels observed in the pre-pandemic period.

Based on our correlation analysis, we assign Japan services PMI an inflationary score of 2.

  • Japan Retail sales

The monthly retail sales measure the change in the value of goods consumed directly by households. In any economy, the growth in GDP is primarily driven by the demand by households. Thus, retail sales can be considered a significant indicator of economic growth.

In October 2020, the MoM retail sales in Japan increased by 0.4%, while YoY retail sales increased by 6.4%. The increase in October is the first time the YoY retail sales have increased since February. This shows demand in the Japanese economy is growing after the easing restrictions implemented in the wake of the pandemic.

Due to its high correlation with the GDP, we assign Japan retail sales an inflationary score of 5.

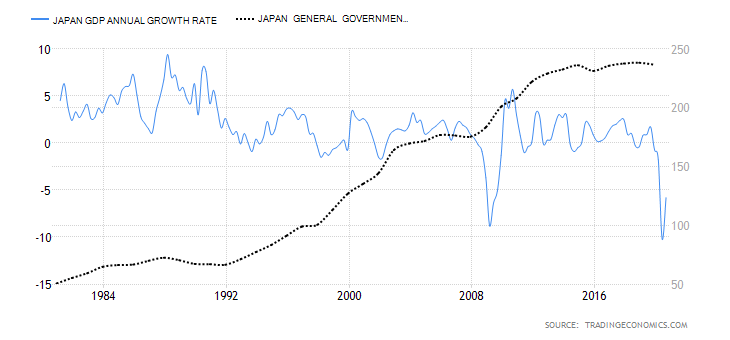
  • Japan General Government Gross Debt to GDP

This is the ratio between the amount of debt, both domestic and foreign, that the Japanese government has accumulated to national GDP. Typically, lenders use this ratio to determine if a country’s economy is overly leveraged and if the government might default in the future.

Note that Japan has the largest national debt to GDP in the world. However, although it is heavily indebted, unlike many other countries, Japanese debt is denominated in Yen. More so, foreigners only hold about 6.5% of the total debt. That is why Japan can continue to accumulate such massive debts without any fears of hyperinflation or default risks. But that doesn’t mean that the debt isn’t weighing down on the economy.

In 2019, the Japan national debt to GDP was 238%, an increase from 236.6% in 2018. In 2020, it is projected to exceed 240% due to the measures implemented to fight the pandemic. Based on our correlation analysis, we assign it a deflationary score of -3.

Please check our next article to find the Exogenous analysis of both USD and JPY currencies. We have also come to a conclusion on whether you should expect a bullish or bearish trend in this pair.

Categories
Forex Fundamental Analysis

GBP/USD Global Macro Analysis – Part 1 & 2

Introduction

To properly understand the dynamics of the price of the GBP/USD pair, we’ll conduct endogenous and exogenous analyses of the UK and the US economies.

The endogenous analysis will focus on the significant fundamental economic indicators that drive economic growth in either country. The exogenous analysis will dig deeper into how both the US and the UK economies interact with each other in terms of international trade that impact the currency exchange.

Ranking Scale

Both the endogenous and the exogenous factors that we will analyse will be ranked on a sliding scale from -10 to +10. A negative score means that the indicator resulted in currency depreciation, while a positive score implies that it led to currency appreciation.

USD Endogenous Analysis – Summary

The USD endogenous factors recorded a score of -19.1, implying a deflationary effect on the USD. This essentially means that according to these indicators, the USD has lost its value since the beginning of this year.

You can find the complete USD Endogenous Analysis here.

GBP Endogenous Analysis – Summary

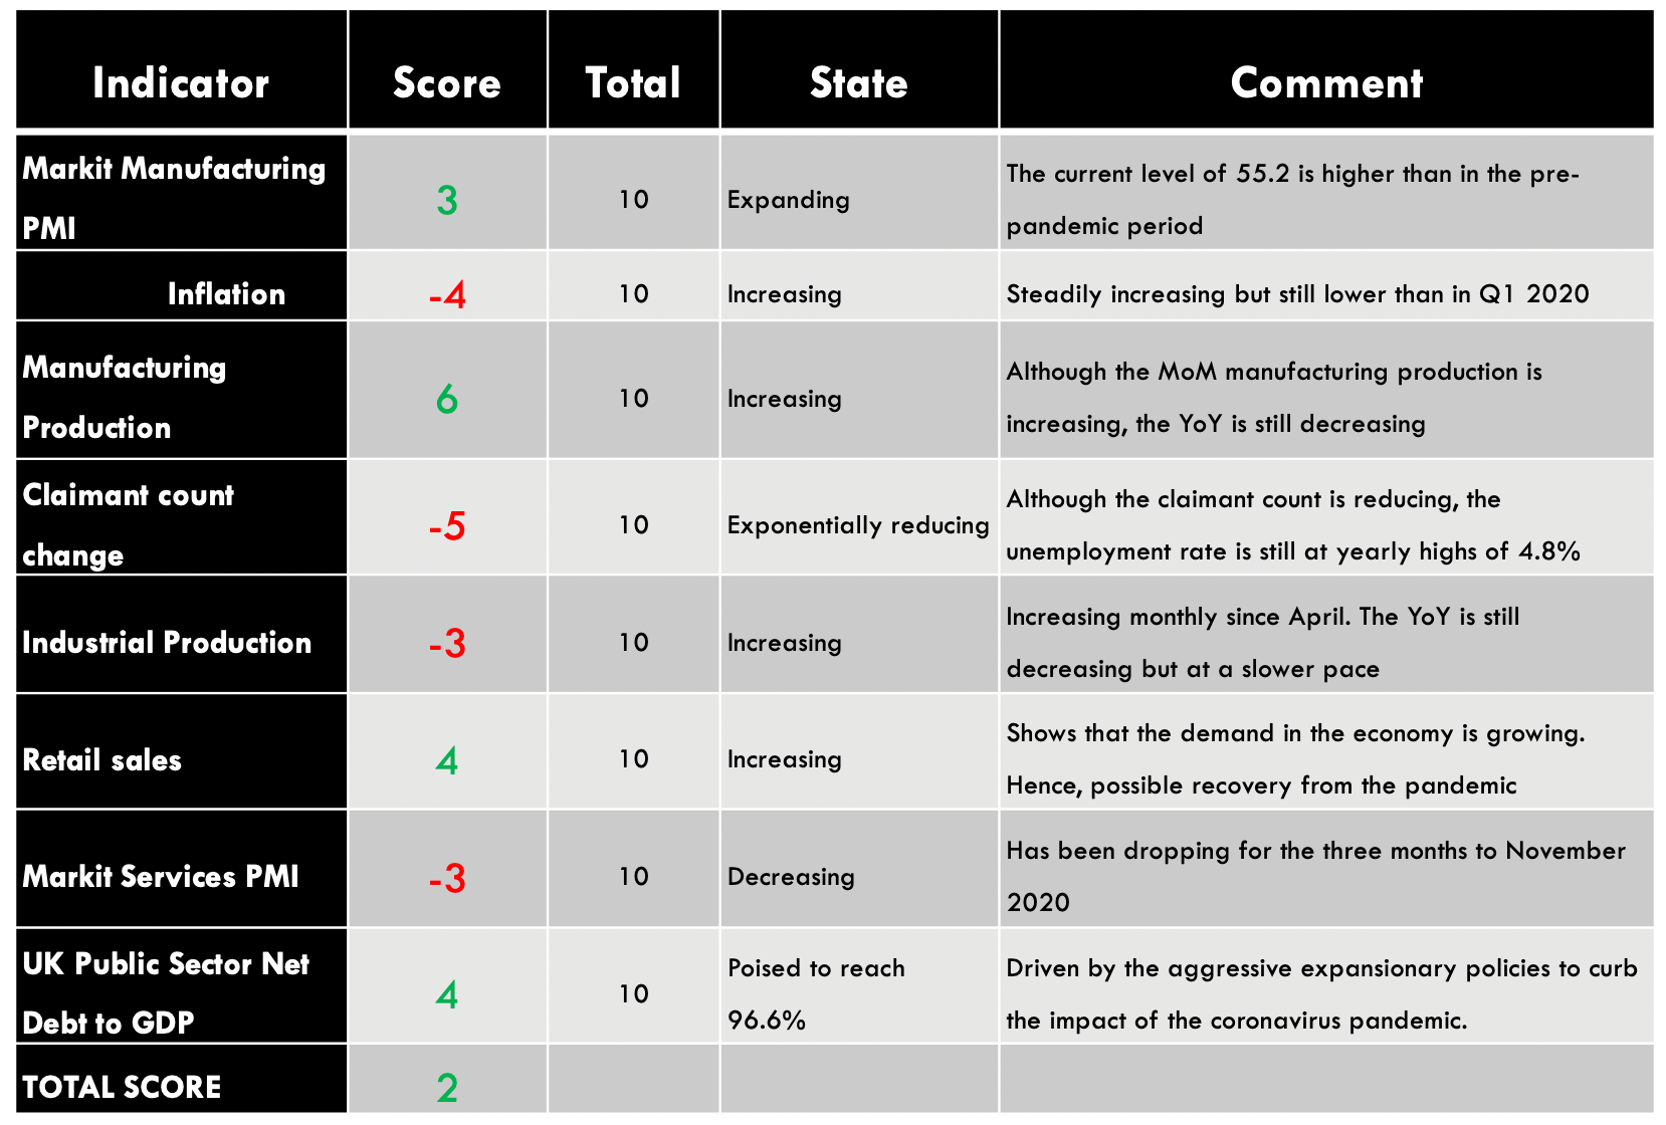
The endogenous analysis of the UK economy results in an expansionary score of 2. Therefore, we could expect the GBP increased in 2020.

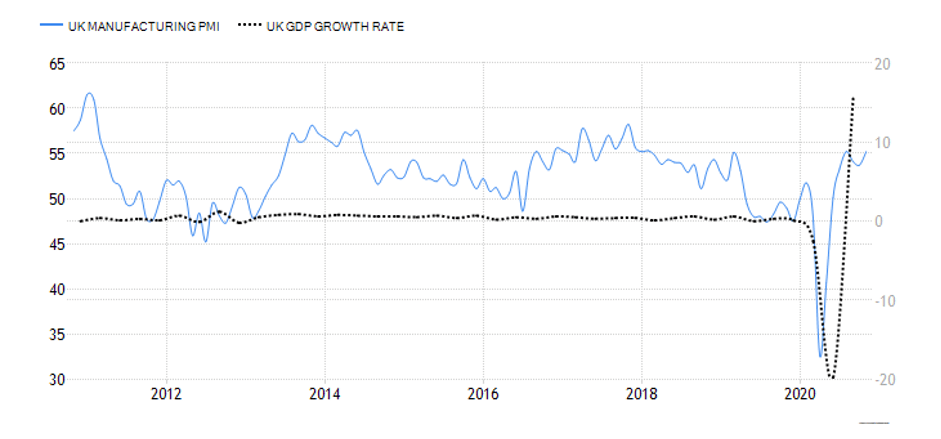
Markit Manufacturing PMI

This is a survey done on about 600 purchasing managers in the manufacturing industry, who rate the level of the business environment such as prices, new orders, inventories, supply deliveries, labour conditions, and production levels.

This is a leading indicator for the economy because businesses react almost instantly to the changing operating environment, and the purchasing managers have the most relevant insight. In November 202, the UK Manufacturing PMI was 55.2, showing that the economy is undergoing a sustained recovery. Due to its low correlation with the GDP, we assign an inflationary score of 3.

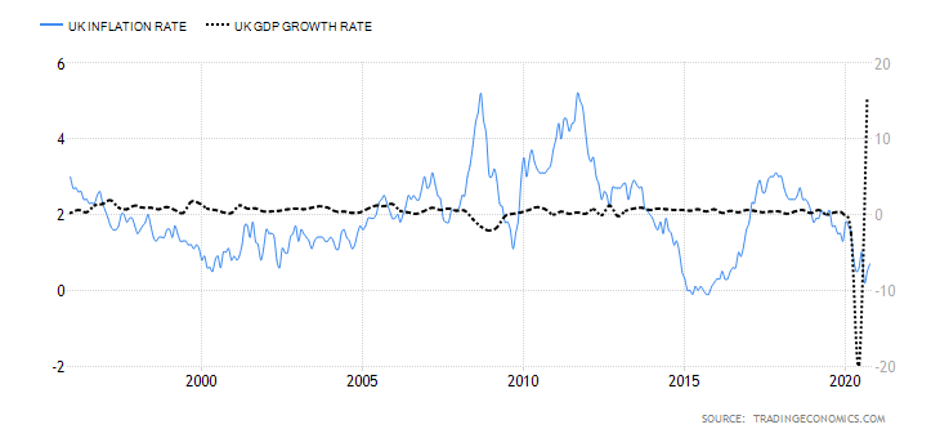
UK inflation

The CPI is based on a monthly survey done by the Office for National Statistics. This is done by comparing the current average of sample consumer items by the previous month’s prices. The BOE uses the data to adjust interest rates and QE levels to set inflation targets for the economy.

Rising inflation levels lead to higher interest rates, which makes CPI a vital currency valuation indicator. The UK inflation rate increased by 0.7% in October 2020 but is still lower than the rate in the pre-pandemic period. Based on our correlation analysis. We assign it a score of -4.

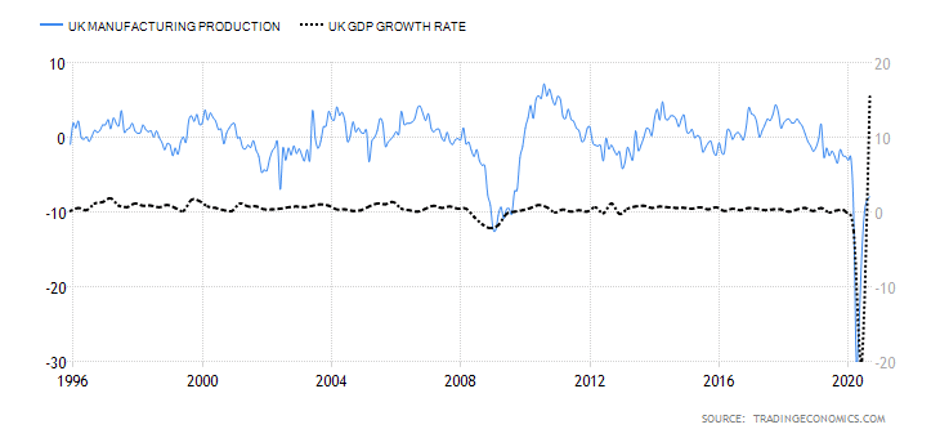
Manufacturing Production

It measures the change in the total value of inflation-adjusted output by the manufacturers in the whole economy. It is a leading indicator of the economy’s performance since production levels adjust quickly to the business cycles and heavily dependent on consumer conditions like employment changes and earning levels.

Manufacturing contributes about 80% of the UK’s industrial output and accounts for up to 42.4% of GDP changes. The year-on-year manufacturing production change in September 2020 was -7.9%. This marks the smallest decline since the onset of the coronavirus pandemic. Due to its high correlation with GDP, we assign it an inflationary score of 6.

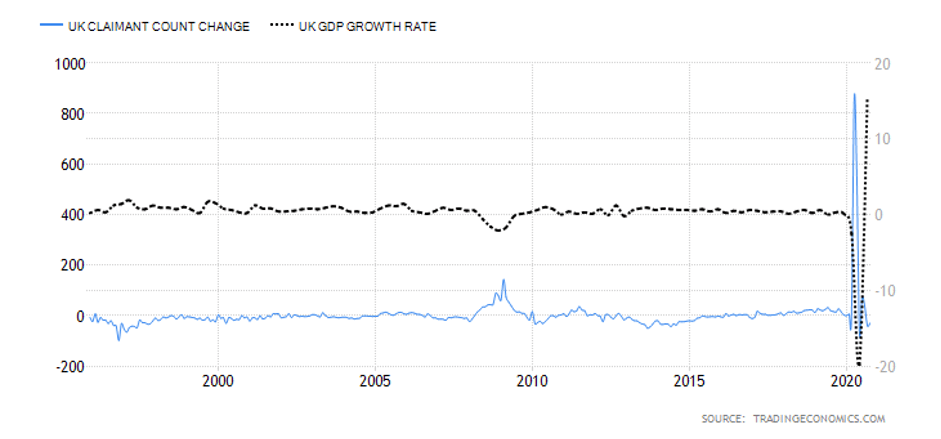
Claimant count change

It measures the change in the number of people who are seeking unemployment benefits. Hence, it is the primary indicator of unemployment levels, which makes it a vital signal of consumer expenditure levels and labour market conditions. In the UK, claimant count change is considered the best measure of the employment situation, and it accounts for 30% of changes in the GDP.

In September 2020, the number of people in the UK who claimed unemployment benefits dropped by 29800. However, the unemployment rate remains at yearly highs of 4.8%. For this reason, we assign a score of -5.

Industrial Production

It measures the change in output from the mines, manufacturers, and utilities, adjusted for inflation. While manufacturing makes up 80% of the industrial production, mines and utilities make up 20%, and their effects on the real economy are thus overshadowed.

It is a significant leading indicator of the economy’s health since industrial activities correspond to labour market conditions and sensitive to business cycles. In September 2020, the UK industrial MoM production increased by 0.5%. However, on a YoY basis, it is down 6.3% from September 2019. In this case, we assign industrial production a score of -3.

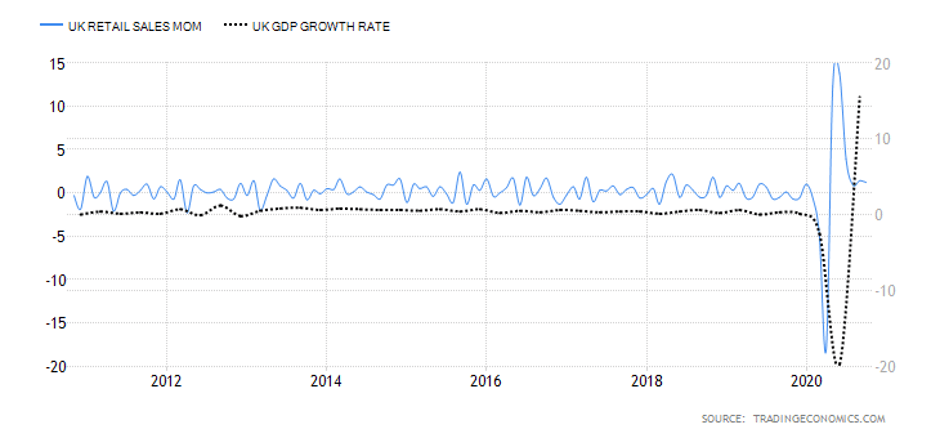
Retail Sales

It measures the change in the inflation-adjusted value of all sales at the retail level in the whole economy. It is the primary measure of how much consumer expenditure accounts for most of the country’s economic activity.

In October 2020, the UK MoM retail sales increased by 1.2%, which is the 6th consecutive increase in retail sales from the slump recorded at the height of the coronavirus pandemic. Based on its correlation with GDP, we assign retail sales an inflationary score of 4.

Markit Services PMI

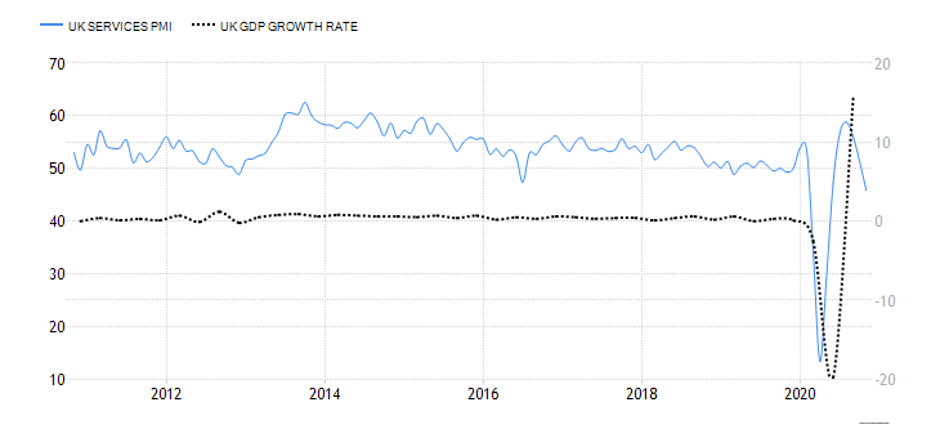
This is a survey on about 400 purchasing managers in the services industry, who rate the business environment using factors such as employment, new orders, pricing, inventories, and supplier deliveries. A score of above 50 signifies an expansion, while below 50 indicates a contraction in the services industry.

In November 2020, the Marking UK Services PMI was 45.8 – a significant drop from 51.4 in October. Although the Services PMI has increased from the April lows, it is still lower than in January 2020. Combined with its low correlation with the UK GDP, we assign a deflationary score of -3.

United Kingdom Public Sector Net Debt to GDP

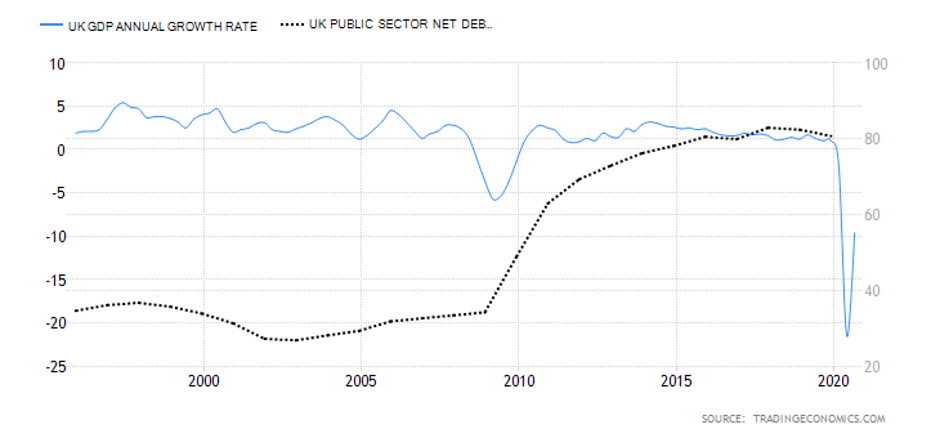
This is also called Government Debt to GDP Ratio. Most investors, bilateral and multilateral lenders use this ratio to determine a country’s ability to service any debt they take on. Naturally, when the ratio is higher, it means that the government is piling on more debt, but the GDP is not increasing at the same rate. Since higher GDP would mean higher sources of revenue, if the GDP is not increasing at the same pace as the amount of debt, it implies that the government might struggle with debt repayment.

In 2020, the UK Public Sector Net Debt to GDP is projected to reach historic highs of 96.6%. This increase is mainly attributed to governments’ efforts to prop up the economy through aggressive expansionary policies during the pandemic. Based on our correlation analysis, the increase in the United Kingdom Public Sector Net Debt to GDP in 2020 served its purpose to avoid irreversible recessions. We, therefore, assign an inflationary score of 4.

In our next article, we will analyze the Exogenous factors of both USD and GBP to come to an appropriate conclusion.

Categories
Forex Fundamental Analysis

USD/CAD Global Macro Analysis – Part 3

Introduction

The exogenous analysis for the USD/CAD pair will involve analyzing factors that significantly contribute to these two currencies’ interaction. Remember, when trading forex, you are trading a currency pair, which means you buy one currency and sell the other. With exogenous analysis, you get the bigger picture regarding the currency pair as a whole. In a sense, the exogenous analysis compares how the endogenous factors between the US and Canadian economies net against each other.

For the exogenous analysis, we’ll focus on:

US and Canadian Interest rate differential

Interest rate differential is the difference between the interest rates in the US and Canadian. When the interest rate in one country s higher than the other, investors will pull their funds from the country with the lower interest rate to invest in high yielding securities in the country with the higher interest rate.

Canada’s interest rate has for most of the year been higher than that in the US. We, therefore, expect that from March 2020, the USD weakened against the CAD. However, since the current interest rate differential is 0%, going forward, we do not expect that it will play a significant role in determining the value of the USD/CAD pair. Hence, we assign it a neutral score of 0.

GDP Growth Differential

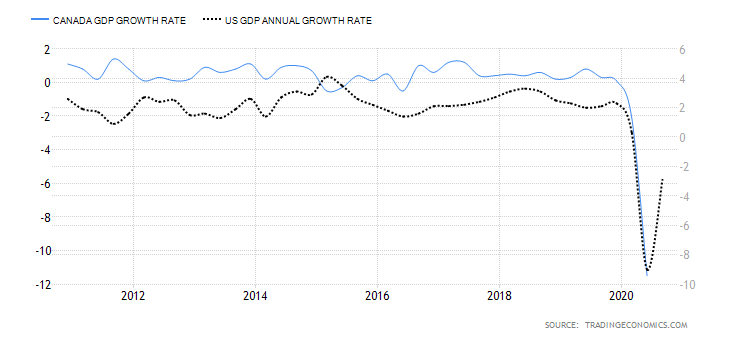
A country’s GDP growth is mainly propelled by growth in international trade. Therefore, when the GDP expands, we can expect that the country is becoming a net exporter. That means the demand for its currency increases in the international market, which also increases its value.

Over the years, the Canadian GDP growth rate has outpaced that of the US. However, in the third quarter of 2020, the US GDP growth rate outpaced Canada by 23.1%. Based on our correlation analysis between the GDP differential and the USD/CAD pair, we assign an inflationary score of 2. If this trend continues, we expect a future strengthening of the USD against CAD.

Differences in Trade Balance

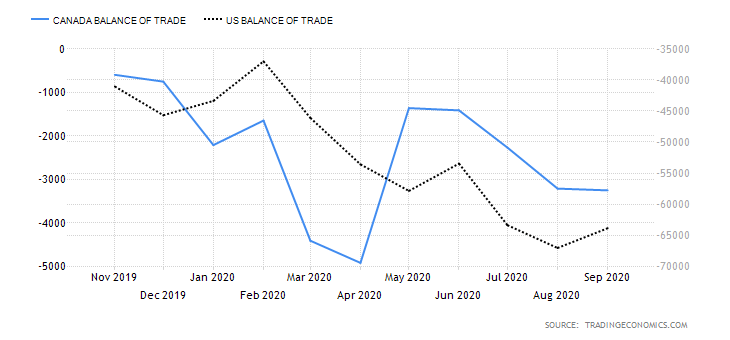
The balance of trade helps to show the trade deficits that a country operates in the international market. The trade deficit widens as the country consistently becomes a net importer. Furthermore, the trade deficit can also widen if the value of the goods exported by a country drops while the value of imports increases.

From April 2020, the Canadian trade deficit has been widening as compared to that of the US. In October 2020 data release, the Canadian trade deficit widened by CAD 3.25 billion while the US trade deficit widened by $3.1 billion. Due to its high correlation with the USD/CAD pair, we assign the difference in trade deficit an inflationary score of 3. If this trend persists, we expect it to result in bullish USD/CAD.

Conclusion

Based on the exogenous analysis, the USD/CAD gets an inflationary score of 5. It implies that if the current trend of the exogenous factors persists, we can expect a bullish trend for the USD/CAD pair in the near term.  Now that we know the trend, we can use technical analysis to find accurate entries and exits in this currency pair while keeping the bullish trend in mind.

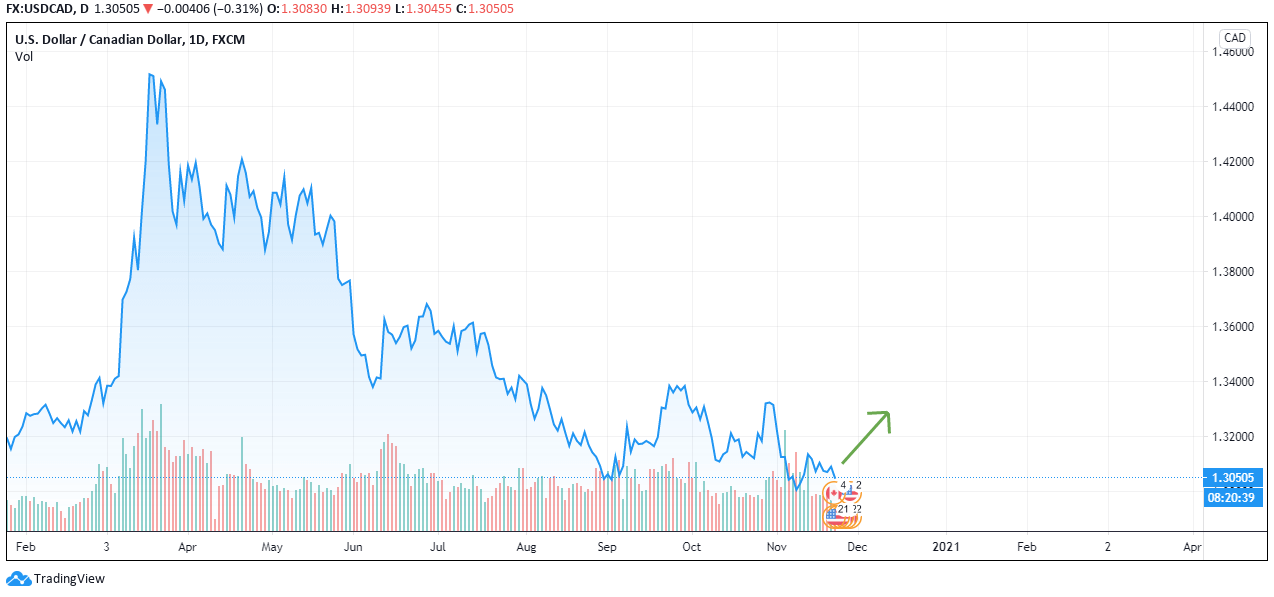
From the exogenous analysis of the USD/CAD pair, we have observed that the pair is expected to adopt a bullish trend in the near term. Let’s see if this is supported by technical analysis. In the below weekly chart, we can see the pair bouncing off a 2-year support line and from the oversold territory of the Bollinger Bands. This indicates a clear bullish trend in the near future. 

We hope you found this analysis informative. Please let us know if you have any questions in the comments below, and we would love to address them. Cheers.
Categories
Forex Fundamental Analysis

USD/CAD Global Macro Analysis – Part 2

CAD Endogenous Analysis – Summary

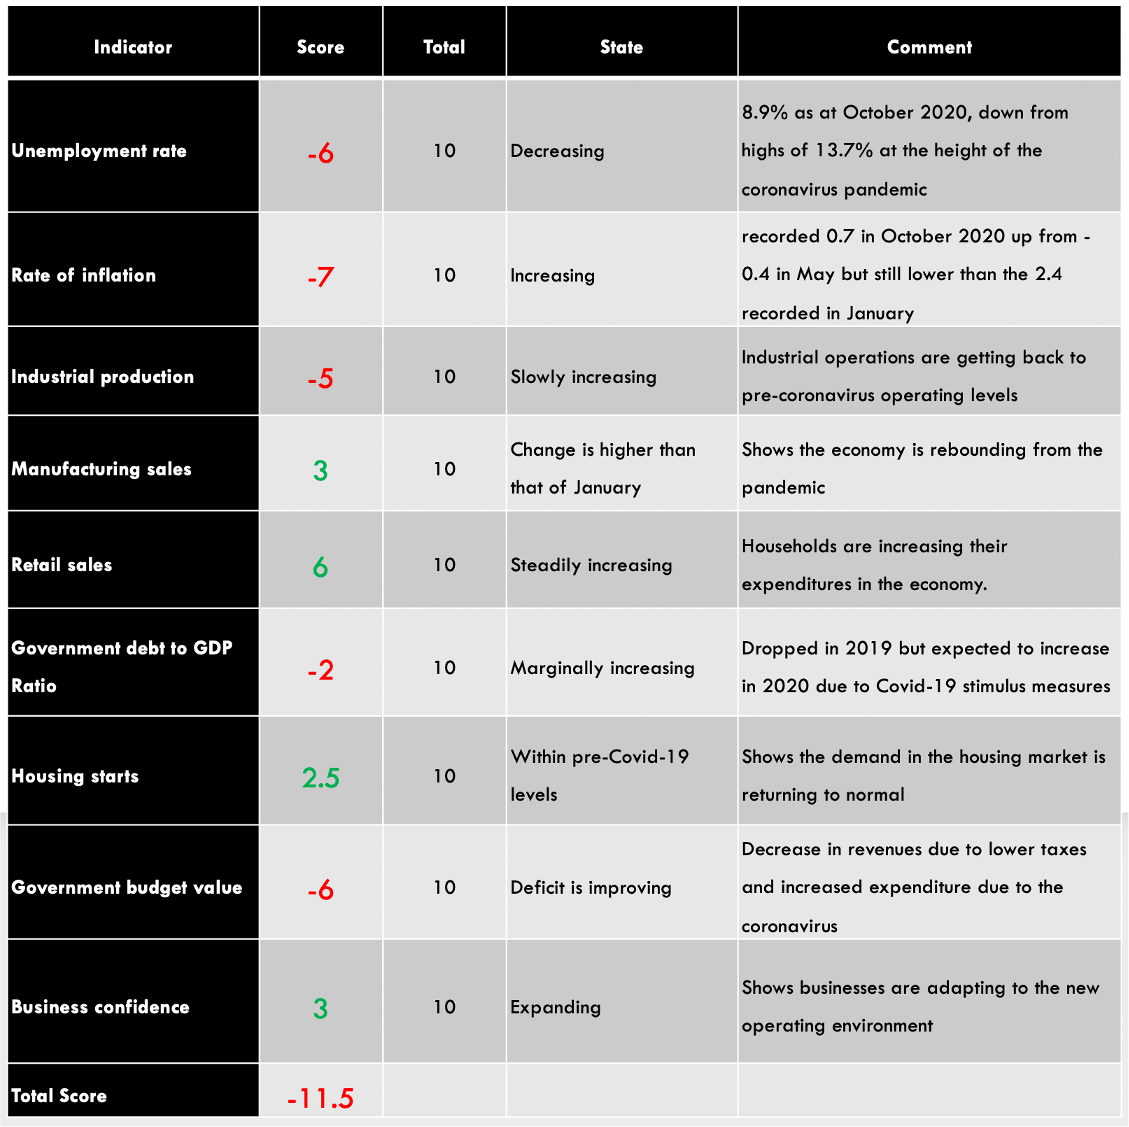
The Canadian endogenous factors recorded a score of -11.5, implying a deflationary effect in the CAD as well. This means that according to the Fundamental indicators, the CAD has also lost its value since the year began, but not as much as the USD.

Unemployment Rate

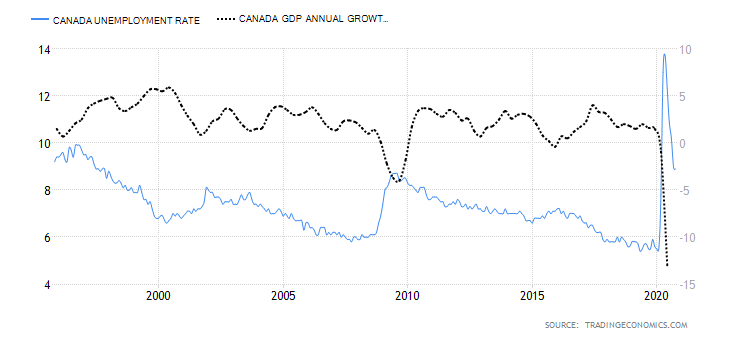
The unemployment rate measures the number of people who do not have jobs and are actively seeking gainful employment. The unemployment rate is used to show business cycles and economic growth because when businesses expand, the demand for labor is higher when the economy is undergoing a contraction, the demand for labor decreases, and the unemployment rate increases.
In October 2020, the Canadian unemployment rate was 8.9% down from the historic highs of 13.7% registered in May 2020. The rate is still higher than the 5.6% average before the onset of the coronavirus pandemic.
Based on our correlation analyses, the Canadian unemployment rate gets a score of -6. It means that in 2020 the unemployment rate has a deflationary impact on the CAD.

Canadian Rate of Inflation

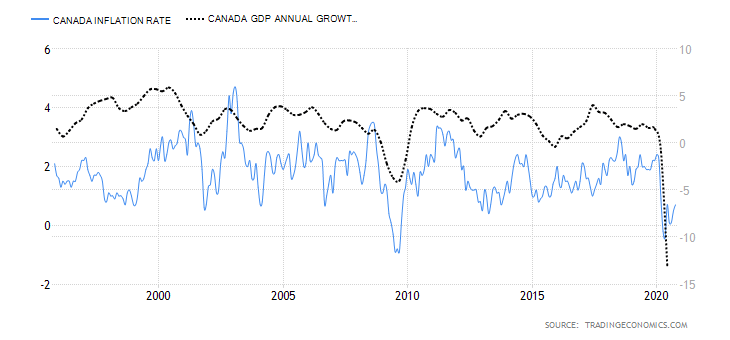
The Canadian CPI is a weighted average of the following categories: Shelter 27.5%, Transportation 9.3%, Food 16.1%, household operations 11.8%, education and recreation 11.8%, clothing 5.7%, health and personal care 5%, and alcohol and tobacco 3%.

The CPI target in Canada is 2%. The Bank of Canada uses monetary policy to maintain inflation within the target range of 2%. An increasing rate of inflation is positive for the CAD.

In October 2020, the annual inflation rate in Canada rose to 0.7 from lows of -0.4 in May 2020, but still below the 2.4 recorded in January.

We assign the Canadian rate of inflation a score of -7, meaning it had a negative impact on the CAD.

Canada Industrial production

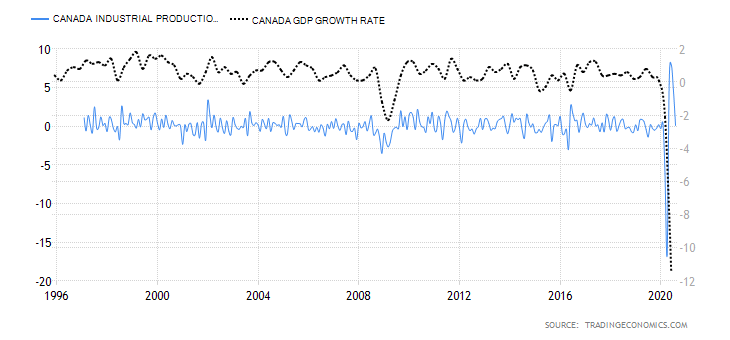
Industrial production is used to measure the output from manufacturing, mining, and the utility sectors in Canada.

In August 2020, the industrial production in Canada declined by 9.04%. Based on our correlation analysis of the Canadian industrial production and GDP, we assign it a deflationary score of -5.

Manufacturing sales

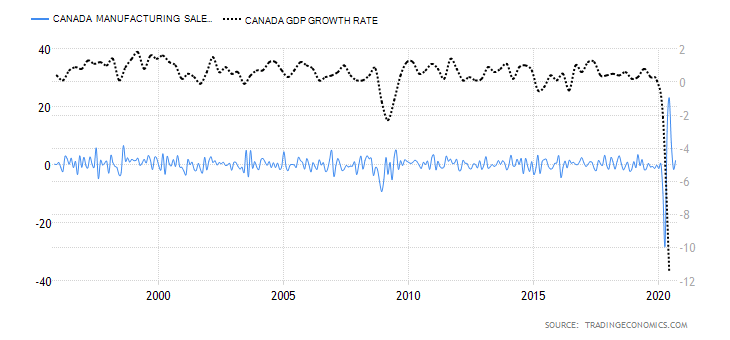
The Canadian manufacturing sales measure the value changes in the output from the manufacturing goods in the economy. It can be used to measure the short-term health of the manufacturing sector and, by extension, the health of the overall economy.

In September 2020, the manufacturing sales were worth CAD 53.8 billion, representing a 1.4% increase from August. However, manufacturing sales are still 3.6% below the pre-coronavirus period.

Based on the correlation analysis with the Canadian GDP, we assign an inflationary score of 3 to the manufacturing sales.

Retail sales

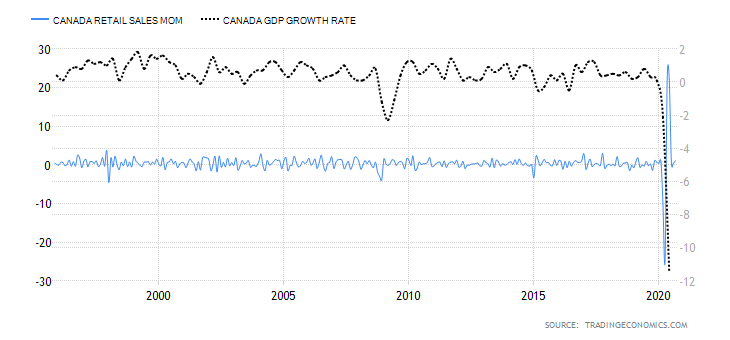
The Canadian retail sales data measures the total value that households spend on purchasing goods and services for direct consumption. This value is adjusted for inflation.

Consumption by households accounts for up to 78% of the Canadian GDP. Changes in the retail sales data can be used as a leading indicator of the welfare of households. Higher retail sales imply increased demand in the economy hence higher manufacturing and lower unemployment rates.

The retail sales in September 2020 steadily increased by 1.1% from lows of -26.4% in April. Based on the correlation analysis with the GDP, we assign retail sales a score of 6.

Government debt to GDP ratio

In 2019, Canada’s public debt to GDP was 88.6, representing a 1.26% decline from 89.7 registered in 2018.

In 2020 the government debt to GDP in Canada is expected to rise due to the various stimulus packages necessitated by the coronavirus pandemic. However, based on the past correlation analysis with GDP, we assign a marginal deflationary score of -2 on Canada’s government debt to GDP ratio.

Canada housing starts

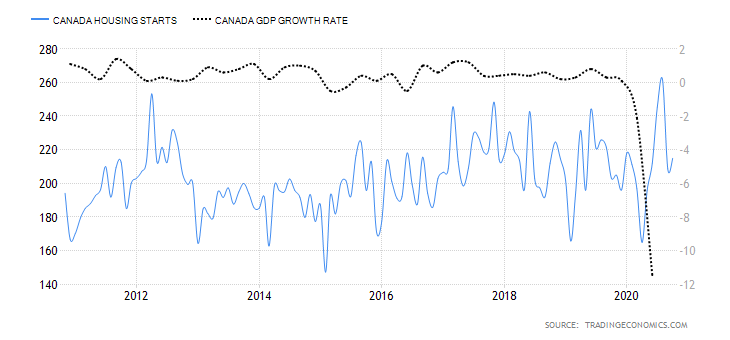
The housing starts indicators track the number of new residential buildings that begin construction. It is used as a leading indicator of the demand in the real estate market and demand in the housing market.

In October 2020, the housing starts in Canada were 214,875 units. Based on the correlation analysis with the GDP, we assign Canadian housing starts an inflationary score of 2.5.

Canada Government Budget Value

This indicator measures the value of the Canadian budget in terms of surplus or deficit. It takes into account the difference between revenues collected and the expenditures by the government. The government budget value doesn’t include public debt.

As of August 2020, the Canadian budget deficit was CAD 21.94 billion. Revenue collected by the government during the month dropped by CAD 1.3 billion, while expenditures increased by CAD 42.92 billion due to COVID-19 response measures.

Based on its high correlation with the GDP, we assign a deflationary score of -6.

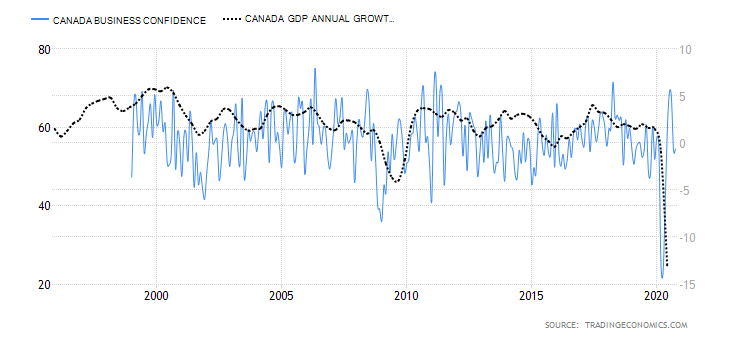
Business confidence

In Canada, business confidence is measured by the Ivey Purchasing Managers’ Index (PMI). It measures the business expectations and operating environment from the perspective of an operating panel of purchasing managers from both private and public sectors across Canada.

The Ivey PMI focuses on supplier deliveries, purchases, employment, inventories, and prices. Values over 50 imply expansion while below 50 implies contraction.

The Ivey PMI reading for October 2020 was 54.5, indicating expansion. From our correlation analysis, we assign Canadian business confidence an inflationary score of 3.

In our next article, we will analyze the Exogenous factors of both USD and CAD to come to an appropriate conclusion.