GBP/AUD Exogenous Analysis
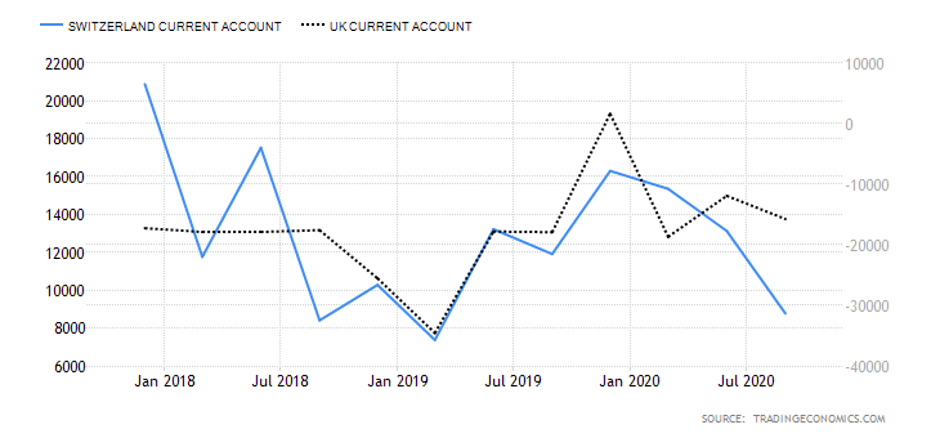
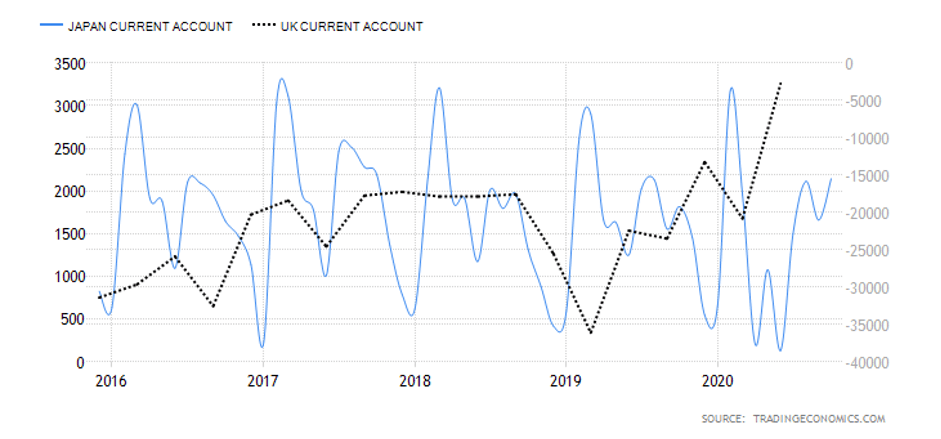
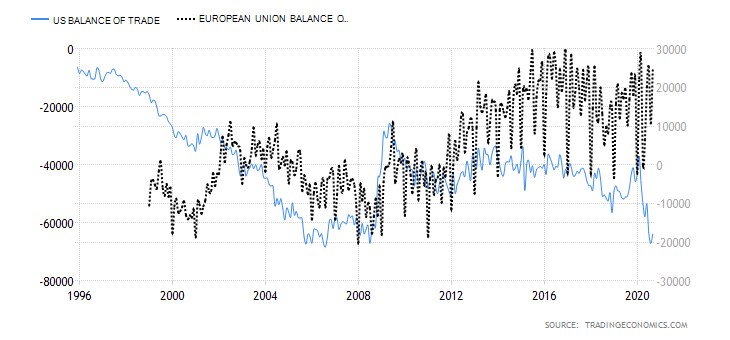
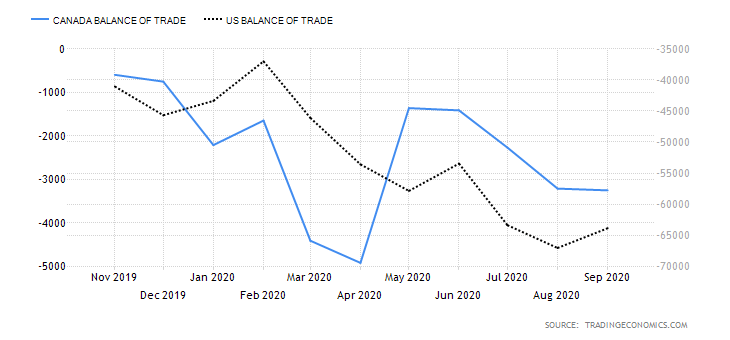
- The UK and Australia Current Account Differential
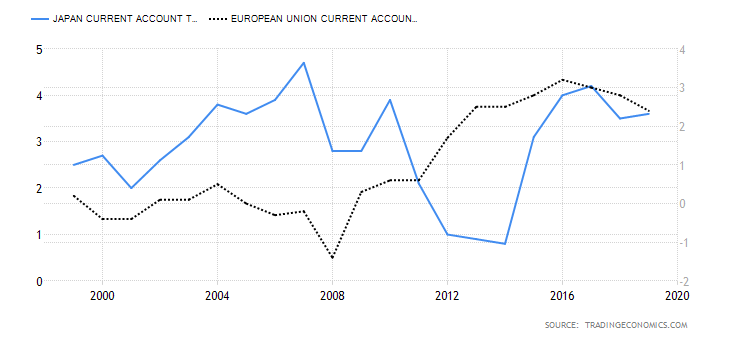
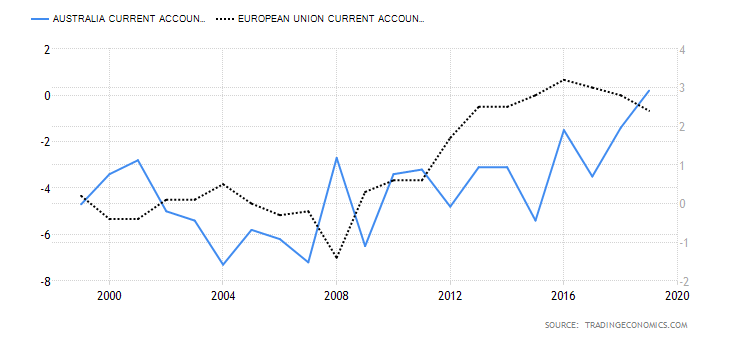
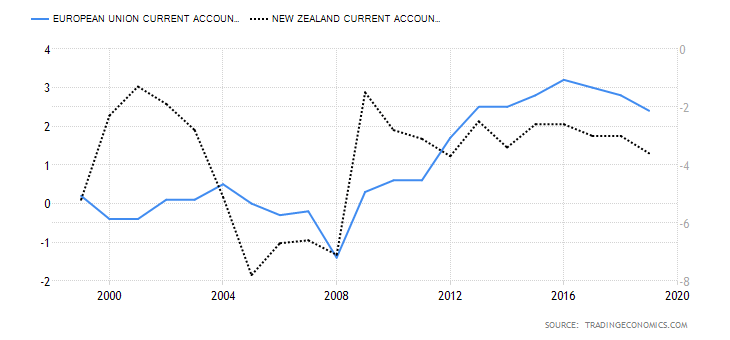
In this case, the current account differential is derived by subtracting Australia’s current account balance from that of the UK. The current account shows the net value of a country’s exports. Remember that the value of a currency is determined by its demand. Theoretically, the country’s domestic currency with a higher current account balance will have a higher demand. Therefore, its value will be higher in the forex market than in currencies with lower current account balances.
In this case, if the current account differential is positive, it means that the GBP is in higher demand than the AUD, hence a bullish trend for the GBP/AUD pair. Conversely, if the differential is negative, the GBP/AUD pair will have a bearish trend.

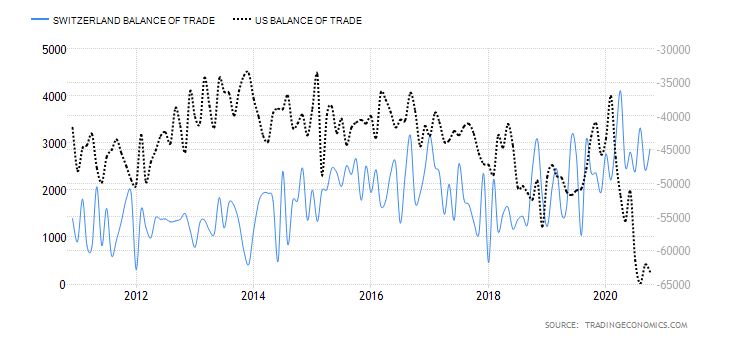
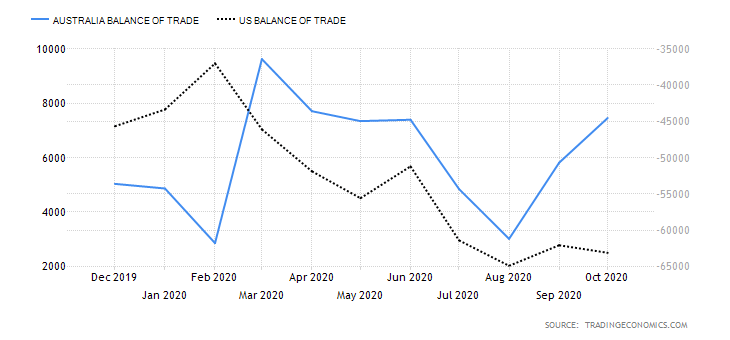
Australia had a $7.5 billion current account surplus in Q3 2020, while the UK had a $20.97 billion deficit. The current account differential is -$28.47 billion. Consequently, the current account differential between the UK and Australia has a score of -4.
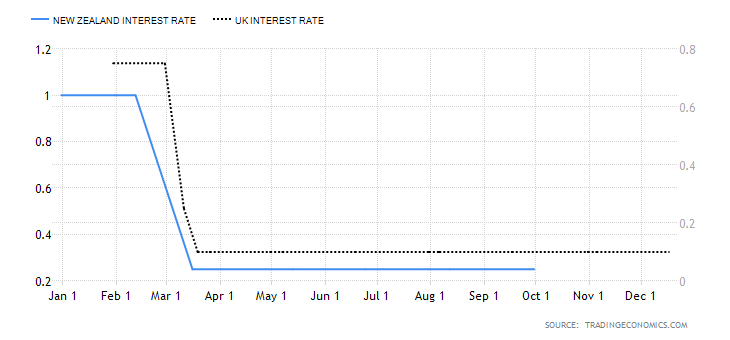
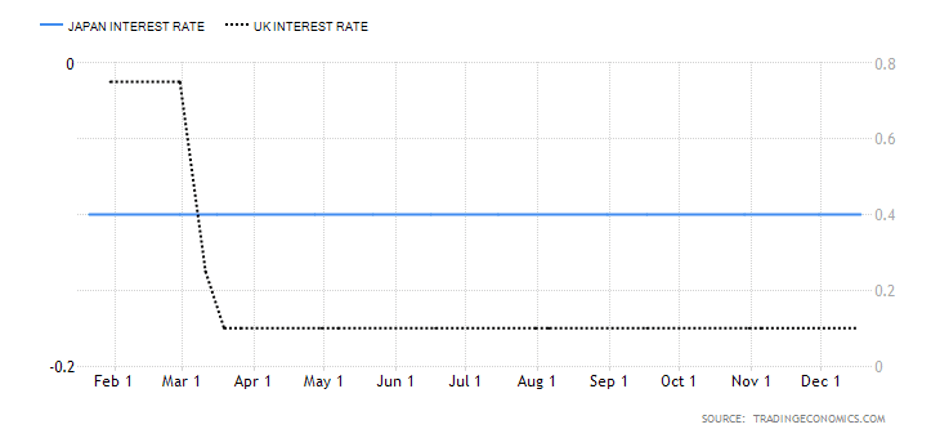
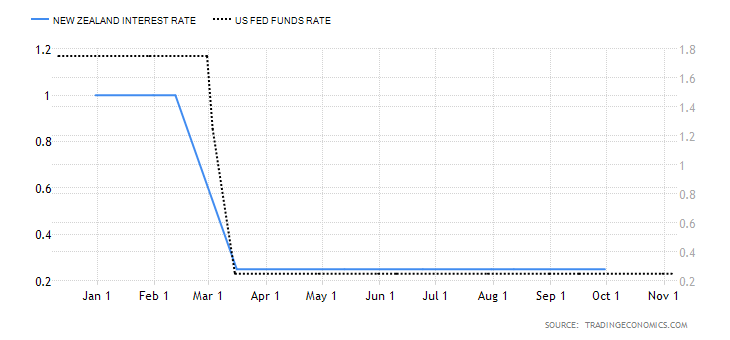
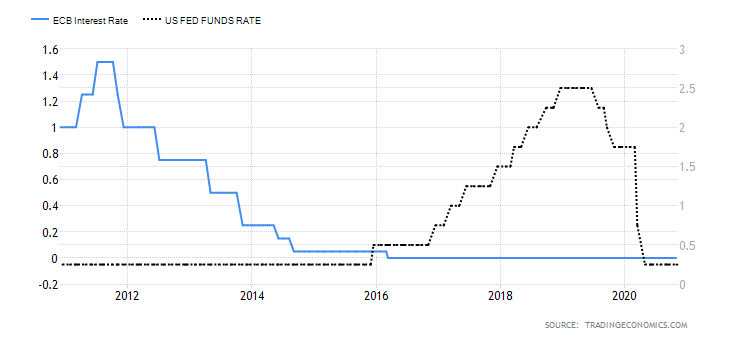
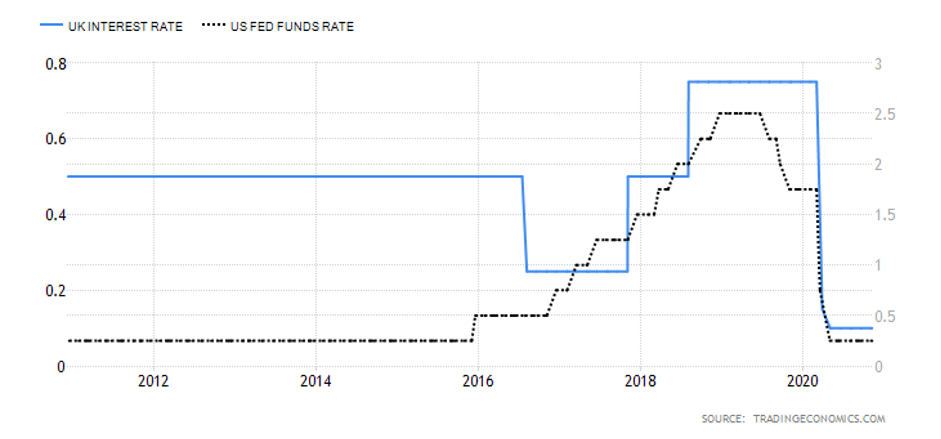
- The interest rate differential between the UK and Australia
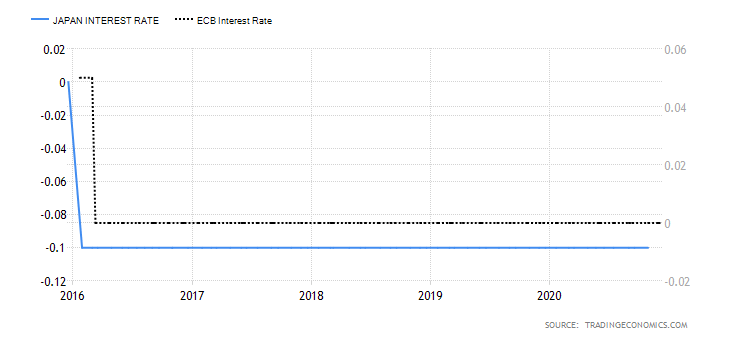
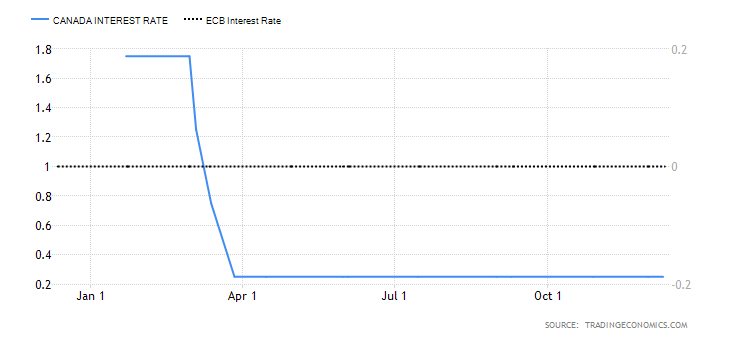
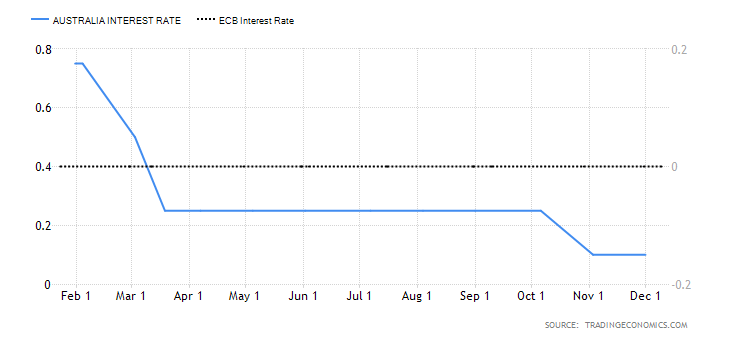
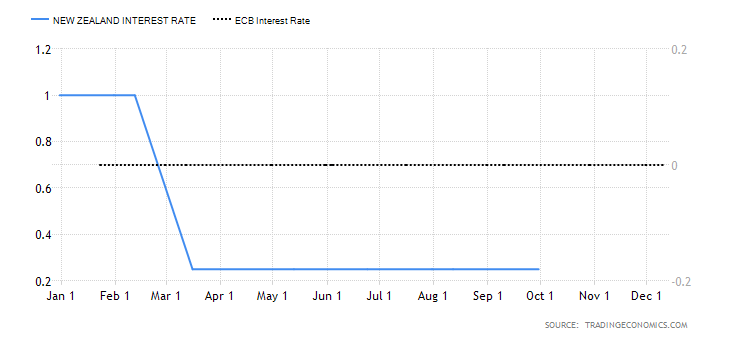
This interest rate differential is the difference between the interest rate in the UK and Australia. Typically, investors prefer to buy currencies with a higher interest rate. Therefore, if the interest rate differential for the GBP/AUD pair is positive, it means that the UK offers higher interest rates than Australia. Traders would then sell AUD and buy the GBP, which implies that the GBP/AUD pair will have a bullish trend. Conversely, if the interest rate differential is negative, Australia offers a higher interest rate. Thus, traders would sell the GBP and buy the AUD, which will force the GBP/AUD pair into a downtrend.
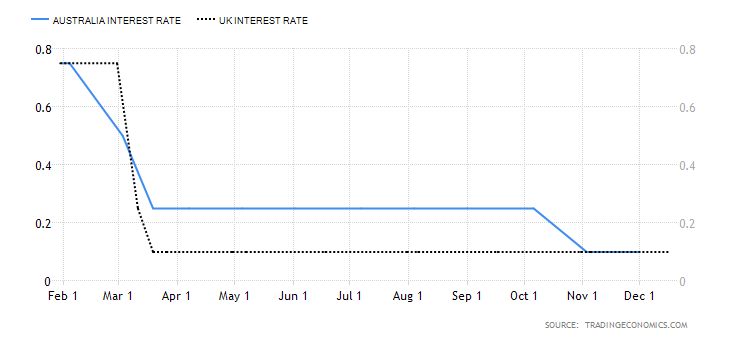
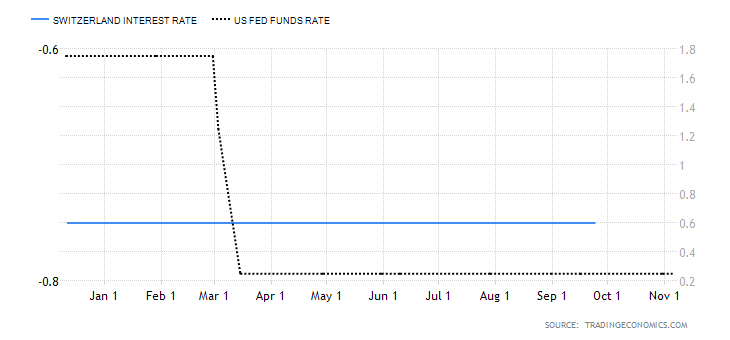
In 2020, the Reserve Bank of Australia cut interest rates from 0.75% to 0.25% and finally to 0.1% in December. The BOE cut interest rates from 0.75% to 0.1%. As of December 2020, the interest rate differential for the GBP/AUD pair is 0%. Thus, we assign a score of -1.
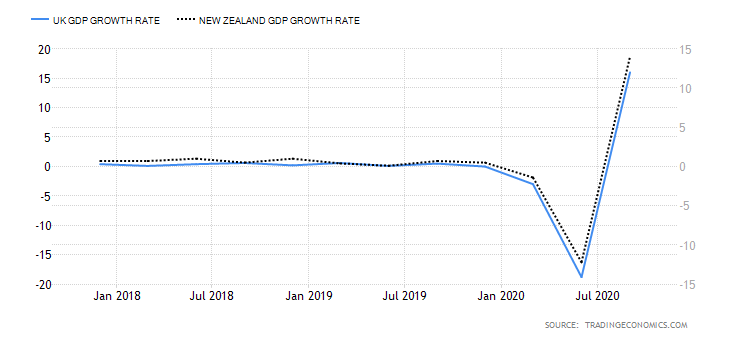
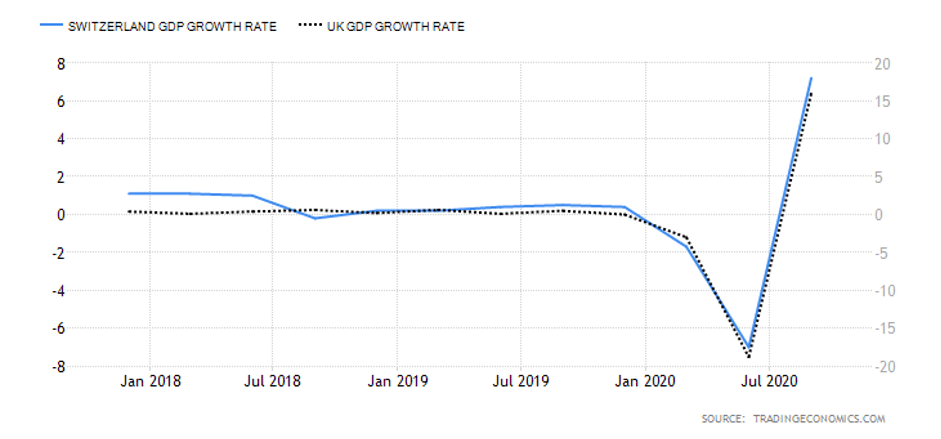
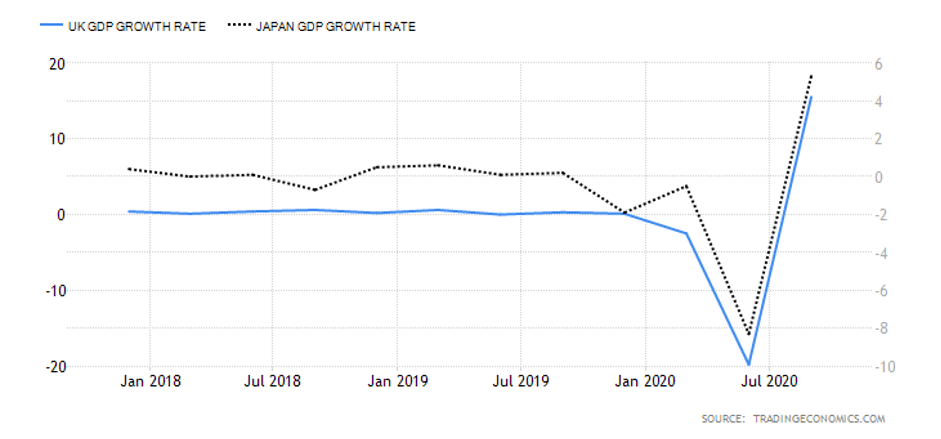
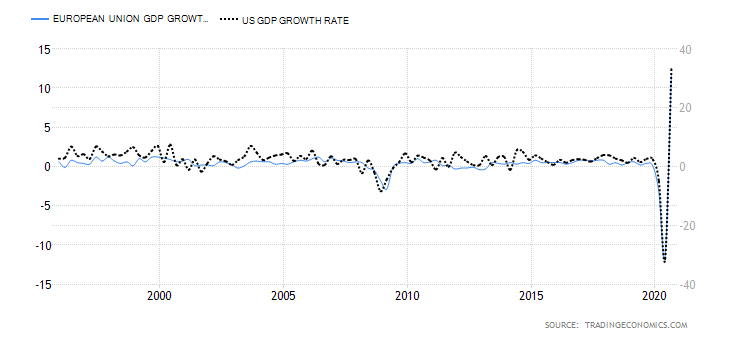
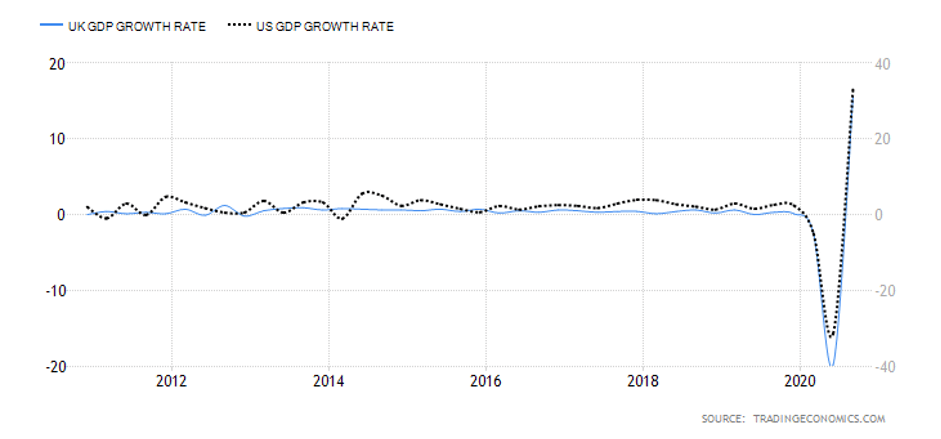
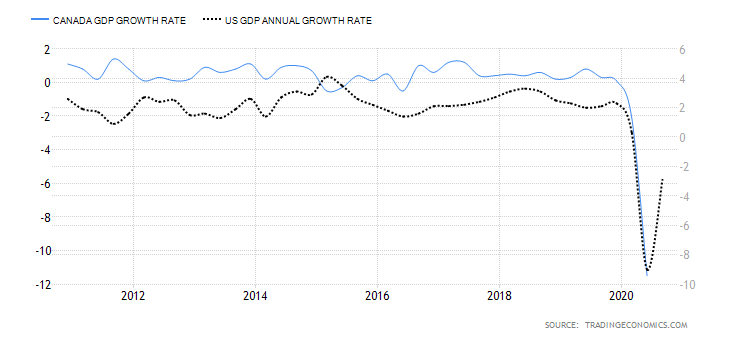
- The differential in GDP growth rate between the UK and Australia
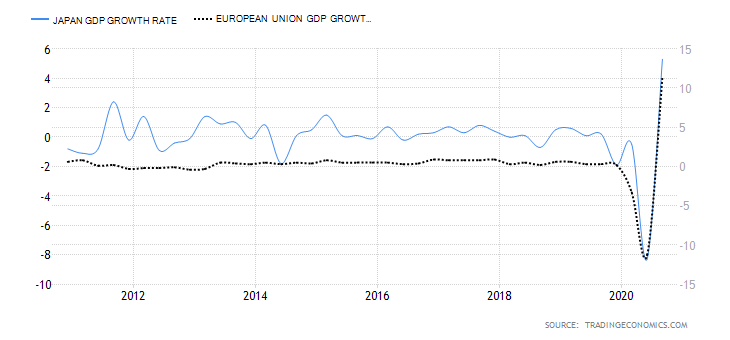
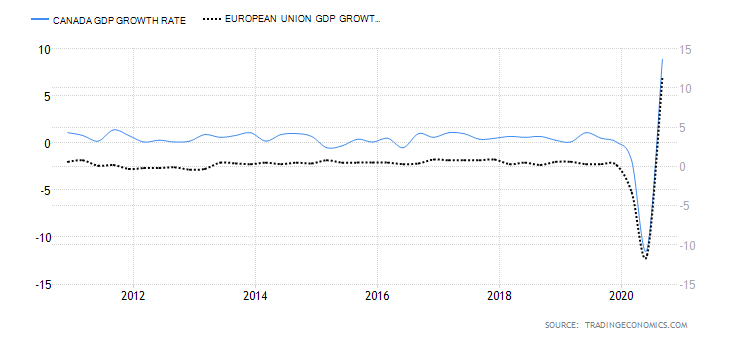
The differential in GDP growth rate measures the difference in domestic economic growth in the UK and Australia. It is expected that the domestic currency of the country whose GDP is expanding at a faster pace will appreciate faster. Therefore, if the GDP growth differential between the UK and Australia is positive, we should expect a bullish trend for the GBP/AUD pair. Conversely, we should expect a downtrend in the pair if the differential is negative.
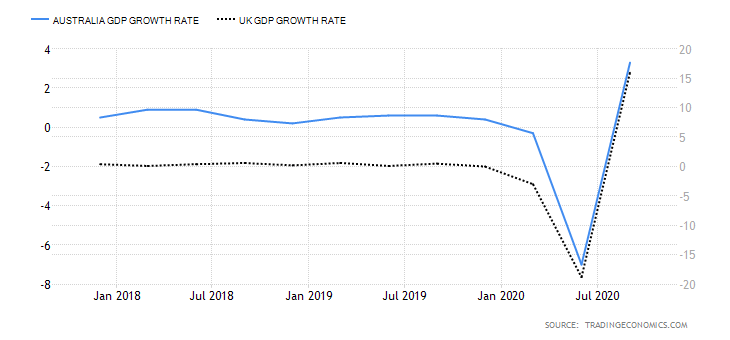
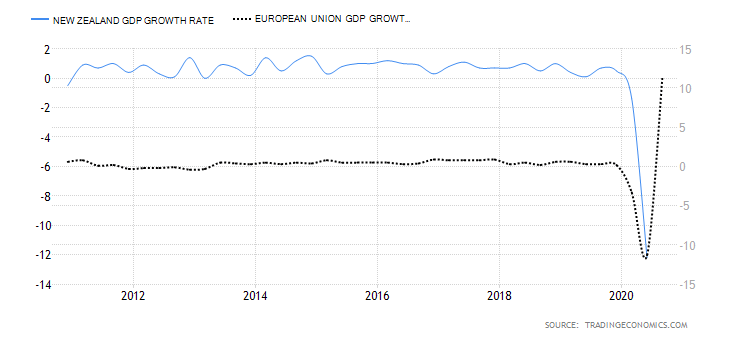
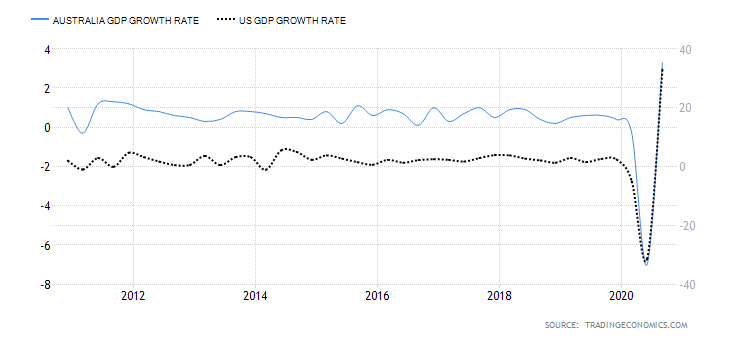
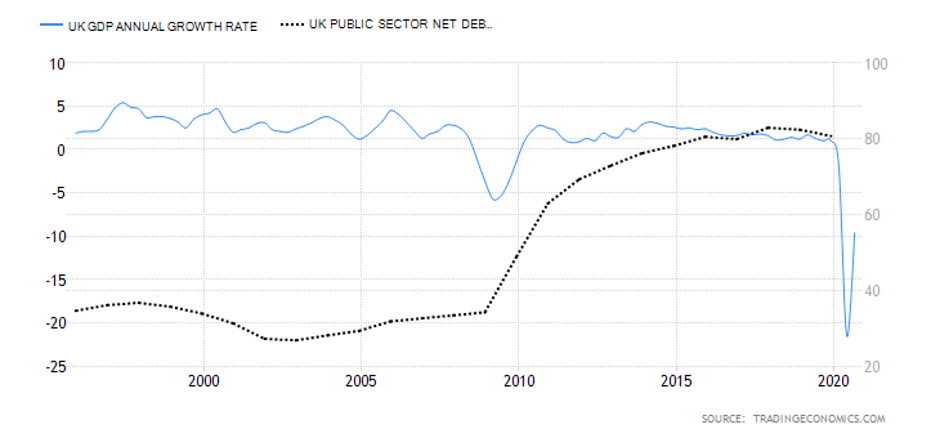
The Australian economy has contracted by 4% in the first three quarters of 2020, while the UK has contracted by 5.8%. Thus, the GDP growth rate differential is -1.8%. Hence, the score of -3.
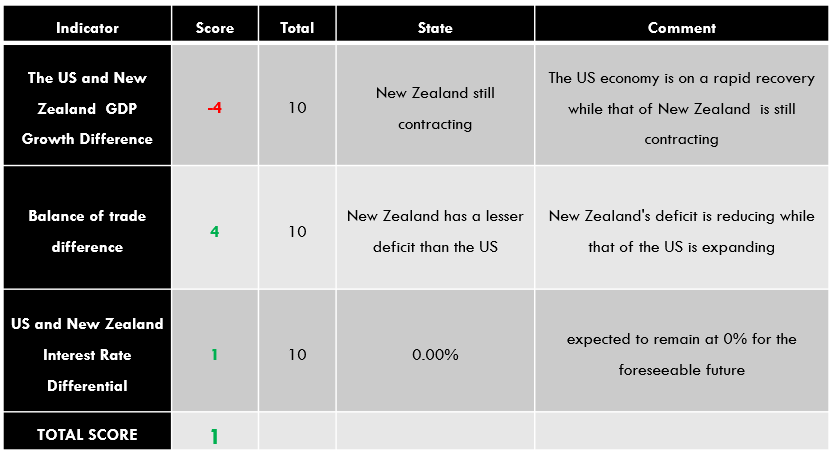
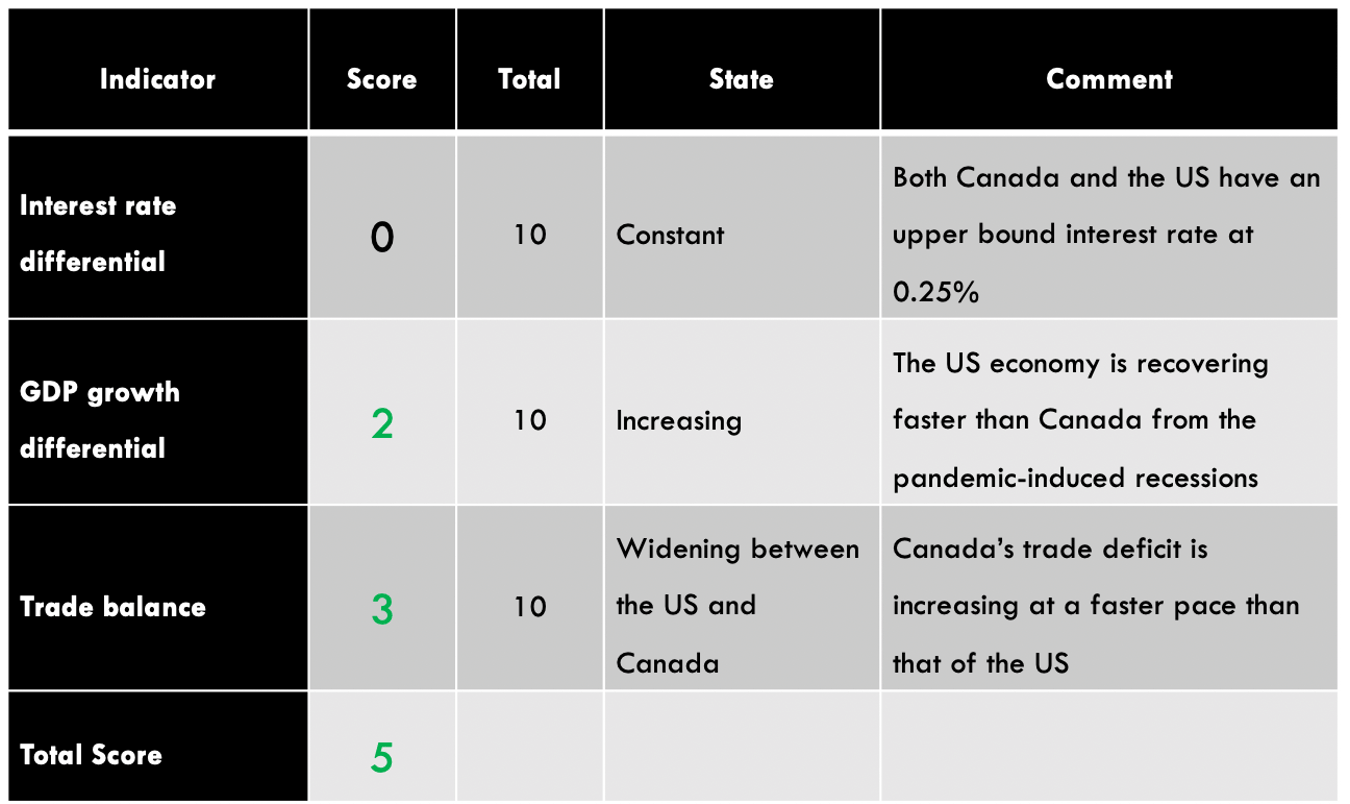
Conclusion
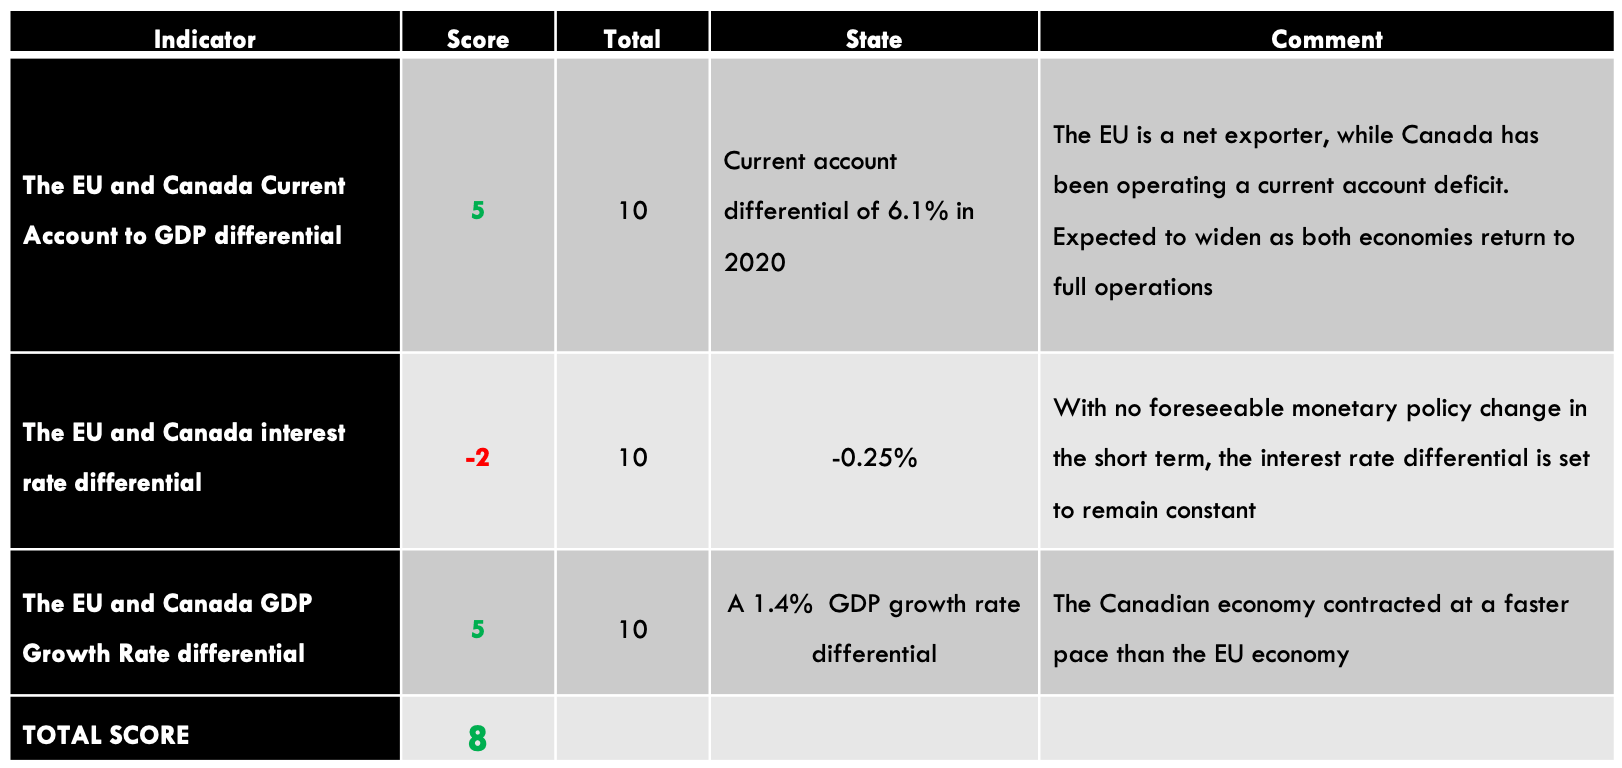
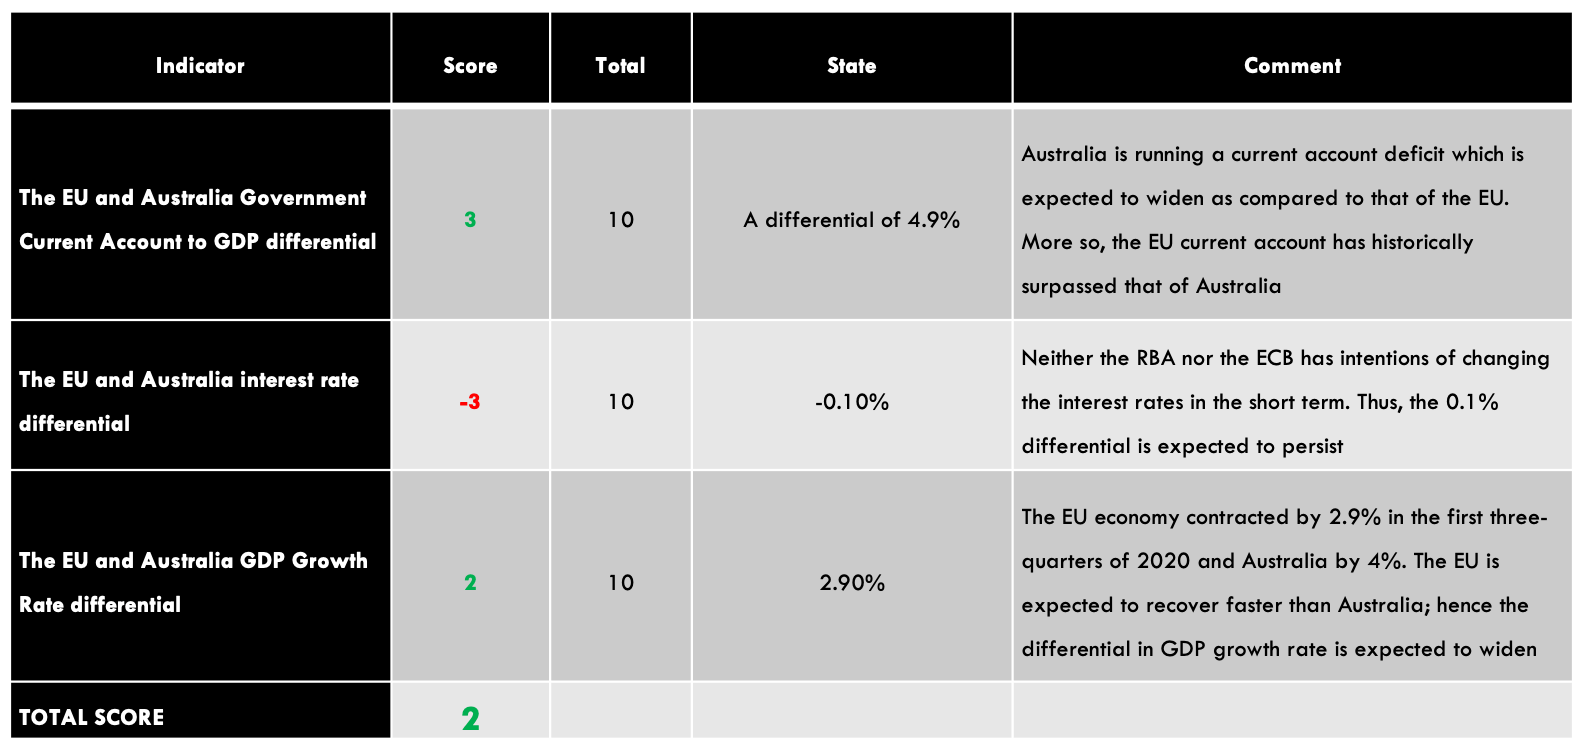
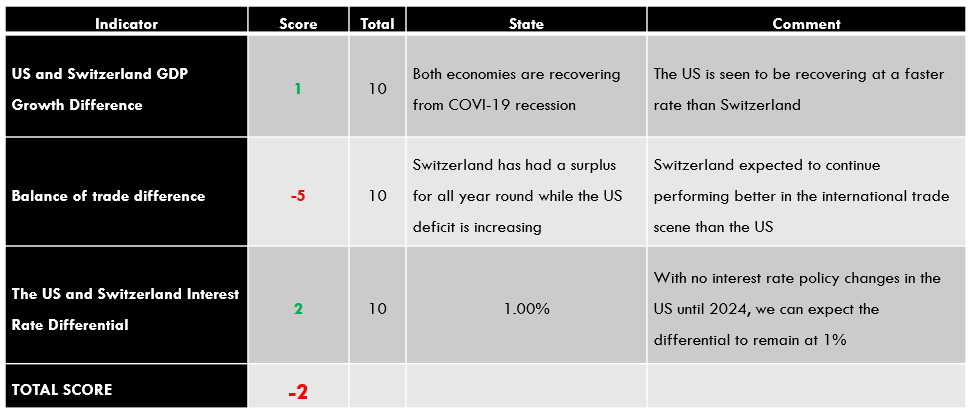
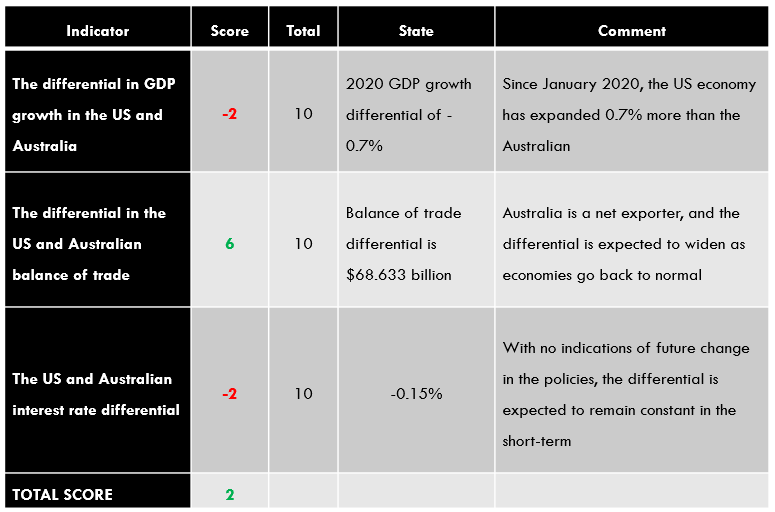
| Indicator | Score | Total | State | Comment |
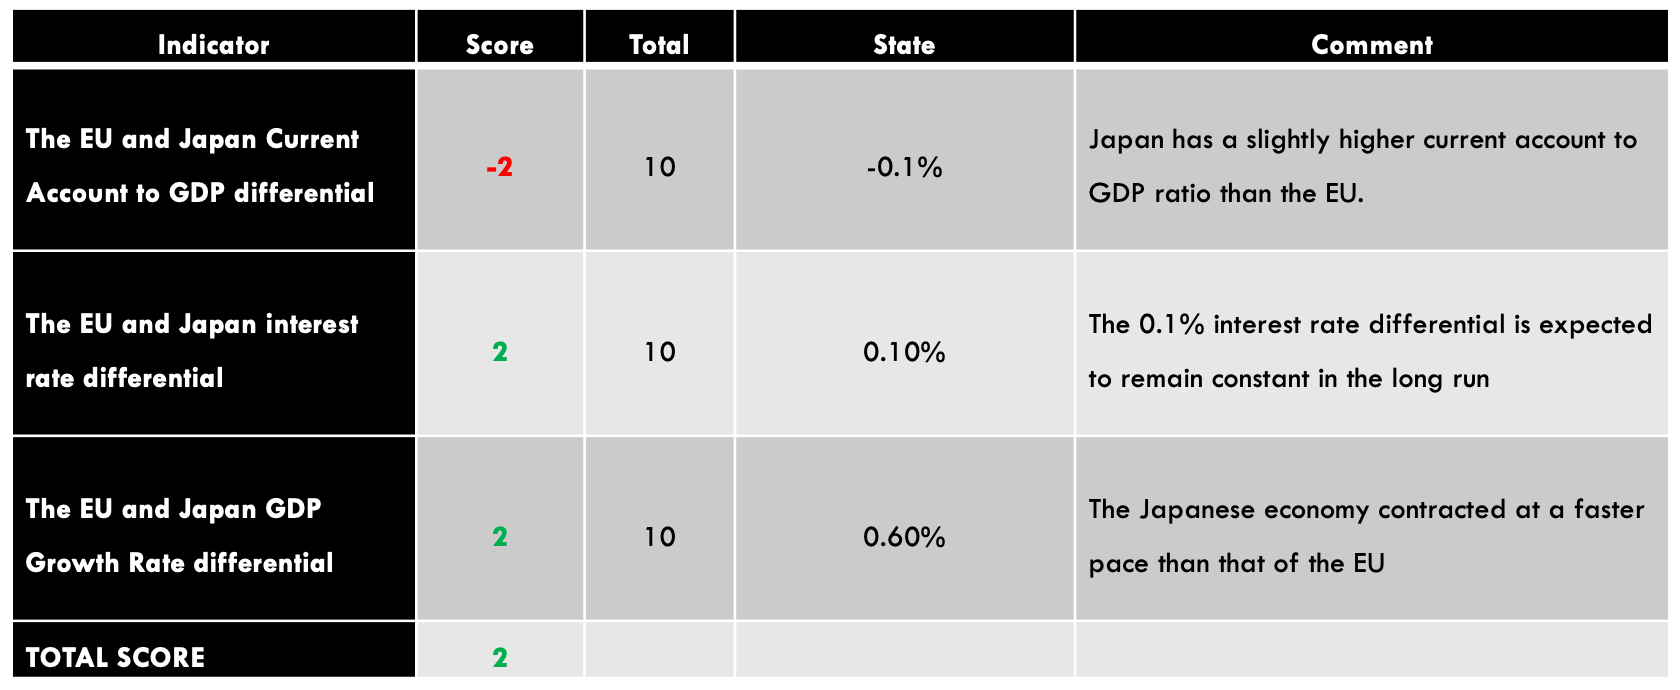
| The UK and Australia Current Account Differential | -4 | 10 | A differential of – $28.47 | Australia has a current account surplus while the UK is running a deficit. The differential is expected to increase as COVID-19 restrictions ease |
| The interest rate differential between the UK and Australia | -1 | 10 | 0.00% | Neither the RBA nor the BOE intends to change the interest rate policy in the near term. The differential of 0% is expected to persist in the near term |
| The differential in GDP growth rate between the UK and Australia | -3 | 10 | -1.80% | The Australian economy contracted slower than the UK’s |
| TOTAL SCORE | -8 |
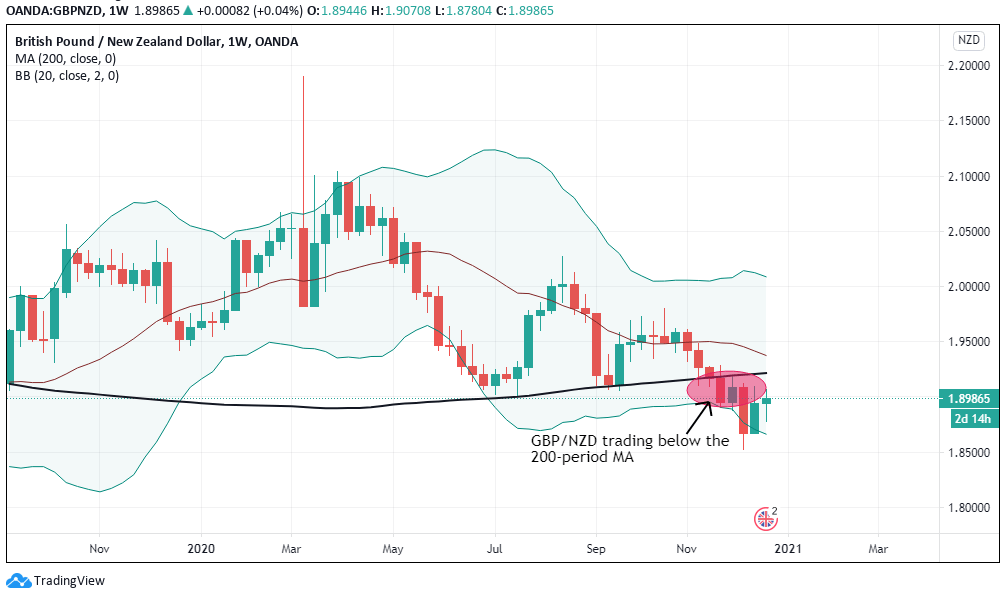
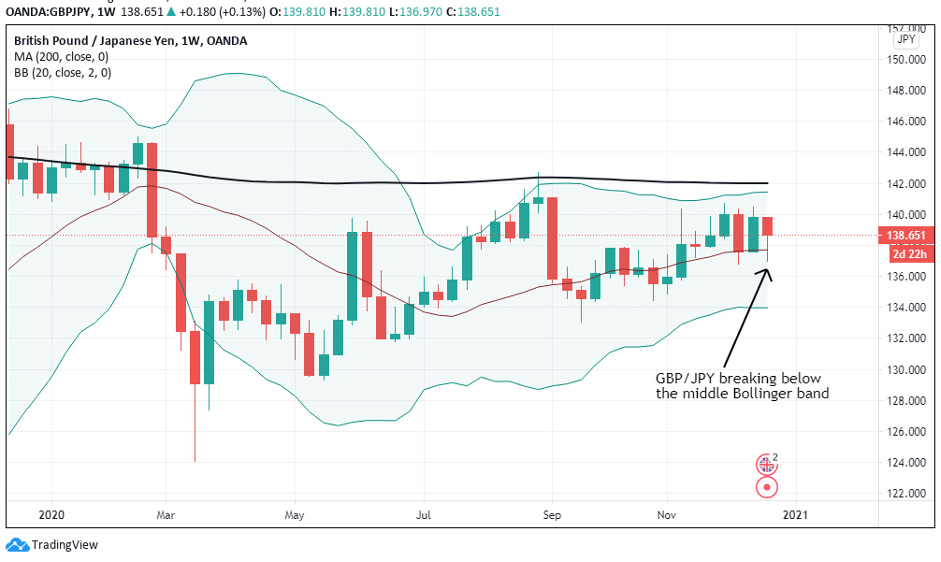
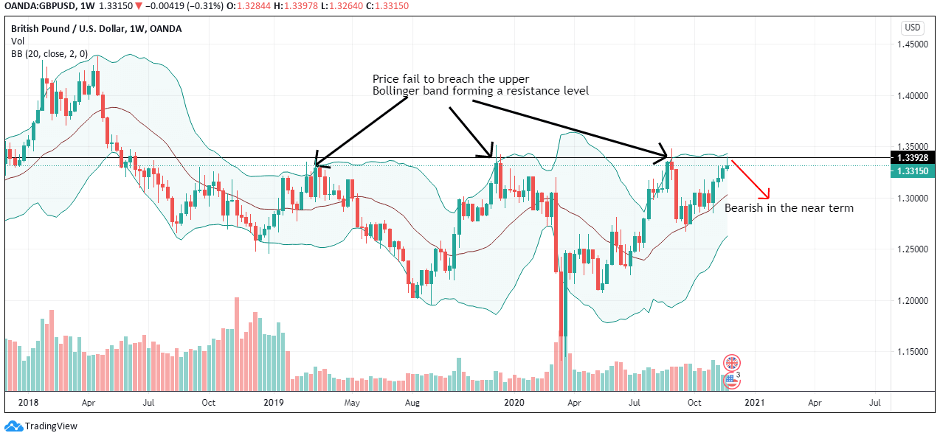
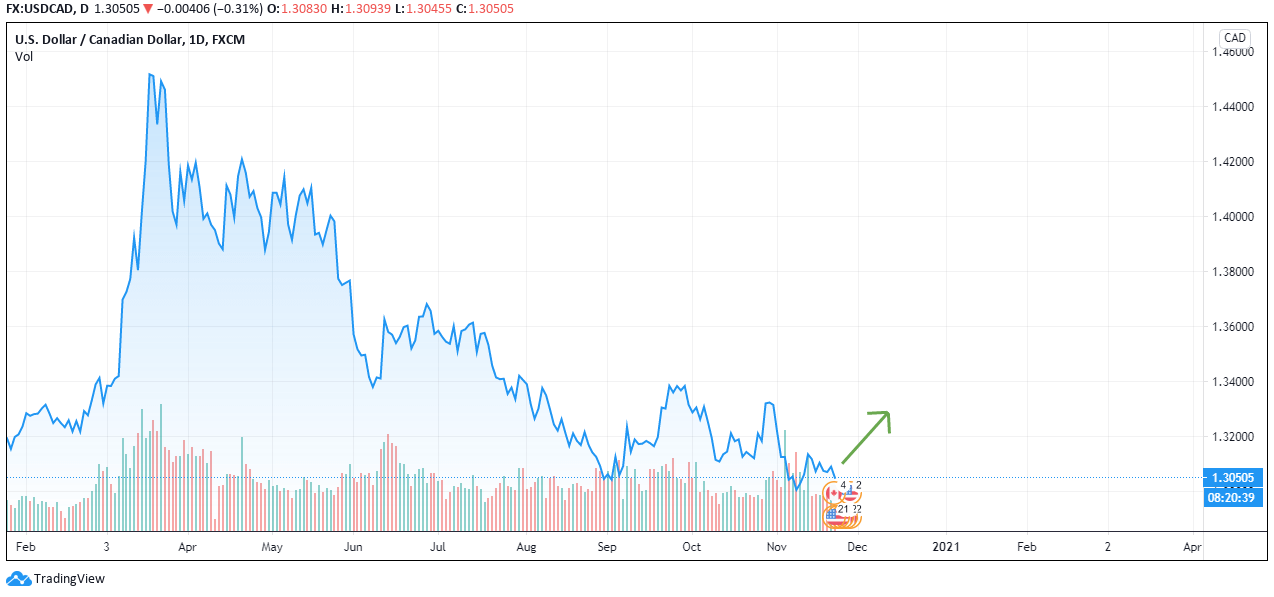
Since the cumulative exogenous score for the GBP/AUD pair is -8, we can expect the pair to continue a bearish trend.
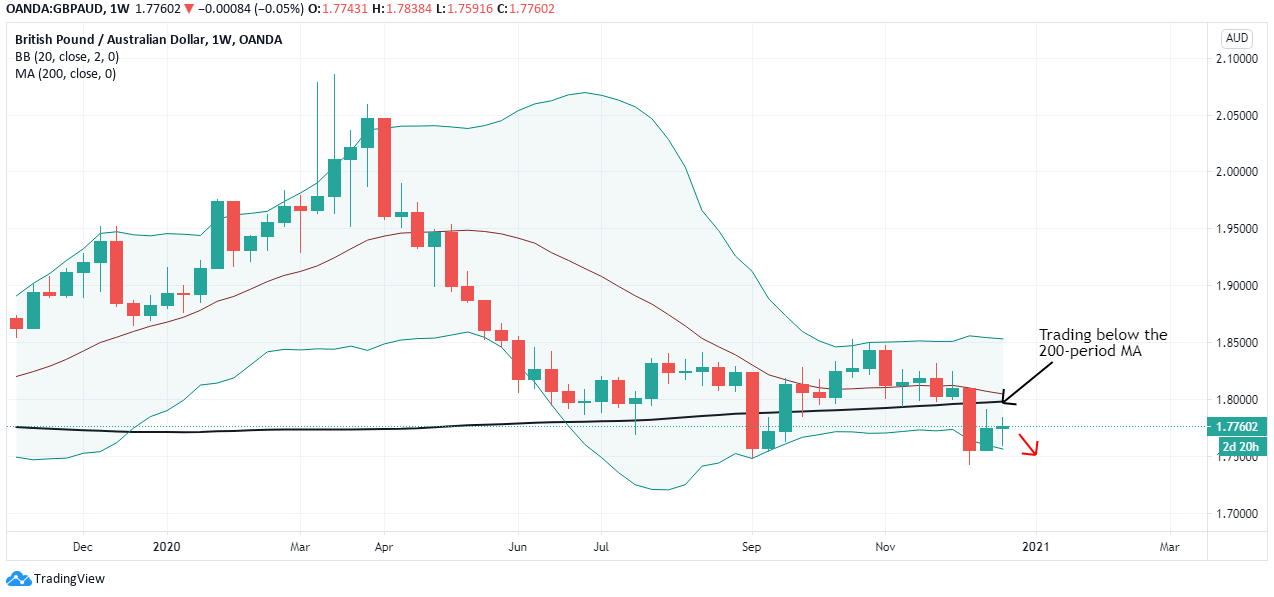
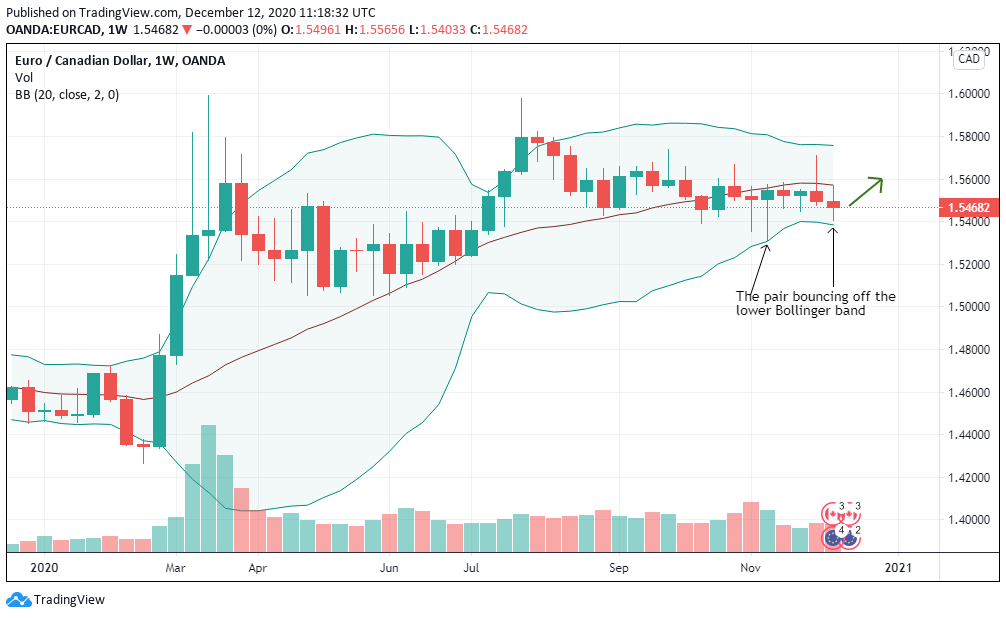
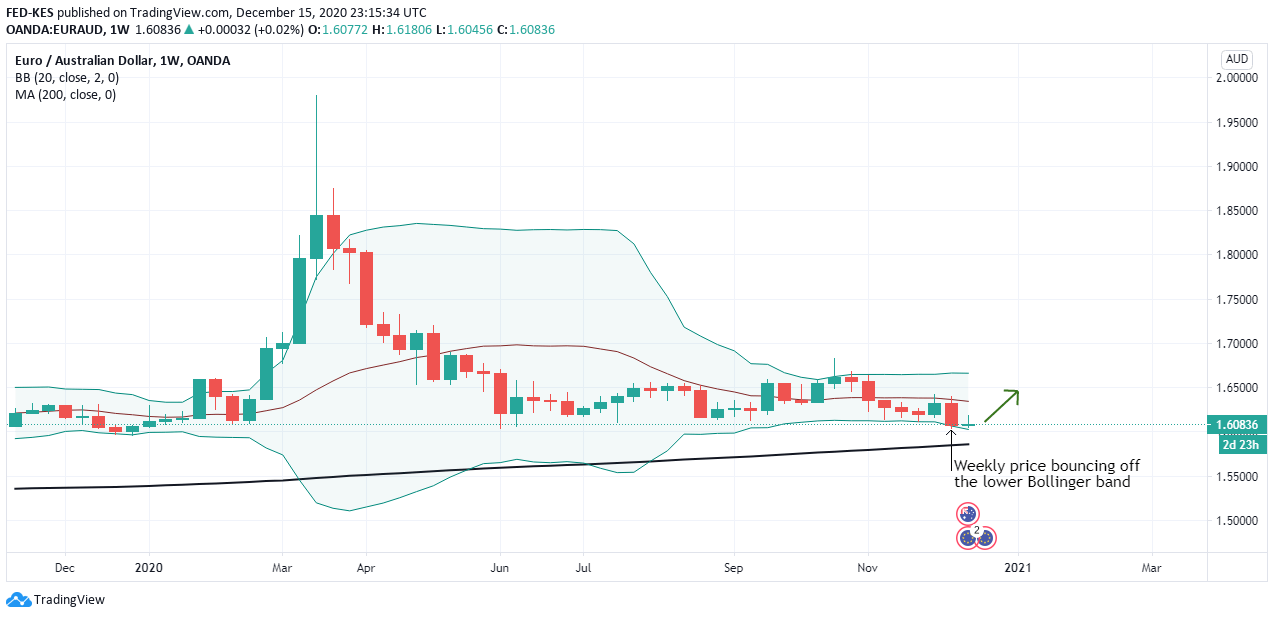
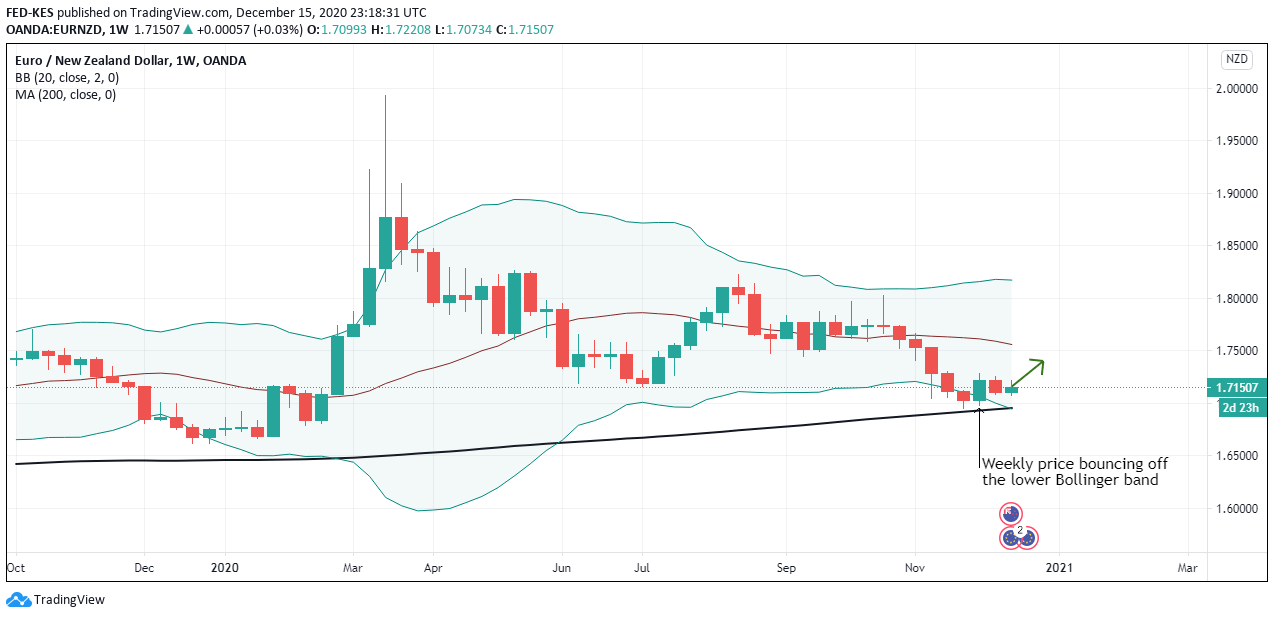
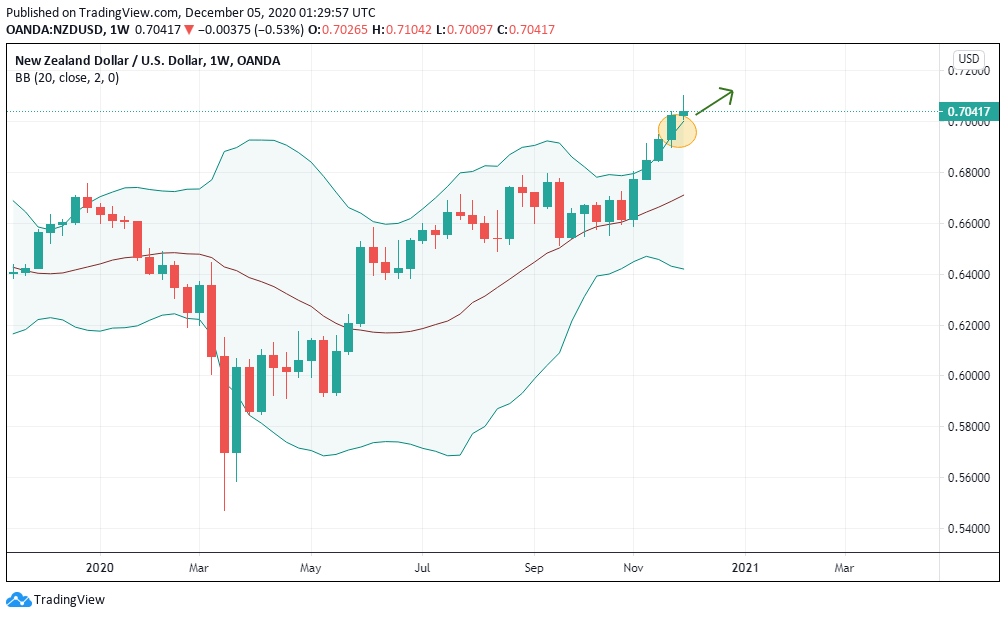
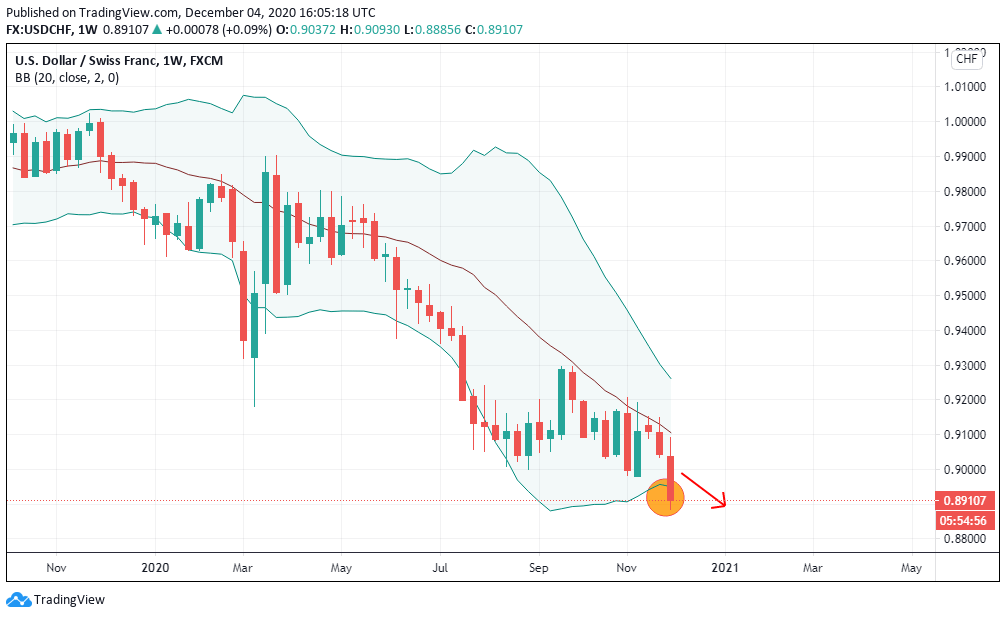
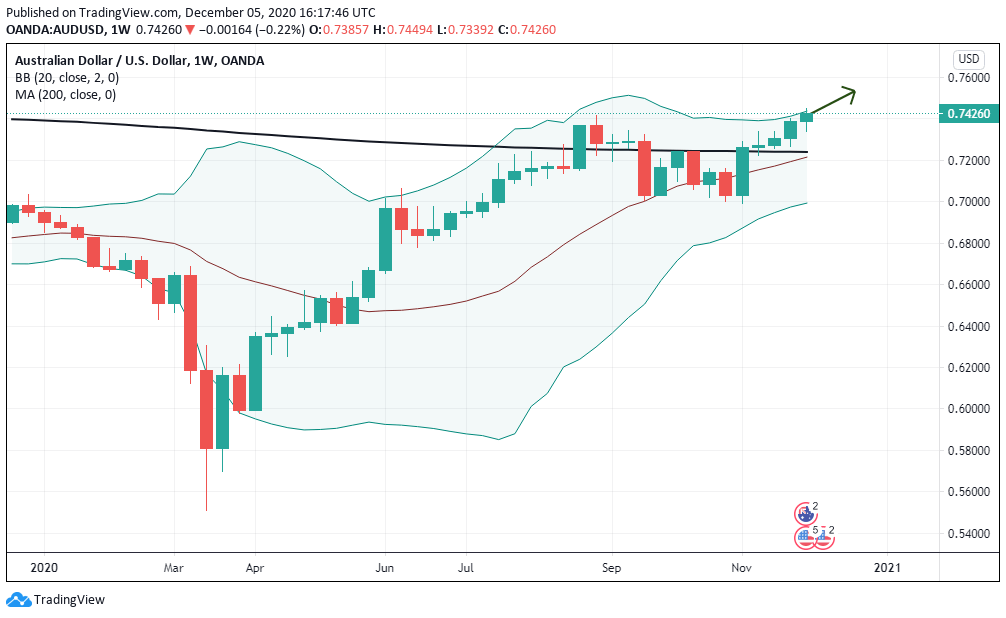
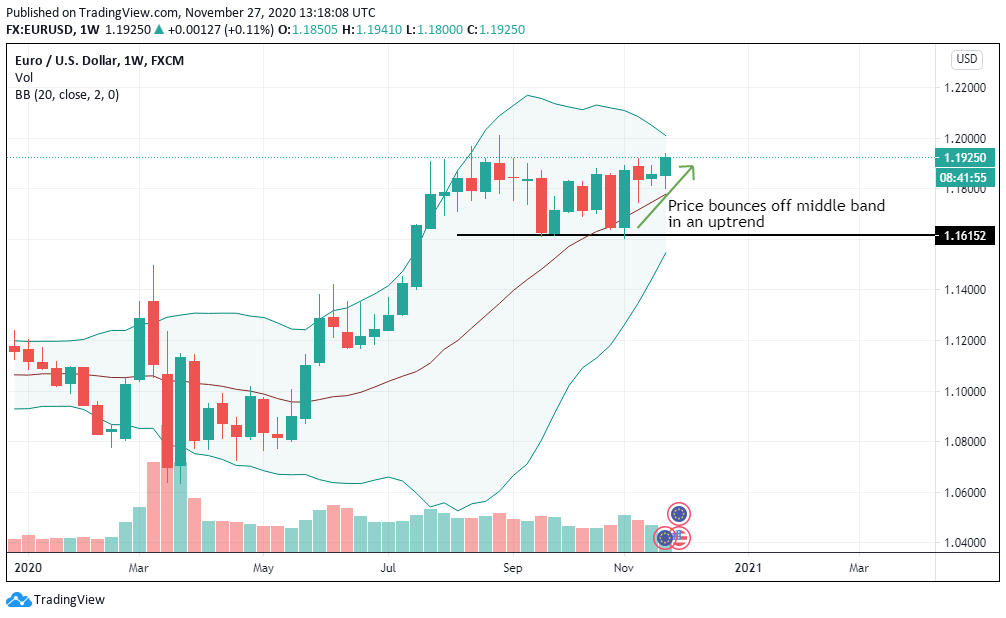
According to the above picture’s technical analysis, this pair is trading below the 200-period MA and attempting to breach the lower Bollinger band, supporting our fundamental analysis. Cheers.