Introduction
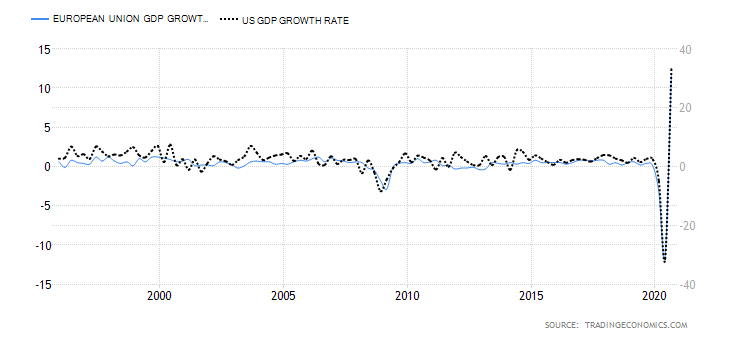
GDP Growth Rate is the most critical fundamental macroeconomic indicator for measuring economic prosperity. It is the number one macroeconomic indicator, and all other leading, coincident, and lagging indicators are all trying to predict what GDP Growth Rate would be. Our fundamental analysis revolves around predicting the growth rate before the GDP Growth Rate reveals it. It is the de facto measure of economic growth for all countries worldwide.
The importance of this economic indicator cannot be understated. GDP Growth Rate figures move the markets like no other, be it the currency or the stock markets. Hence, understanding the significance of this macroeconomic indicator is paramount for traders and investors.
What is the GDP Growth Rate?
Gross Domestic Product
It is a measure of the total economic output of a country. It is the total monetary value of all the goods and services produced within the country regardless of citizenship (resident or foreign national). The commonly used term “size of the economy” refers to this economic indicator. The US is the world’s largest economy, and it means it has the highest nominal GDP or highest economic output.
GDP Growth Rate
GDP Growth Rate is the measure of the rate of economic growth. In other words, it tells the pace at which an economy is growing. Generally, developing or emerging economies like China, India, or Japan will have a higher GDP growth rate than the mature or developed economies like the United States, United Kingdom, etc.
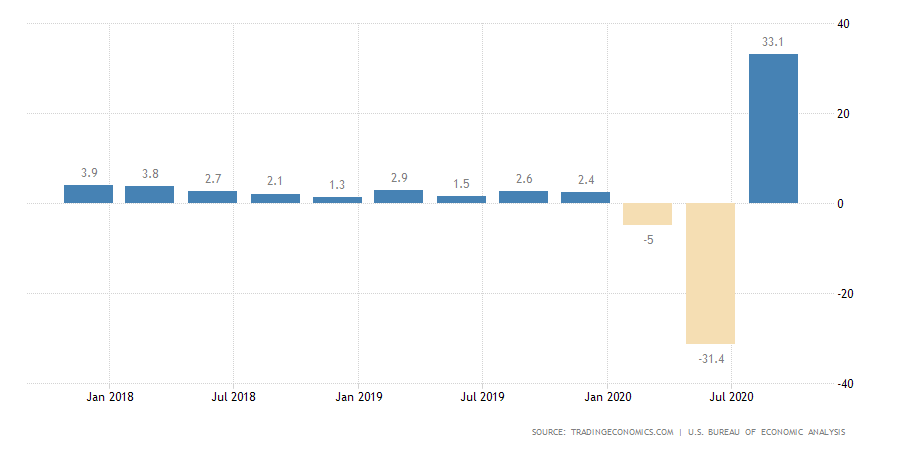
Mathematically, it is the percentage change of Gross Domestic Product with regards to the previous quarter. Although the GDP Growth Rate is reported quarterly, it is annualized for better analysis and comparison. It means that the quarterly GDP is scaled to a year to compare the Growth Rate with the previous year and understand whether the economy is growing faster or slower compared to the previous year.
The other reason is that the GDP Growth Rate changes according to the business cycle and is usually very high during the last quarter, accounting for holiday shopping from consumers driving up the GDP. Hence, annualizing with seasonal adjustment makes it more accurate for analysis. The Real GDP Growth Rate accounts for inflation and is the most-watched GDP statistic.
The GDP Growth Rate is affected by the four components of the GDP:
A | Consumer Spending: It is also called Personal Consumption. It represents spending associated with the end-consumers or the general population. The Personal Consumption Expenditure reports, Retail Sales, are all different economic indicators representing Consumer Spending. It makes up about 69% of the total GDP in the United States.
B | Business Investment: Economic Output of the Business Sector makes up 18% of the total GDP in the United States. Business Surveys like Purchasing Manager’s Index, Industrial Production, etc. help assess the Business Sector’s contribution to economic output.
C | Government Spending: It involves all the expenditures incurred by the Government to maintain and stimulate economic growth and run its operations. In the United States, significant proportions of Government Spending go to Social Security, Medicare benefits, and Defense Spending. It accounts for 17% of the total economic output for the United States.
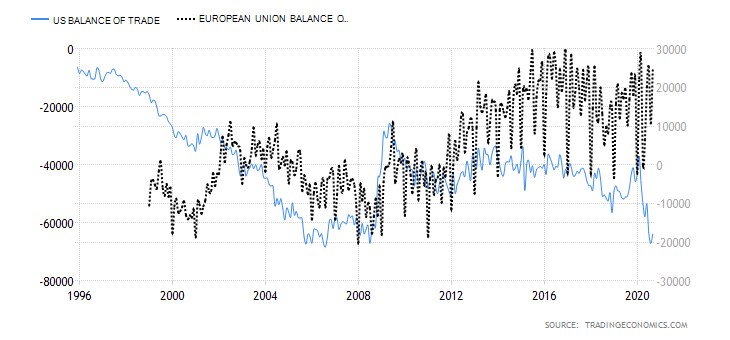
D | Net Exports: It is the difference between the total exports and imports. Revenue is generated from exports and depleted from imports. Developing economies will mostly have positive Net Exports as it is an integral part of their revenue generation. The United States has -5% Net Exports of the total GDP, meaning it is a net importer.
How can the GDP Growth Rate numbers be used for analysis?
When the economy is growing or expanding, the GDP Growth Rate is favorable. When the GDP Growth Rate is increasingly positive, businesses, jobs, and personal income all grow followingly. Developing economies grow faster than mature economies (as the developed economies are already more saturated compared to developing ones). It is generally standard for matured economies to peak out at 3-4% GDP Growth Rate and developing economies can have anywhere between 5-20%.
When the economy is slowing or contracting, businesses will halt new investments and plans to avoid deflation. New hiring is also postponed; people will save more than spend to prepare for the oncoming deflationary conditions. The economy comes to a slowdown. The Government intervenes through fiscal and monetary levers to stimulate economic growth and bring it back to normal conditions and maintain the growth rate. Overall, the GDP growth rate tells us the economy’s health.
Impact on Currency
The GDP is a lagging macroeconomic indicator that has high-impact on the market volatility. Investors’ decisions are based on the GDP growth rate. It is a proportional indicator. High GDP Growth Rates are suitable for the economy overall and vice-versa.
Though it is a lagging indicator, it has many implications for the economy. It is the most extensive measure of economic activity and the primary gauge of the economy’s health. GDP Growth Rate comparisons amongst different economies are vital for currency markets, and hence, it has a very high impact on the currency market.
Economic Reports
For the United States, the Bureau of Economic Analysis releases quarterly GDP Growth Rate figures on its official website every quarter. The release schedule is already mentioned on the website and is generally released one month after the quarter ends.
Major international organizations like the World Bank, International Monetary Fund, OECD, etc. actively maintain track of most countries on their official website:
Sources of GDP Growth Rate
For the United States, the BEA reports are available here.
The St. Louis FRED keeps track of all the GDP and its related components in one place on its official website. You can find that information in the sources mentioned below.
GDP & GNP – FRED
GDP Growth Rate – World Bank
GDP Growth Rate – IMF
Impact of the “GDP Growth Rate” news release on the Forex market
In the previous section of the article, we explained the GDP Growth Rate fundamental indicator and saw how it could be used for gauging the strength of an economy. The GDP Growth Rate indicates how quickly or slowly the economy is growing or shrinking.
It is driven by four components of GDP, the largest being personal consumption expenditures. But economists prefer using real GDP when measuring growth because it is inflation-adjusted. When the economy is improving, the GDP Growth Rate is favorable. If it is contracting, businesses hold off investing in new technologies. If GDP Growth Rate turns, then the country’s economy is in a recession.

In the following section, we will analyze India’s GDP Growth data and observe the change in volatility due to the news announcement. The below image shows the fourth quarter GDP Growth data of India, where there has been a fall in the value compared to the previous quarter. The most critical and highest contributor to the growth of the Indian economy is services. Let us find out the reaction of the market to this data.

USD/INR | Before the announcement:
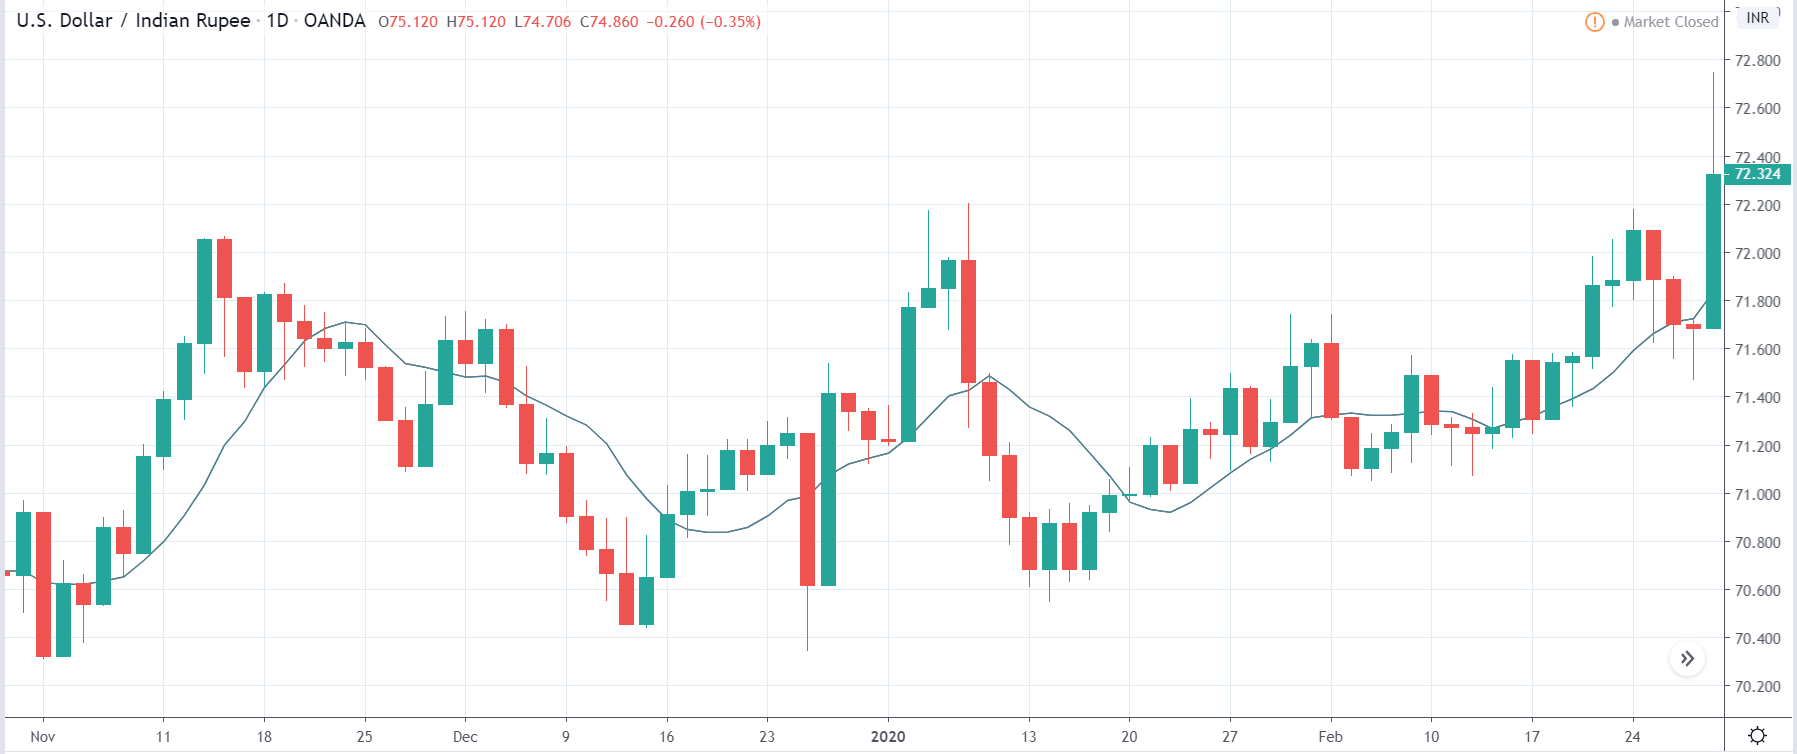
We shall start with the USD/INR currency pair to study the impact of GDP Growth Rate on the Indian Rupee. The above image shows the ‘Daily’ time-frame chart of the currency before the news announcement, where we see that the market is moving within a ‘range’ and currently the price seems to have broken out of the ‘range.’ The volatility is high on the upside, indicating that the Indian Rupee is weakening. Depending on the GDP Growth Rate data, we will take a suitable position.
USD/INR | After the announcement:
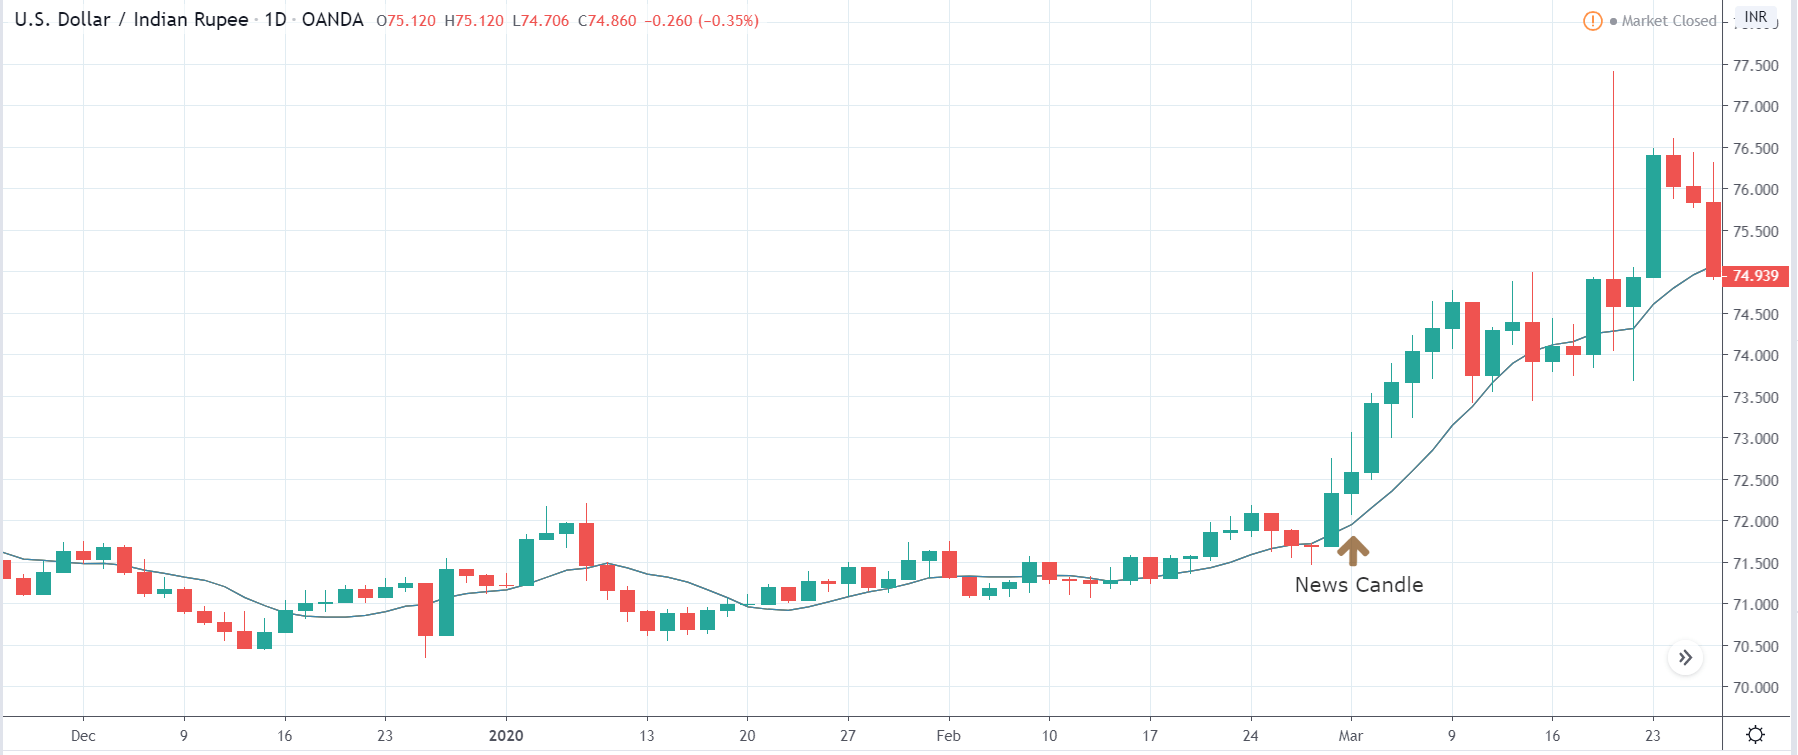
After the news announcement, we see a sudden rise in the volatility to the upside. The price moves higher initially, but selling pressure from the top makes the ‘news candle’ to close with a wick on the top. This was a result of the harmful GDP Growth data where there was a reduction in the Growth Rate from last quarter.
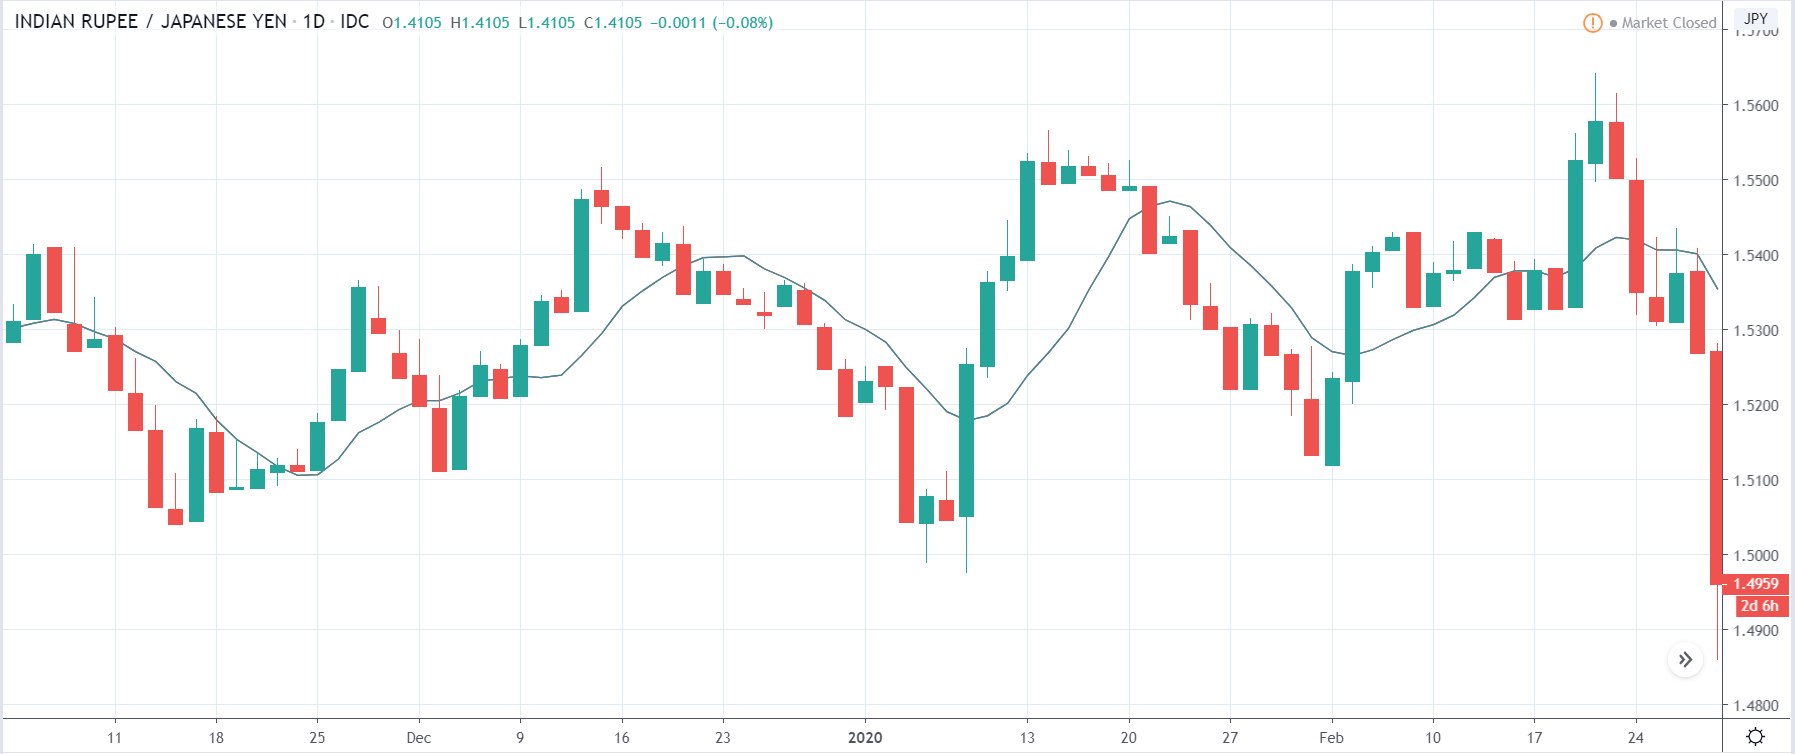
INR/JPY | Before the announcement:
INR/JPY | After the announcement:

The above images represent the INR/JPY currency pair, where it is clear from the first image that the price was moving in a ‘range’ before the announcement, and presently it has broken the ‘support’ with a lot of strength. This is the first sign of weakness in the Indian Rupee that could probably extend. If the price remains below the moving average, a ‘sell’ trade can be initiated.
After the news announcement, the price crashes lower but immediately gets reversed, and the ‘news candle’ closes with a wick on the bottom. The initial reaction was a result of the weak GDP Growth Rate, which lead to the further weakening of the currency. Volatility increased to the downside due to the news announcement, which was on expected lines.
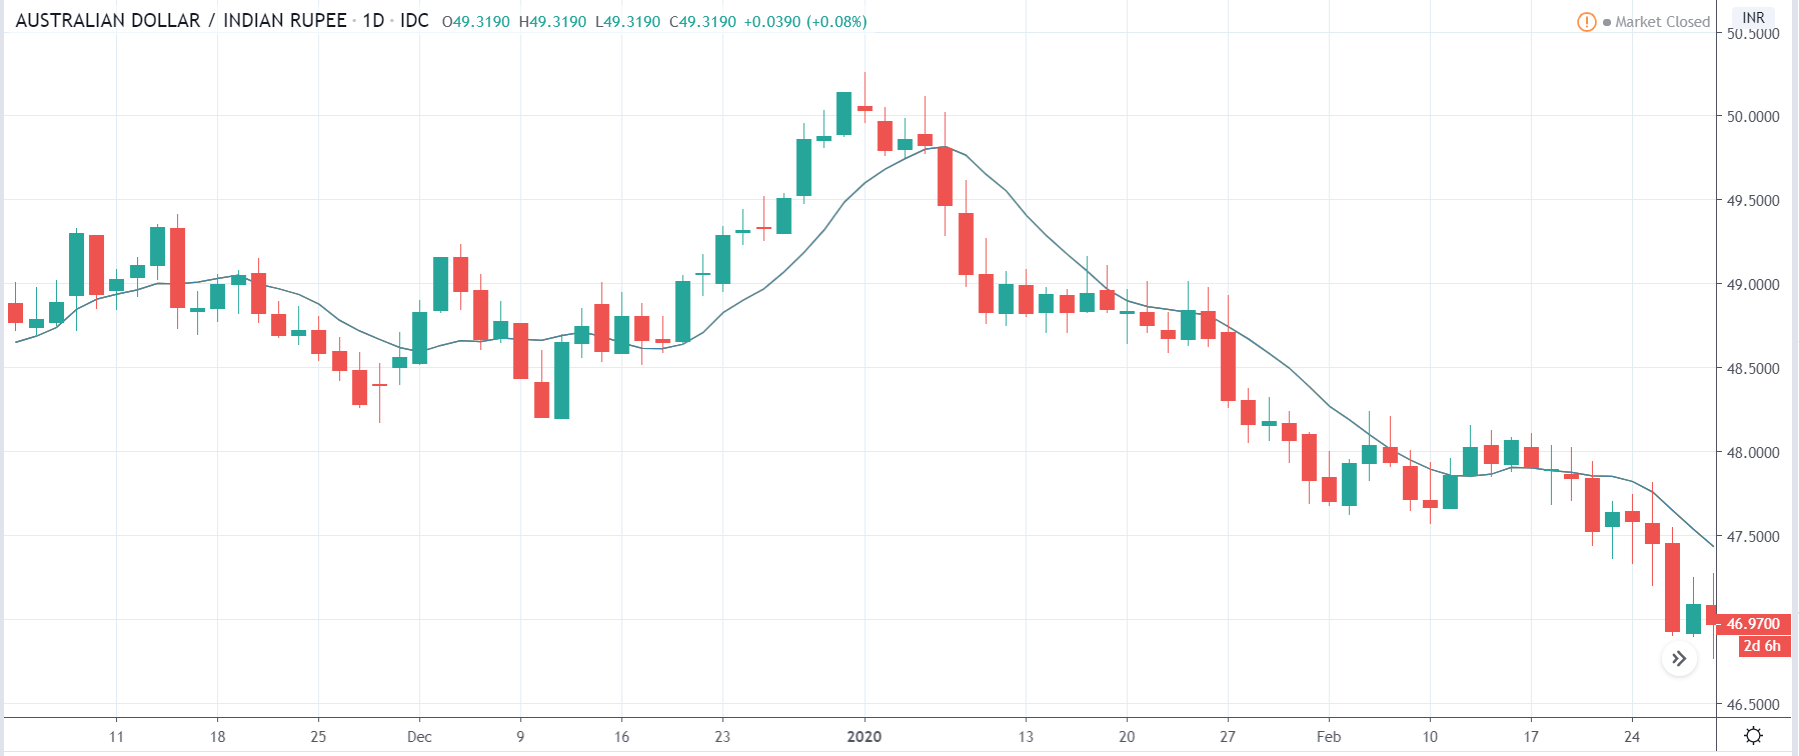
AUD/INR | Before the announcement:
AUD/INR | After the announcement:
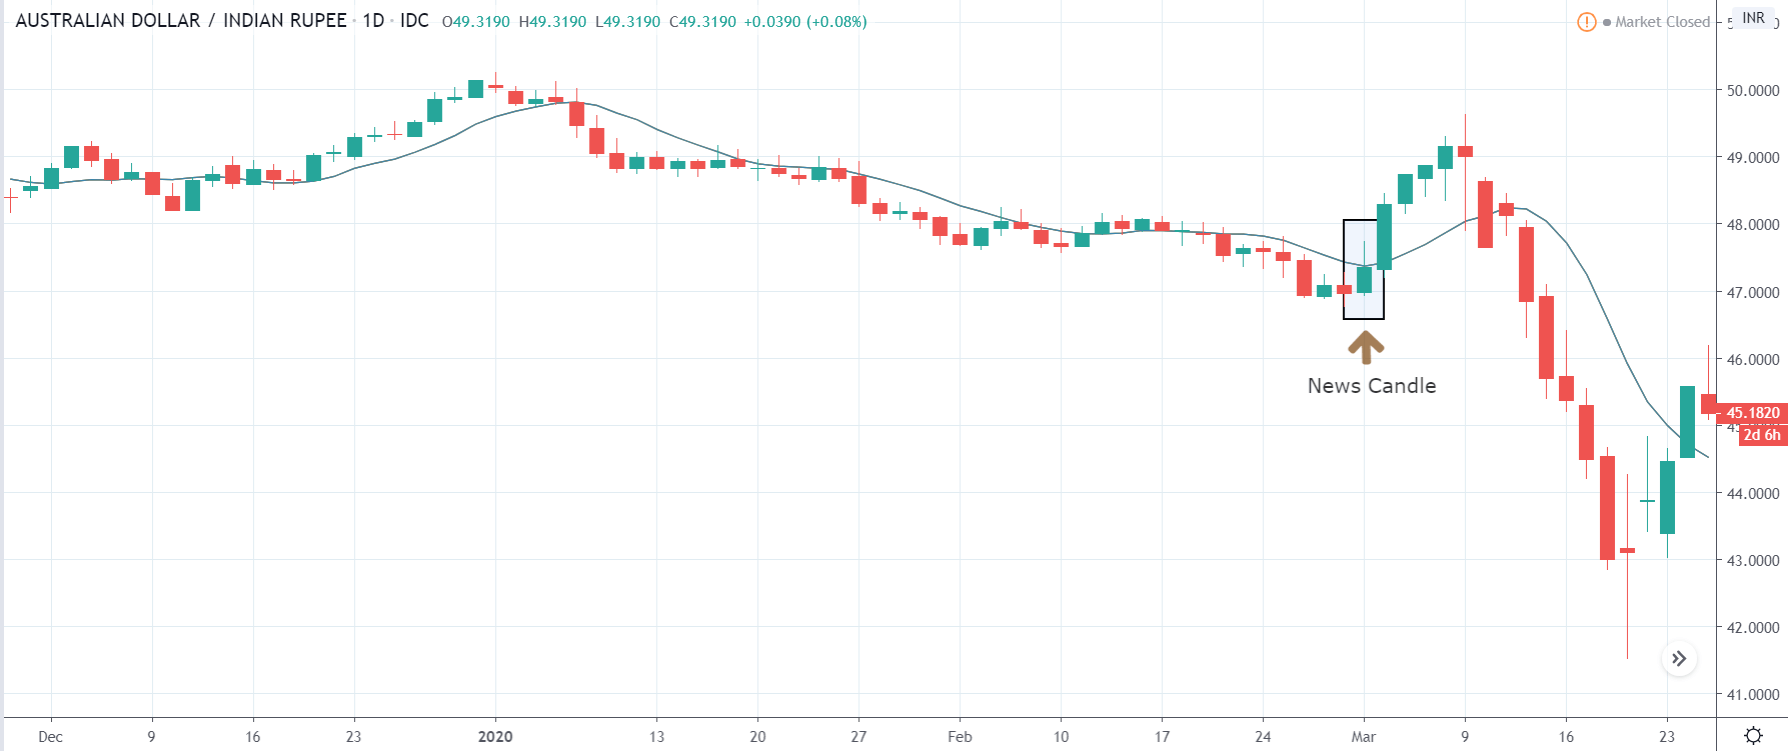
The above images are that of AUD/INR currency, where we see before the news announcement, the market is in a downtrend, and currently, the price is at its lowest point. Technically, we should be looking to sell the currency pair after a price retracement to the nearest’ resistance’ level or an appropriate Fibonacci ratio. Therefore, depending on the volatility change due to the news release, we will take a pair.
After the news announcement, the volatility emerges to the upside, and we see a sudden rise in the price that also goes above the moving average. This was a result of the weak GDP Growth Rate that made traders to ‘long’ in the currency pair by selling Indian Rupees. The news release hurts the currency where the weakness persists for a while, but later, the downtrend continues.
We hope you understood the concept of “GDP Growth Rate” and its impact on the Forex price charts after its news release. All the best. Cheers!


