EUR/NZD Exogenous Analysis
- The EU and New Zealand Current Account to GDP differential
An economy’s current account comprises the balance of trade, net transfer payments, and net factor income. In international trade, a country with a higher current account surplus experiences higher demand for its domestic currency. That means the value of its currency will be higher. Typically, a higher current account to GDP means that the country has more current account surplus.
For the EUR/NZD pair, if the differential of the current account to GDP is negative, it means that the pair’s exchange rate will fall. If it’s positive, we can expect the pair’s exchange rate to increase.
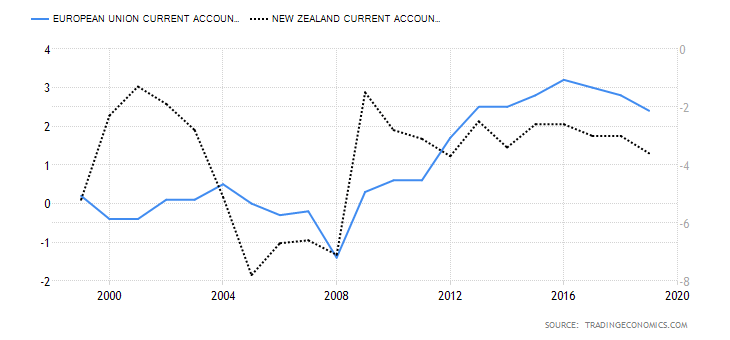
In 2020, New Zealand’s current account to GDP is forecasted to reach -0.8% while that of the EU 3.4%. Thus, the current account to GDP differential between the EU and New Zealand is 4.2%. We assign a score of 4.
- The interest rate differential between the EU and New Zealand
The prevailing interest rate in a country determines the flow of capital from foreign investors. Naturally, the country that offers a higher interest rate will attract more foreign investors who seek higher returns. Similarly, a country with lower interest rates will experience an outflow of capital by foreign investors. In the forex market, a currency pair with a positive interest rate differential tends to be bullish since traders are buying the base currency – which offers a higher interest rate and sell the quote currency – which has a lower interest rate. Conversely, a currency pair is expected to be bearish if the interest rate differential is negative since investors will sell the base currency and buy the quote currency.
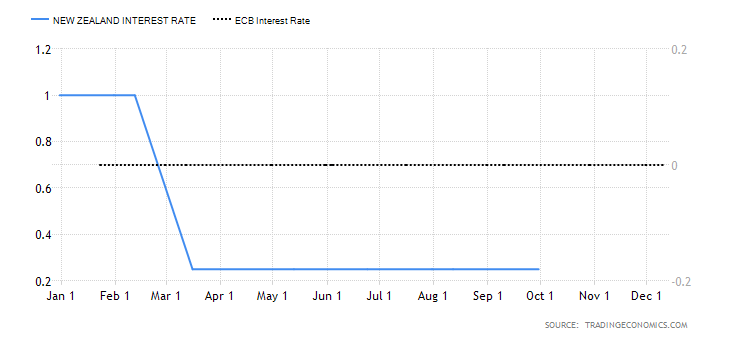
In 2020, the Reserve Bank of New Zealand cut the official cash rate to 0.25%, while the ECB maintained the interest rate at 0%. Hence, the interest rate differential for the EUR/NZD pair is -0.25%. We assign a score of -3.
- The EU and New Zealand GDP Growth Rate differential
The value of a country’s domestic currency is impacted by the growth rate of the local economy. Thus, comparing the growth rate between countries’ GDP growth rates helps determine which currency appreciated or depreciated more than the other.
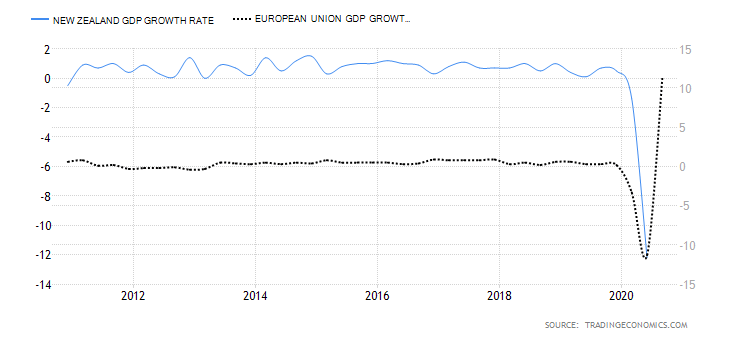
The New Zealand economy contracted by 3.2% in the first three quarters of 2020 and that of the EU by 2.9%. The GDP growth rate differential is 0.3%. We assign a score of 2.
Conclusion

The EUR/NZD exogenous analysis has a cumulative rank of 3. This means that the pair is expected to trade in a bullish trend in the short-term.
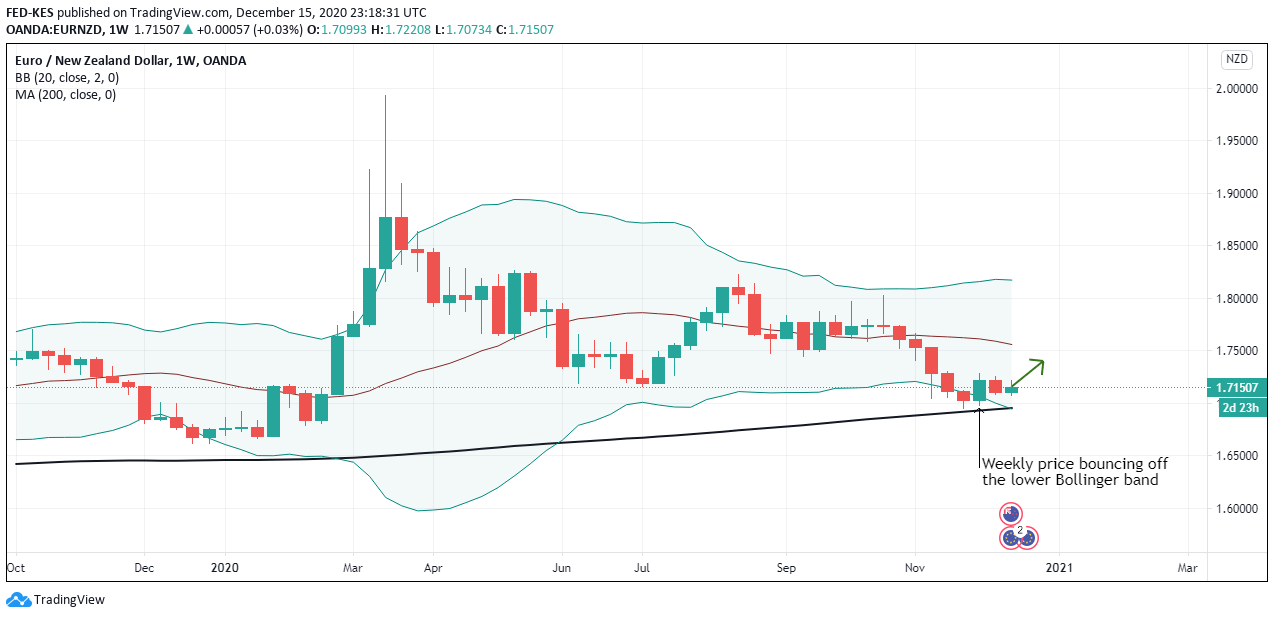
The bullish trend can also be observed from the technical analysis of the weekly price charts. The pair is trading above the 200-period MA and the weekly price rebounding from the lower Bollinger Band.
We hope you found this analysis informative. If you have any questions, please let us know in the comments below. Cheers!


