Categories
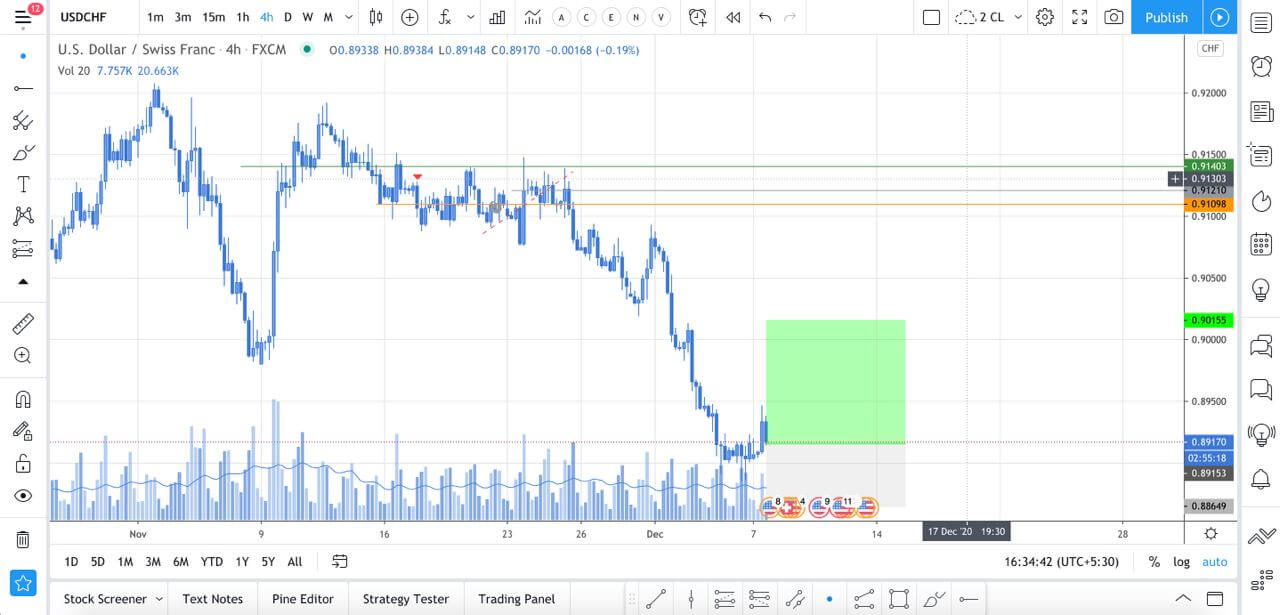
Trend Pullback In USD/CHF Pair

Pullbacks we will talk about are described as a correction candle (or bar) after a bigger, sudden price movement candle (period) on any asset chart. When you apply a technical trading system and all signals it is time to trade after a pullback, traders enter at a more favorable price. This is a great way […]
Pullbacks we will talk about are described as a correction candle (or bar) after a bigger, sudden price movement candle (period) on any asset chart. When you apply a technical trading system and all signals it is time to trade after a pullback, traders enter at a more favorable price. This is a great way […]
Pullbacks we will talk about are described as a correction candle (or bar) after a bigger, sudden price movement candle (period) on any asset chart. When you apply a technical trading system and all signals it is time to trade after a pullback, traders enter at a more favorable price. This is a great way to get more pips out of a trend although if you love this discount too much, you can easily become a discount hunter. In forex, this habit will only cut down your account. Professional traders play a very careful game with pullbacks, they are hard to gauge, and once they happen the odds are not as great as without them. The trend may not continue with the same momentum. We will address how proprietary traders manage pullbacks using their technical system and their ruleset. This example can be taken as is, although there are many ways to manage the risk of pullbacks and their psychological effect.
Discount shoppers should not apply the same principles in forex. Entering at a better price is what we should aim for, there is a time and place for this but it does not happen often in forex. If we wait for a pullback every time, the benefits of pullbacks become a losing waiting game. Our example in this article will use technical system elements explored in previous articles to pinpoint the time and place a pullback can be used for a better price entry. With a rule addition once they happen. The element in question is the Baseline and the volatility measurements. We will also address why professional prop traders avoid them in all other circumstances. Most of the time pullbacks will not be inline with the rule set and the technical system signals, but on some occasions, they will add up and in the long term will have significance to your account.
The pullback hunting concept is not easy to grasp for a beginner, especially if not yet accustomed to custom indicators, technical systems, and the base Moving Average element. In case you do not understand how to use pullbacks using our example, you can completely disregard this concept and move on with other strategies. Pullbacks setups do not happen often and they do not always end with benefits. Some traders will not enter a trade unless they get a pullback. This also means they miss out on 99% of other trends worth taking. But let’s see how a pullback is used in our trading system.
Big candles happen on any currency pairs, and we are not talking about the flash crash candles like the one after the Swissy peg removal. Big candles that are unusual can be measured as the ones that break the 1.5 ATR (14) value. These candles are caused by several phenomena in the forex. Most of them are after News events, such as Non-farm payroll, GDP, rates, elections, and so on. Also, these can happen in low liquidity periods, be it brokerage, liquidity providers, or other market drivers. Stop-loss hunting by the big banks is something that happens in between these, and are more common on popular trading currency pairs. Stop-Loss hunting is deliberate price manipulation by the big banks with huge volume to trigger visible clusters around specific price levels set by traders.
This is not a conspiracy theory but a fact we can even read about in the newspapers once the fines are announced to familiar bank names. Stop hunting is not the only manipulation but this is part of forex and it is not always a bad thing. These candles are mostly in counter-trend direction and overshoot a few before it. If these movements are not caused by news, it is mostly bank dumps or a combination of both. Trends can also move like this when there is a huge trading pressure or volume but it is not that often to see it without any catalyst before. The news and big bank manipulation moves are exaggerated, and when the price is deviating so much what usually follows is a correction or a completely new trend in opposite direction – reversal. This is a point where we can take advantage of a pullback, but using elements and rules to increase our odds.
The rules a pullback can be utilized are applied only when the price cross-closes our baseline element. This is a signal we have a good trend to enter when all other indicators agree on this. Now, we will use the ATR(14) last pip value on our target, daily chart, and see if the current candle which is about to close in a few minutes is past this ATR pip value, measured from our baseline. In MT4/5 this is quickly measured by clicking the middle mouse button or ctrl+f and dragging from the top/bottom of the candle to the baseline. The rule for pullbacks is that only trade the pullback if in the price level is back into the ATR value range from the baseline. If we do this step by step it would be like this:
This procedure may look complicated but it is easy after a few times. Some tools which can be downloaded for free from the MQL5 market can draw the ATR range channel on the chart making it easy to see if the pullback has qualified for entry, no need to measure the distance.
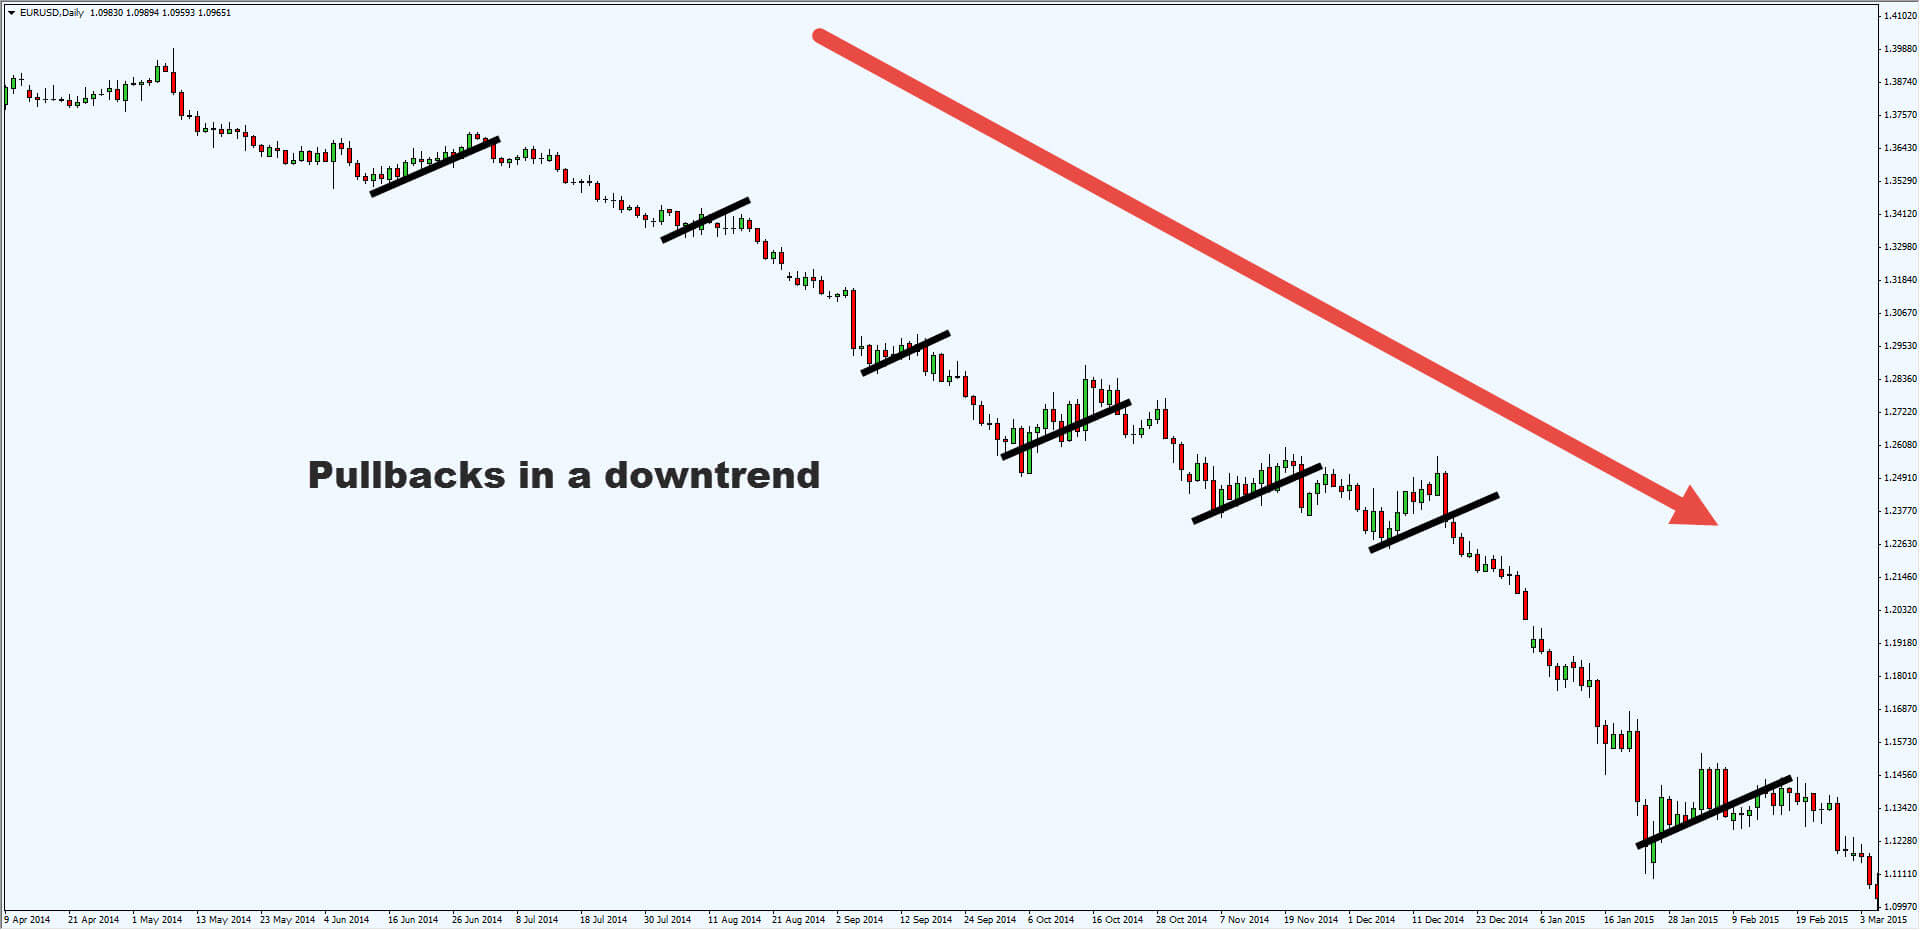
Now we will give a few pullback examples using MT4 included indicators. In the picture below we have the EURUSD pair on the daily timeframe, 20 period SMA as our baseline example, Chaikin Money Flow indicator as our trend confirmation indicator, and the ATR on the default settings (14 periods).
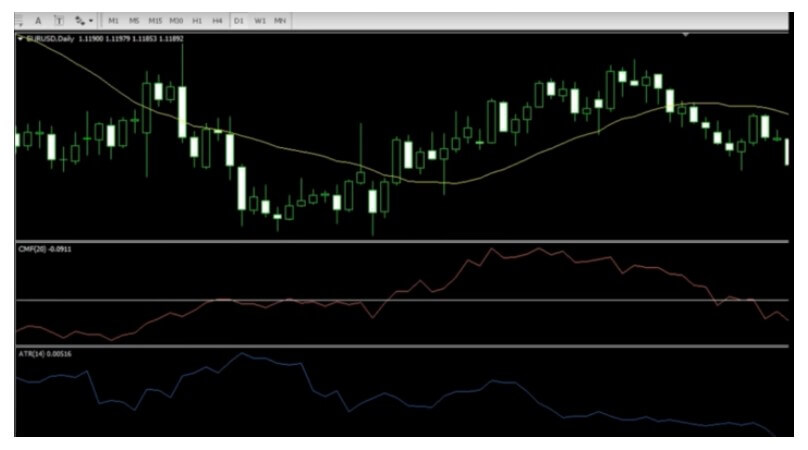
Notice the big candle in the middle of the picture that close-crossed our 20 SMA baseline colored yellow. Below, our confirmation indicator signals the long trade as it is above the horizontal zero line. The ATR below the Chaikin Money Flow gives us a value of 1005 points (100 pips) when we hover over the line (take the decimal number as a whole).
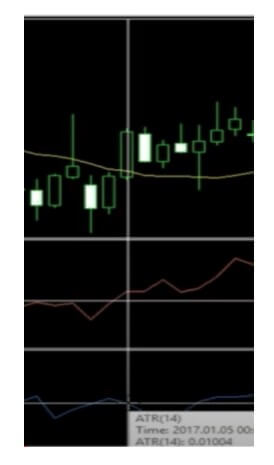
When we measure the price level distance from our baseline, we get 101 pips – bigger than our ATR value so we do not take this trade (see picture below).
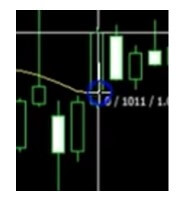
If you want to be precise, you can hove over the candle and the baseline to see the values and calculate the pip distance, although when you trade real time this precision is not important unless it is hard to tell. The next candle pulled back. Our confirmation indicator is still signaling the long trade, the closing price level is now inside the ATR range from the baseline – 33 pips.
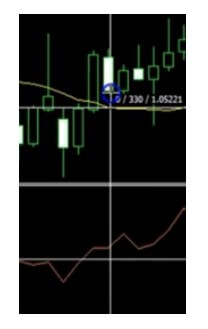
So now we are entering this trade at a discount, 68 pips better price entry does matter plus we have a better risk as our Take Profit point is lower. Pullback situations like this are not common, but you should be ready once they do. Remember that the one candle rule is applied here. If the next candle is not in the ATR-Baseline zone you do not take that trade. We do not count later candles and qualify them as pullbacks, only the first after a big candle. Interestingly, this one candle rule is applied to some lagging indicators to give them a chance to catch up with the rest of the system, however, this is just one example of a trading system used by a prop trader. The picture below shows price action we do not qualify as a pullback, the second candle after the exaggerated one is not a correction while the third is not accountable.
On some occasions, your confirmation indicators may be lagging so you do not catch a baseline crossing candle or the one after. If this happens and the price is already past the ATR range from the baseline, you pass on that trade. There is no waiting for any kind of a pullback. The baseline element cannot play its role if you take trades too far from it. The baseline is there to show the “balance” point to which the price comes back to after deviations. Entering a trade in the middle of the deviation decreases the odds it will continue to move away. The baseline element is also a protective function from losses. Of course, you can try other ATR settings or levels for this rule if it proves to be more effective in the testing.
The ATR range rule is applied to normal trading signals too in our system example. Any deviation which is too far away once the baseline is crossed does not qualify for an entry. There is one exception though – when you encounter continuation trades. More on these situations is presented in another article.
Pullbacks can work well, so well it can make you skip the rules you have set. The hype of success can lead you to seek pullbacks wherever you can, adjusting the system to only catch them as much as it can. This change will lead you into a losing spiral not only to your account but to your morale too. It is easy to get into the pullback hype and much harder to get out of it. There are no indicators that predict pullbacks and even less the ones that predict trends after it. You may rely on your hunches whenever you see a big candle, and this is a dangerous practice for your account. When your ATR is just one pip lower to qualify a pullback, there is no tolerance, you pass on that trade.
The rule discipline will get you out of the losing trades and, more importantly, you will not wait for pullbacks and miss out on winner trends just because the price kept going. These winners are what make a difference to your account after everything, missing them out is not an option. The choice between five 300 pip winners per year and one 350 pip winner with a pullback entry is very easy to make, but the hype of getting a discount cloud our judgment. Discount shopper patience does not apply to forex when it comes to pullbacks. Waiting for a high-percentage trade is not similar. Here, you are missing out on a signal from your system and your rulebook just because you want a better price to enter after a pullback. Do not mix this with high-percentage trading which is actually what you should do all the time.
As you may have noticed, this example is based on measurements, indicators, and strict rules in conjunction with them. It is a technical system that may not be an appropriate way of trading for everyone. Some traders trade without any indicators, or as they might describe – secondary technical indicators. The primary indicator for them is Price Action. What they see on the chart is the base for their decision making. Identifying pullbacks is not exact practice, they might wait for a pullback every time with pending orders or wait for a Price Action pattern to unfold before making an entry. However, these skills are unique to them and cannot be replicated in any technical system. On the other side, by having something you can measure, you have an easy-going decision-making system ready for anyone who can just follow their signals to be successful.