Introduction
The GBP/JPY pair’s global macro analysis interrogates the endogenous factors that drive the GDP growth in the UK and Japan. The analysis will also cover exogenous factors that affect the exchange rate between the GBP and the JPY.
Ranking Scale
The analysis will use a sliding scale from -10 to +10 to rank the endogenous and exogenous factors’ impact. Endogenous factors impact the value of the domestic currency. Thus, when it is negative, it means that the domestic currency has depreciated. When positive, it means that the domestic currency has increased in value during the period under review. The ranking of the endogenous factors is based on correlation analysis with the domestic GDP.
On the other hand, a positive ranking for the exogenous factors means that the GBP/JPY pair’s price will increase. Conversely, when negative, it means that the price of the pair will drop. This ranking is derived from correlation analysis between the exogenous factors and the GBP/JPY exchange rate fluctuation.
GBP Endogenous Analysis – Summary
A score of -15 implies that GBP has depreciated since the beginning of this year.
| Indicator | Score | Total | State | Comment |
| UK Employment Rate | -5 | 10 | 75.2% in September 2020 | Dropped by 1.4% from January to September. The labor market has shed around 551,000 jobs |
| UK Core Consumer Prices | 2 | 10 | 109.82 points in November 2020 | The UK core consumer prices have increased by 1.82 points since January. Shows that the demand in the domestic economy has not been depressed |
| UK Factory Orders | 3 | 10 | Was -25 in November | The CBI trends orders are improving. The -25 recorded in November was the highest since February |
| UK Business Confidence | -2 | 10 | Neutral in Q4 of 2020 | UK businesses are still pessimistic about the future operating environment. |
| UK Consumer Spending | -5 | 10 | Was £304.5 billion in Q3 2020 | Q3 household expenditure shows domestic demand is recovering from the lows of Q2. Consumer spending is still below the pre-pandemic Q1 levels |
| UK Construction Output | -2 | 10 | YoY drop of 7.5% in October 2020 | The construction output is improving, which implies that the UK economy is steadily recovering from the economic disruptions of the pandemic |
| UK Government Budget Value | -6 | 10 | UK public sector net borrowing deficit was £22.3 billion | The growing budget deficit is a result of increased government expenditure in the wake of COVID-19 pandemic. Also worsened by reduced revenues due to business disruption |
| TOTAL SCORE | -15 |
- United Kingdom Employment Rate
The employment rate shows the percentage of the UK labor market that is actively and gainfully employed. It is a comprehensive representation of the growth in the labor market. Note that the changes in the employment rate measure the changes in the economic activities of a country.
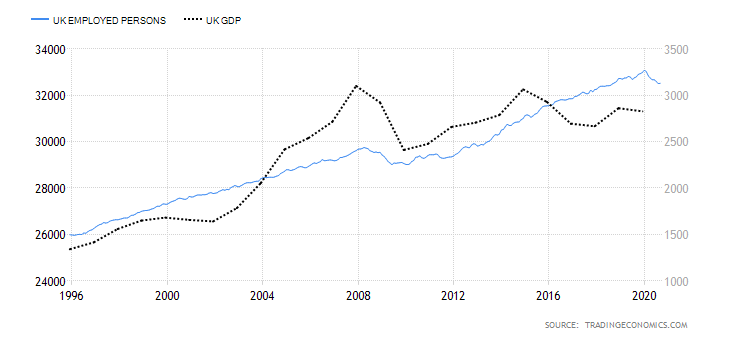
In September 2020, the UK employment rate dropped to 75.2% from 75.3% in August. From January to September 2020, the employment rate has dropped by 1.4%, equivalent to about 551,000 job loss. The UK employment rate scores -5.
- United Kingdom Core Consumer Prices
This index measures the change in the rate of inflation in the UK by tracking price changes of specific consumer products. The index calculation excludes items whose prices tend to be highly volatile, such as fuel and energy.

In November 2020, the core consumer prices in the UK dropped to 109.82 from 109.9 in October. The index has increased by 1.82 points since January. The UK core consumer prices score 2.
- United Kingdom Factory Orders
In the UK, the CBI Industrial Trends Orders tracks orders from about 500 companies in 38 sectors of the manufacturing industry. The survey’s components include domestic goods orders, exports, inventory, output prices, and expectations of future investments and output levels. The surveyed manufacturers respond whether the current conditions are normal, above, or below normal. This is used as a leading indicator of industrial production.
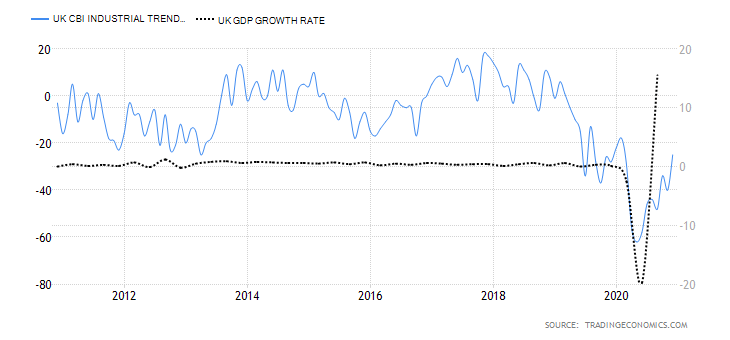
In December 2020, the UK CBI trends orders were -25, 15 points up from -40 in November. This is the highest level since February 2020 but still lower than -18 in January. We assign a score of 3.
- United Kingdom Business Confidence
This index gauges the optimism of businesses operating in the UK. A survey is conducted on 400 small, medium, and large companies to determine their optimism. The survey covers exports, output levels and prices, capacity, order books, inventory, competitiveness in the domestic market, innovation, and training. The business sentiment is then ranked from -100 to +100, with 0 showing neutrality.
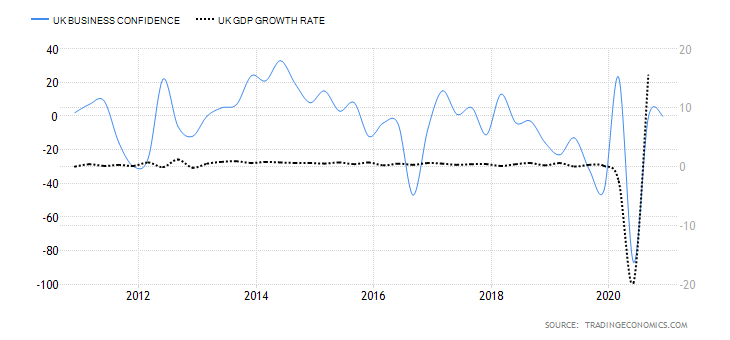
In the fourth quarter of 2020, the UK business confidence was neutral at 0, a slight change from -1 in Q3. It is, however, still below the 23 recorded in Q1. We assign a score of -2.
- United Kingdom Consumer Spending
Expenditure by households contributes to a significant proportion of the domestic GDP. In the UK, this index tracks quarterly changes in the amount of money spent by households and Non-profit institutions serving households (NPISH). Note that when the economy is performing well, consumer spending is high. Conversely, a poorly performing economy corresponds to low consumer spending.
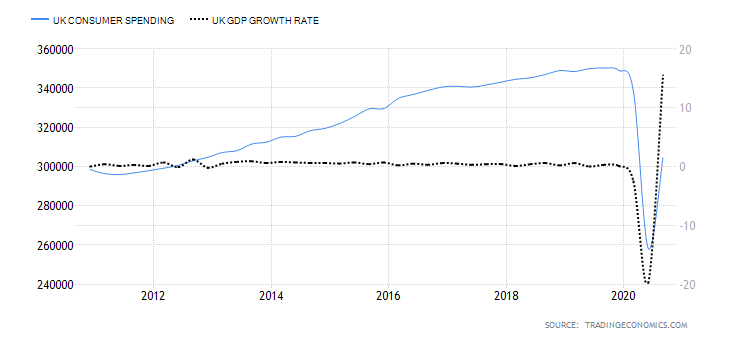
In Q3 2020, consumer spending in the UK rose to £304.5 billion from £258.3 billion in Q2. However, the Q3 expenditure is still lower than Q1. The UK consumer spending scores -5.
- United Kingdom Construction Output
This economic indicator tracks the yearly change in the value of work done in the construction sector. The amount of money charged by construction companies in the UK is based on a sample of 8000 companies that employ over 100 employees. Note that in the UK, the construction sector contributes about 6.4% of the GDP.
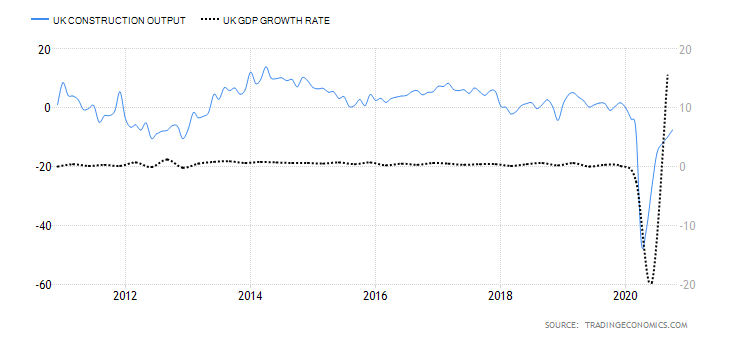
In October 2020, the UK’s YoY construction output dropped by 7.5%, up for the 10% drop recorded in September. This marks the smallest decrease in the UK’s construction output since the pre-pandemic period. We assign a score of -2.
- United Kingdom Government Budget Value
This indicator tracks the changes between the government’s revenues and expenditure. When the revenue exceeds the expenditure, it is a surplus and indicates that the economy is expanding. When the deficit is increasing, it means that the government is spending much more than it receives. This poses a threat of overburdening the economy with future debt repayment obligations.
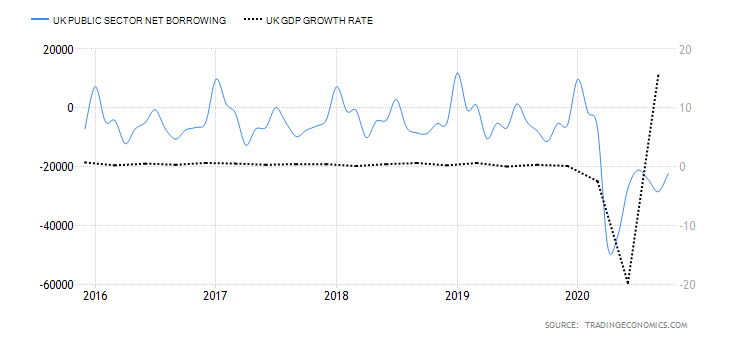
In October 2020, the UK public sector net borrowing deficit was £22.3 billion. This is an improvement from the deficit of £28.6 billion in September. In January 2020, the UK had a surplus of £9.6 billion. Thus, we assign a score of -6.
In the next article, we have discussed the endogenous analysis of JPY currency to see how it has performed in the year’s due course. Make sure to check that out. Cheers.