Categories
Crypto Market Analysis

FUN/BTC – buy a valid breakout

FunFair (FUN)

Market Cap: $270.95M

Circulating Supply 4.86B FUN

Max Supply 0 FUN

Volume (24h) $43.88M


The crypto pair increased significantly today and has jumped above a crucial dynamic resistance. It remains to see what will happen because the price failed to stay above this obstacle. You should stay away, for now, to see if this will be a valid breakout.

We may have a great buying opportunity if the FUN/BTC will make a valid breakout above the near term dynamic resistance.

FUN/BTC chart

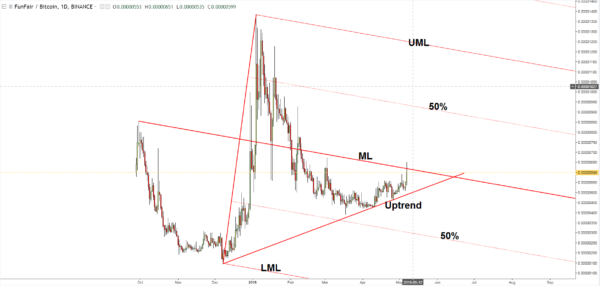
The FUN/BTC has finally managed to make a breakout above the median line (ML) of the major descending pitchfork, but it remains to see if this will be a valid one. Price has tested and retested the uptrend line and now is fighting hard to close and stabilize in the buyer’s territory.

A valid breakout above the median line (ML) will bring us a great buying opportunity with a Stop Loss below the uptrend line.

You should know that a failure to make a valid breakout will signal an overbought and exhaustion in the short term. This situation will send the rate towards the downside 50% Fibonacci line very quickly. The perspective will remain bullish as long as the rate stays above the uptrend line.

Conclusion

You can go long on this crypto pair after a valid breakout and after a minor increase. The Stop Loss should be placed below the uptrend line, while the first upside target will be at the upside 50% Fibonacci. The major upside target will be at the upper median line (UML) of the descending Pitchfork.

©Forex.Academy

Categories
Crypto Market Analysis

Ardor – Has The Rebound Completed?

Ardor (ARDR)

Market Cap. $430.46M

Circulating Supply: 999M ARDR

Max Supply: 999M ARDR

Volume (24h) $5.40M


The ARDR/USD dropped today and could invalidate a further increase. It remains to be seen what will really happen in the upcoming days because the perspective is still bullish in the short term as long as the rate is trading above some very important support levels.

We may have a great buying opportunity if the rate will decrease a little to retest the near-term support levels.

Ardor ARDR/USD chart

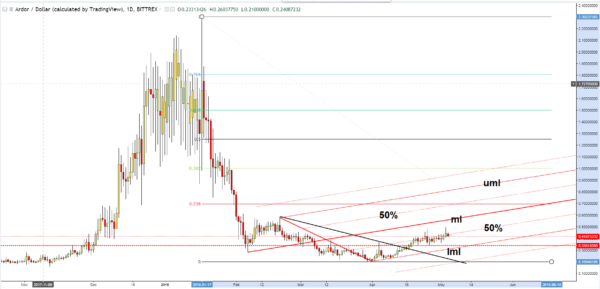
You can see on the Daily chart that the rate has made another false breakout above the 50% Fibonacci line (ascending dotted line) of the ascending pitchfork signalling that we may have a minor drop. It could come back down to test and retest the lower median line (lml) and the 0.33818380 static support.

We could take a long position from the mentioned levels if the rate stays above them after a retest. However, we could also buy this crypto after a valid breakout above the 50% Fibonacci line. A valid breakout will signal a potential increase above the median line (ml).

The perspective remains bullish as long as the rate stays above the 0.3381 level and the lower median line.

Personally, I was expecting to see an important upside movement after the retest of the lower median line (lml) of the ascending Pitchfork, but the 50% Fibonacci line represents a very strong dynamic resistance.

Conclusion

You can buy the ARDR/USD from above the 50% Fibonacci line after a valid breakout or after a retest of the lower median line (lml) of the ascending pitchfork. We have an important upside target at the 23.6% retracement level and higher at the upper median line (uml).

©Forex.Academy


Categories
Crypto Market Analysis

Could AION shine again?

AION (AION)

Market Cap. $540.93M

Circulating Supply: 133.07M AION

Max Supply: 0 AION

Volume (24h) $13.15M


AION/USD rose and seems determined to climb much higher in the short term after the last minor drop. The failure to retest its dynamic support (resistance has turned into support) it has shown that the bulls are strong in the short term.

However, we still need a confirmation that the rate could increase significantly in the upcoming period. Price is ready to escape from an extended sideways movement so a valid breakout will confirm a further increase.

AION/USD

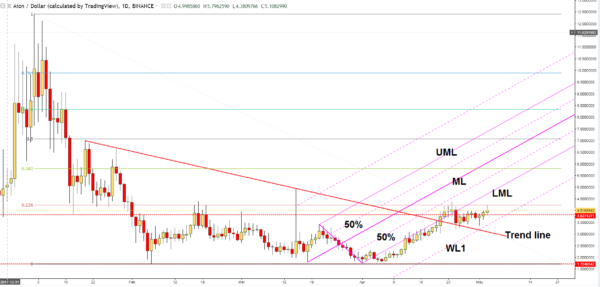
The AION/USD has finally managed to breakout above the downtrend line. It has come back to test and retest the broken dynamic resistance and now is struggling to climb towards fresh new highs. It seems like we have a valid breakout and the rate should make new highs soon.

AION/USD has jumped above the 3.8274271 static resistance, but we need a valid breakout to be sure that the rate will climb much higher in the upcoming period.

You can see that we had a false breakout above the 3.8274 level and above the 23.6% retracement level on April 24, that’s why the breakout needs confirmation. The failure to approach and test the first warning line (WL1) of the ascending pitchfork has signalled another bullish momentum.

The rate will become strongly bullish only after a valid breakout above the lower median line (LML) of the ascending pitchfork.

Conclusion

You can go long on this crypto if the rate will close above the 23.6% retracement level and you could place your Stop Loss somewhere below the 3.3446578 former low. A breakdown below the WL1 could invalidate a potential upside movement. We have an important upside target at the 38.2% retracement level and higher at the median line (ML).

©Forex.Academy

Categories
Crypto Market Analysis

NEO/ETH Long After The Breakout

NEO (NEO)

Market Cap. $5.22B

Circulating Supply: 65M NEO

Max Supply 100M NEO

Volume (24h) $205.42M

NEO/USD = $80.114

The NEO/ETH is trading at 0.12324 level after the impressive drop. Price increased as much as 0.13649 in the yesterday’s trading session, but failed to stay there and now seems very heavy. The rate is trading in the red after the second false breakout above a very strong dynamic resistance.

Price moves in range in the short term, so we’ll have a clear direction only after a valid breakout from this chart pattern.

NEO Technical Analysis:

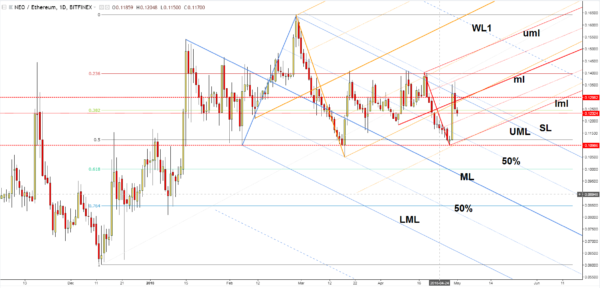
NEO/ETH increased aggressively on Sunday after the false breakdown below the 50% Fibonacci retracement level. Price has found strong resistance at the upper median line (UML) of the descending pitchfork. It has made a false breakout above the outside sliding line (SL) of the descending pitchfork and now could come towards the former low (0.10991).

Personally, I believe that we may have a larger increase only after a valid breakout above the sliding line (SL). You could buy this crypto pair after the rate will close above the SL and after a retest. You can see that I’ve drawn an ascending pitchfork to catch a potential upside movement.

Price has made a false breakout above the median line (ml) of the minor ascending pitchfork, and now it could come back down towards the lower median line (lml). NEO/ETH is somehow expected to increase after the failure to approach and retest the median line (ML) of the descending pitchfork.

You should know that only a valid breakdown from the minor ascending pitchfork’s body and below the 0.10986 will invalidate a potential broader increase.

Conclusion

You could buy it after a valid breakout above the SL, and you could place a  first take profit at the first warning line (WL1) of the descending pitchfork. The second take profit could be placed at 0.16409 swing high.

©Forex.Academy

Categories
Crypto Market Analysis

Litcoin Further Increase Still Possible

Litcoin (LTC)

Market Cap. $8.53B

Circulating Supply: 56.22M LTC

Max Supply: 84M LTC

Volume (24H) $390.80M


Will Litecoin Recover April 2018

The Litcoin increased more than 19% in the last 7-day and is fighting hard to stay above some very important broken resistance levels. It is trading above the 150.000 psychological level, but unfortunately, it has shown a minor exhaustion in this weekend.

litecoin price analysis

Price has found temporary resistance right above the second warning line (wl2) of the former ascending pitchfork. Litcoin is almost to reach this line again after the retest of the 50% Fibonacci line of the descending pitchfork. Actually, the rate has made a false breakout above the warning line (wl2), so a retest will send the price down a little.

Maybe we’ll have a minor consolidation before the rate tries to break out from the descending pitchfork’s body. An accumulation above the 136.61 level could give us a great chance to go long on this major crypto again.

Personally, I believe that only a drop below the third warning line (wl3) and below the 50% Fibonacci line will invalidate a further increase in the upcoming period.

We’ll have a very important upside target somewhere at the first warning line (WL1) of the major descending pitchfork. Only a valid breakout above this line will confirm a further increase.

Will Litecoin recover - Litecoin chart analysis

Will Litecoin recover? You should stay away for now, because we don’t have a great buying opportunity. An accumulation above the 136.61 could bring more bullish energy. Technically, we have a very strong resistance line at the inside sliding line (SL) of the descending pitchfork.

The perspective will remain bullish as long as the rate stays above the 136.61 static support (resistance turned into support).

Categories
Forex Market Analysis

Hot Topics – December 18 to 21, 2017

Hot Topics:

  • US DOLLAR – THE BEARISH BIAS DUE TO TAX REFORM CONTINUES.
  • GBP-USD – BREXIT NEGOTIATIONS AND ECONOMIC GROWTH DRIVES STERLING.

This past week presented significant advances for the New Zealand dollar with a 2.25% advance, due mainly to the weak inflation data (YoY) shown by the American economy (1.7% vs. 1.8% expected). The increase of the interest rate by the FOMC was not enough to reverse the advance of the Kiwi.

The worst performance of the week was exhibited by the British Pound with a -0.41% loss. The BoE decided to keep the interest rate at 0.5% in the context of an increase in unemployment for a second consecutive month, reaching 4.3%. On the other hand, inflation (YoY) scored a 3.1% advance, the highest level for almost six years; specialists believe that CPI is reaching a peak and that it could mainly impact the cost of the services sector.


 US DOLLAR – THE BEARISH BIAS DUE TO TAX REFORM CONTINUES

Dollar begins a bearish week in the context of uncertainty over the approval of tax revision legislation with the aim of making American companies more competitive.

The Republican Senator Bob Corker has expressed concern about the fiscal deficit that can result from the tax cuts. Despite having a position in favour of the tax review, doubts remain in the approval of the reform, in the same way that the Senate rejected the Trump Administration’s proposal to suppress Obamacare last July.

The Greenback has broken the bullish guidance that has reached S3; there is a possibility that it will develop a bullish reversal movement up to the weekly pivot level. You can find more information in our article Finding Trade Opportunities Using Pivot Points.


GBP-USD – BREXIT NEGOTIATIONS AND ECONOMIC GROWTH DRIVES STERLING.

Economic growth and negotiations for Brexit continue to be the primary drivers of the Sterling. On Wednesday, the governor of the BoE will address the Parliament in the context of the hearing of the Select Committee of the Treasury on the November Financial Stability Report.

The British Prime Minister, Theresa May, has assured the Parliament that she is looking for the Brexit transition to be completed within two years. The first phase of the Brexit negotiations has been on the rights of EU citizens in Britain. EU members have agreed to move to the second stage, which focuses on the transition and future commercial relations. The British Parliament has urged May to stand firm in the interests of the United Kingdom, such as a previous Prime Minister, Margaret Thatcher.

Technically, the Pound is developing a corrective structure, with a bias for bullish continuation. The RSI shows a bullish divergence; however, we expect a retracement towards the weekly pivot zone and then continue with the bullish movement in the medium-long term.

 EUR-USD – CORRECTIVE STRUCTURE IN DEVELOPMENT

The single currency is developing a corrective structure; the RSI has not yet shown evidence of rupture. We expect the price to make a bearish movement in five; that means, the euro could move up to R1 and then fall to S2, thus completing a five-wave sequence.


 USD-CAD – LOONIE CONTINUES IN A SIDEWAYS RANGE MOVEMENT.

The Loonie continues in a sideways range formation, waiting for data to act as a catalyst. Most probably, the previous movement will continue to R2 (1.30 level). The RSI is forming a triangular structure that is finding resistance at level 60. The bullish bias still prevails, with the average of 9 periods under the RSI.


 NZD-USD – A PENNANT THAT COULD BE A PAUSE OF A NEW RALLY.

Last week, the Kiwi was the best currency performer with a 2.25% increase against the USD. This week it is developing a pennant pattern, manifesting a pause with further continuity of the bullish movement. The RSI, on the other hand, is forming a corrective structure. We expect a false move towards the weekly pivot, and then, continuing the upward cycle to the zone of R2 (0.715).