Moving Average Convergence Divergence: MACD
Moving Average Convergence-Divergence, MACD, was developed in 1979 by Gerald Appel as a market-timing tool, and It’s an advanced derivation of moving averages.

MACD consists of two exponential moving averages (EMA’s) of different periods that are subtracted, forming what is called the fast line. There is a second, slow line, that’s a short-period moving average of the fast line.
How to compute the standard MACD:
- Compute the 12-period EMA of prices (usually the closing price)
- Compute the 26-period EMA of prices
- Subtract 2 from 1. That is the fast MACD line.
- Compute the 9-period EMA of 3. That is the slow Signal line.
Almost any charting software allows the user to modify these periods and the kind of price (Open, High, Low, Close, or the average of all).
According to LeBeau and Lucas, on their classic book “Computer analysis of the Futures Market,” Gerald Appel had two setups: One for the entry side and another one for the closing side.
The entry side is 8-17-9, while the relatively slower closing side is12-26-9, that became the standard for commercial charting software. This seems to indicate that Gerald Appel had a preference for getting in early in the trend and letting profits run.
My preference for intraday trading is 6-26-12, smoothing the signal line with a 12-period EMA. That reduces the indicator’s lag and having a faster signal that gets entries earlier, while a trailing stop keeps track of the trade at the exit side.
It’s not a good idea to optimize the MACD for a particular market, but, I think that a quicker formula is suitable for less than average volatility markets, and those with higher volatility require more extended period EMA’s. Pivot
Interpretation:
Price represents the consensus of value at a particular moment. A moving average is an average consensus over a period of time. The long-period EMA on a MACD reflects the longer-term agreement, while the short period EMA represents a fresher consensus that is arising.
The subtraction of the moving averages that shapes the fast MACD line reveals shifts in the short-term opinion in comparison to the longer-term (older) view.
Signal Crossovers
The usual MACD signal is a crossover between the fast MACD line and the signal line. When the fast MACD line rises above the slow signal line, it means a bull cycle has begun. If the fast MACD line crosses under the slow signal, a corrective period has started.
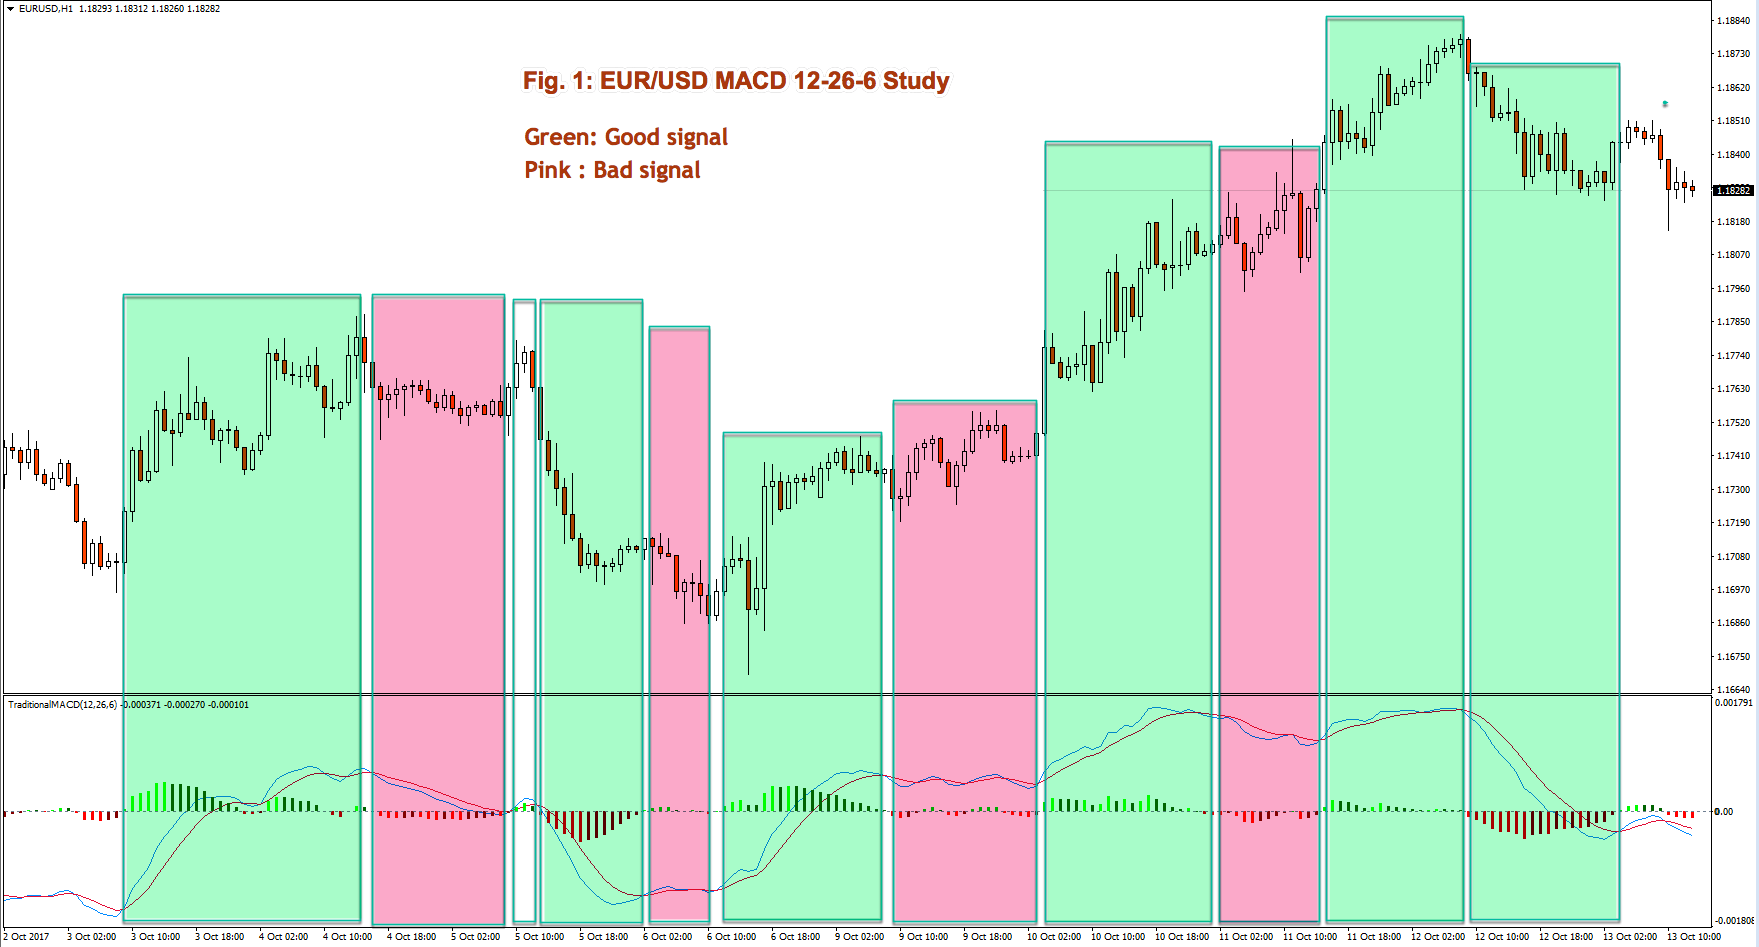
On Fig. 1, we show an example of a EUR/USD 1H chart. There we may observe that pink – unproductive- areas are usually crossovers going against the trend, which happens in reactive segments with ranging price movement. In spite of these failures, a MACD crossover is an efficient way to detect a trend change.
Testing the MACD over 14-year historical data on a 15-min chart of the EUR-USD
To test this system, we use two separate MACD modules. One for the long signals (MACD LE), and one for the short signals (MACD SE).
We will keep a constant 26-period MACD slow MA on both sides, and we will test the map space of the fast MA and the smoothing period to obtain the slow MACD signal.
Below, is shown on both, Long and short signals.
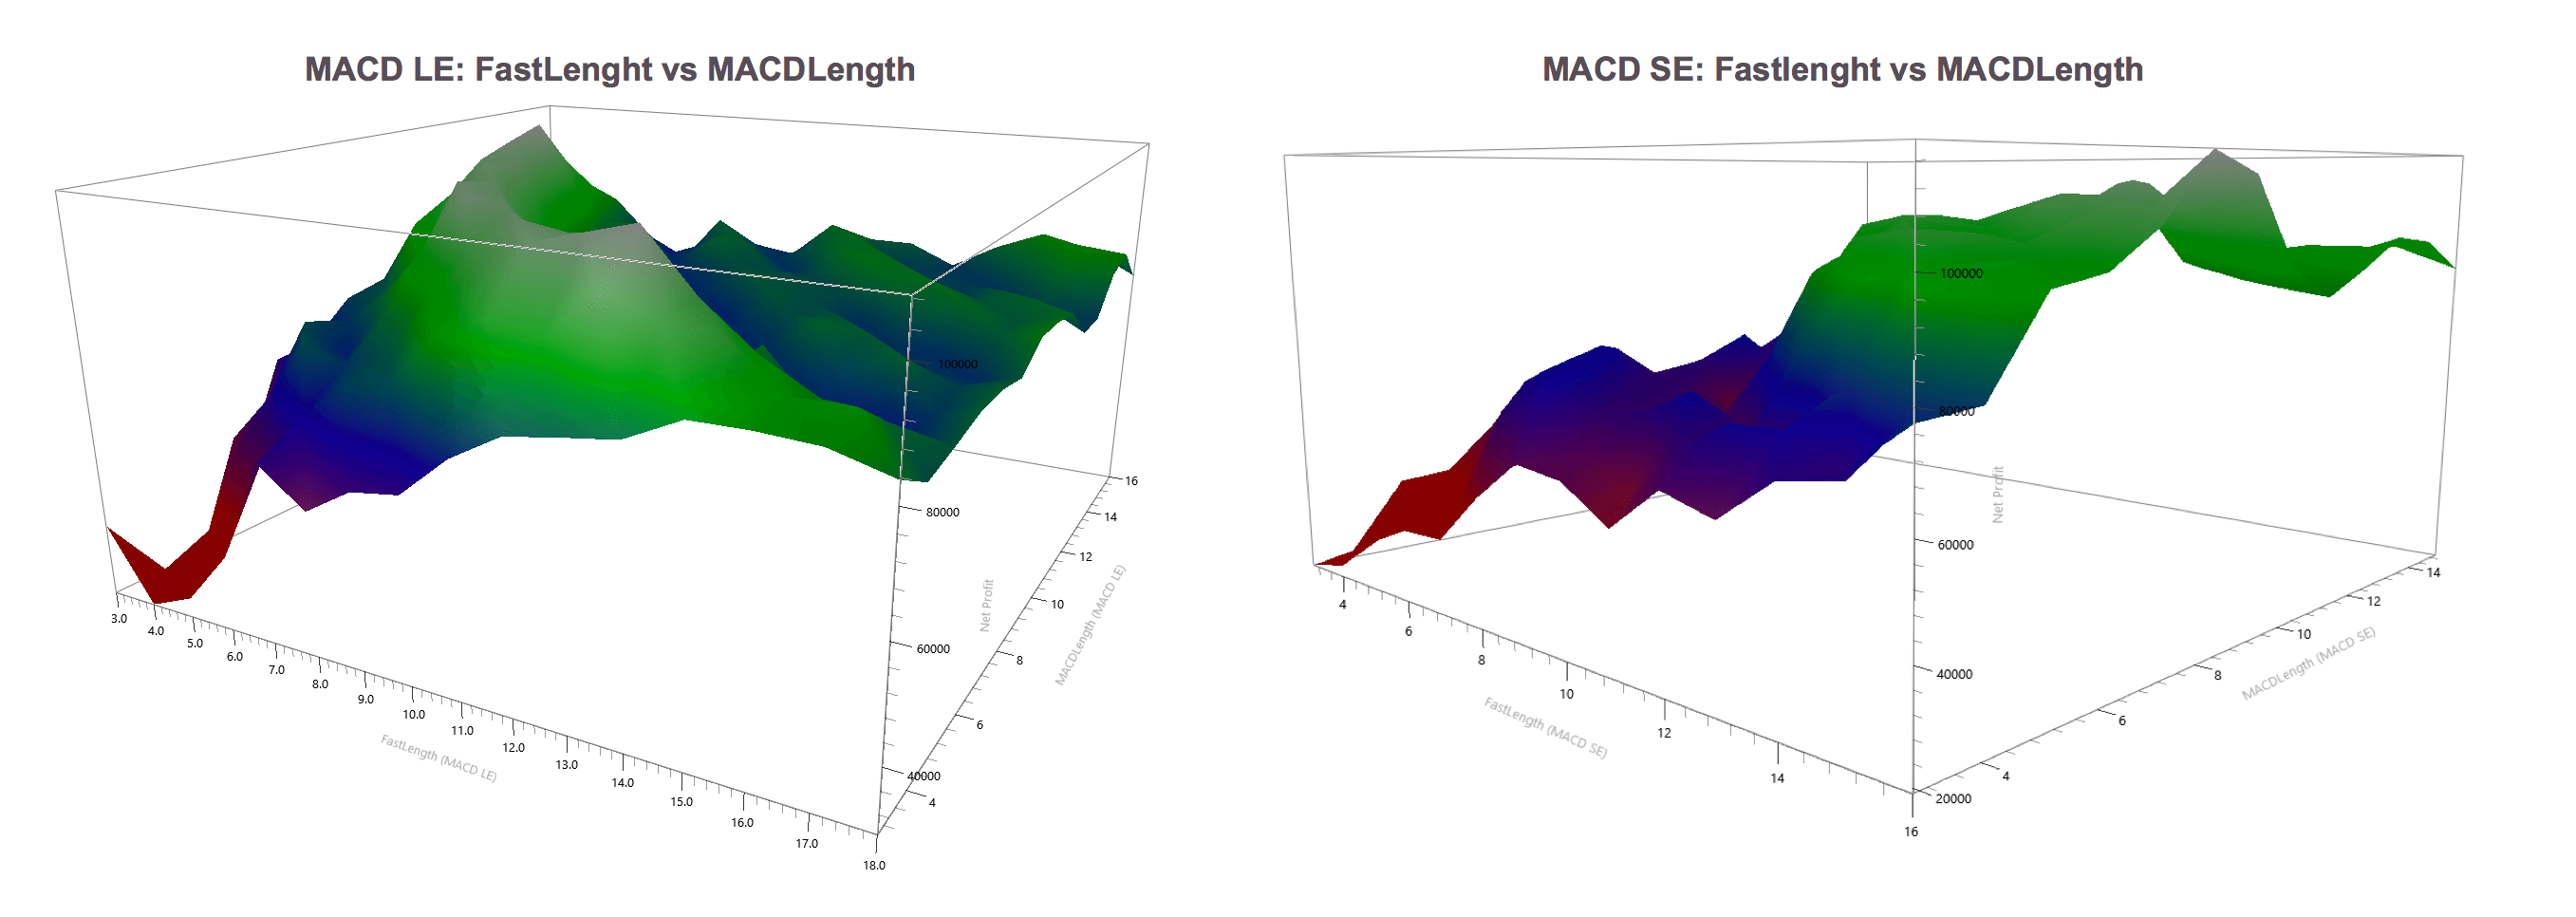
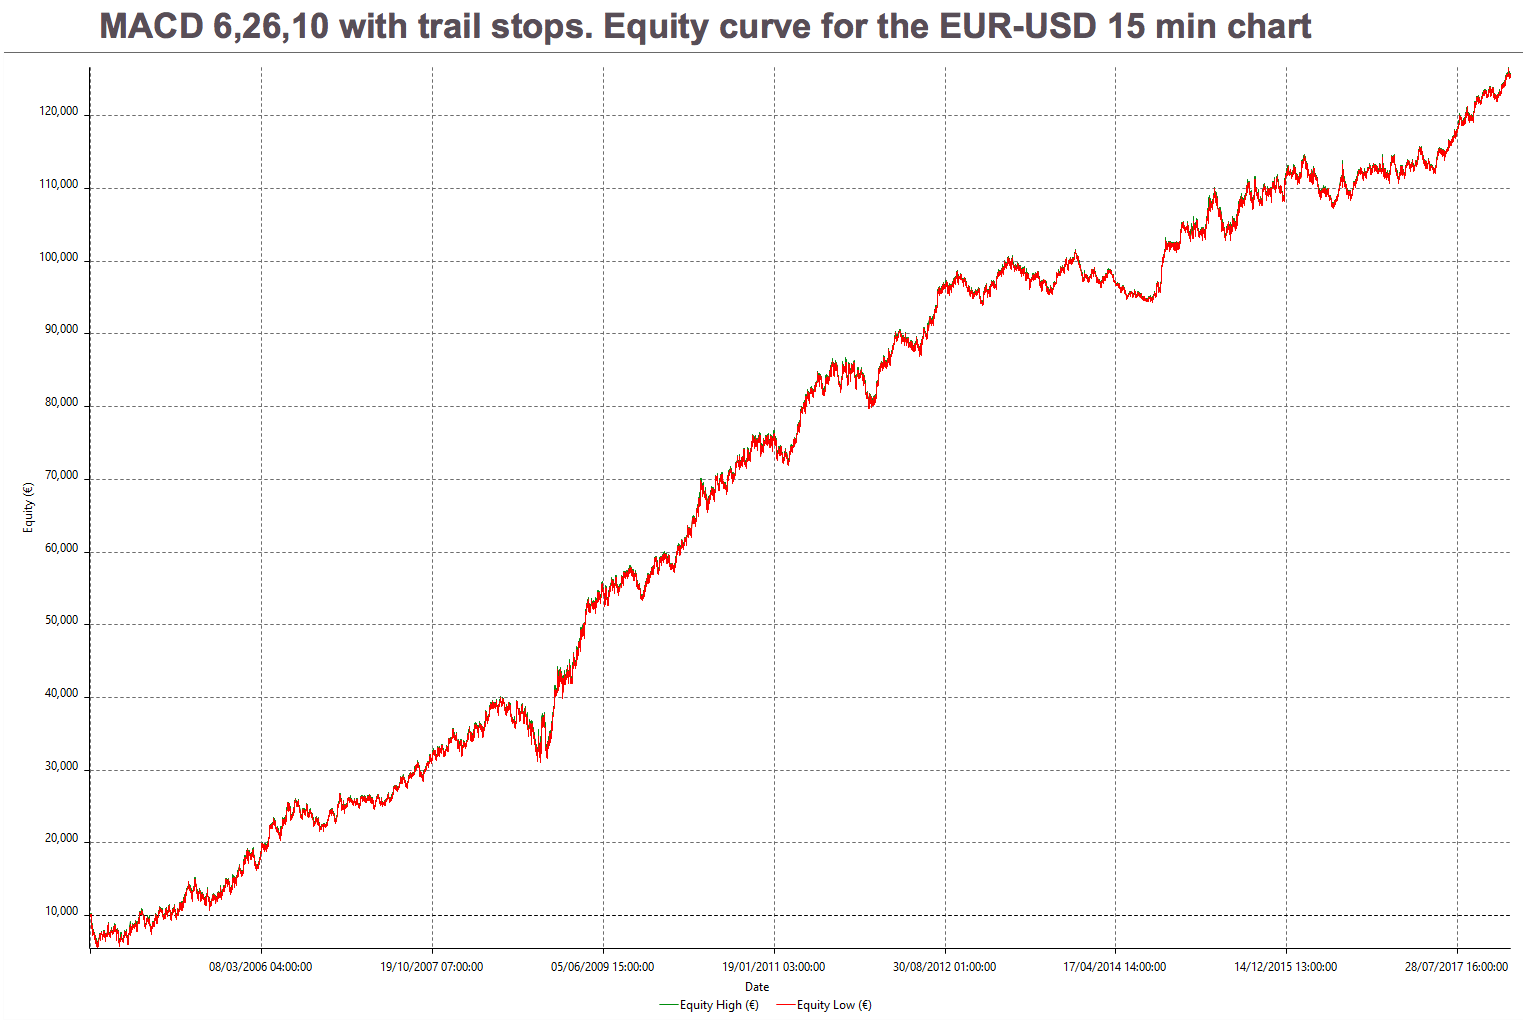
Based on the above figure, we see that the best performing combination is around 6,26,10 settings. Below we show its Equity Curve. That is the raw strategy, without stops nor targets.
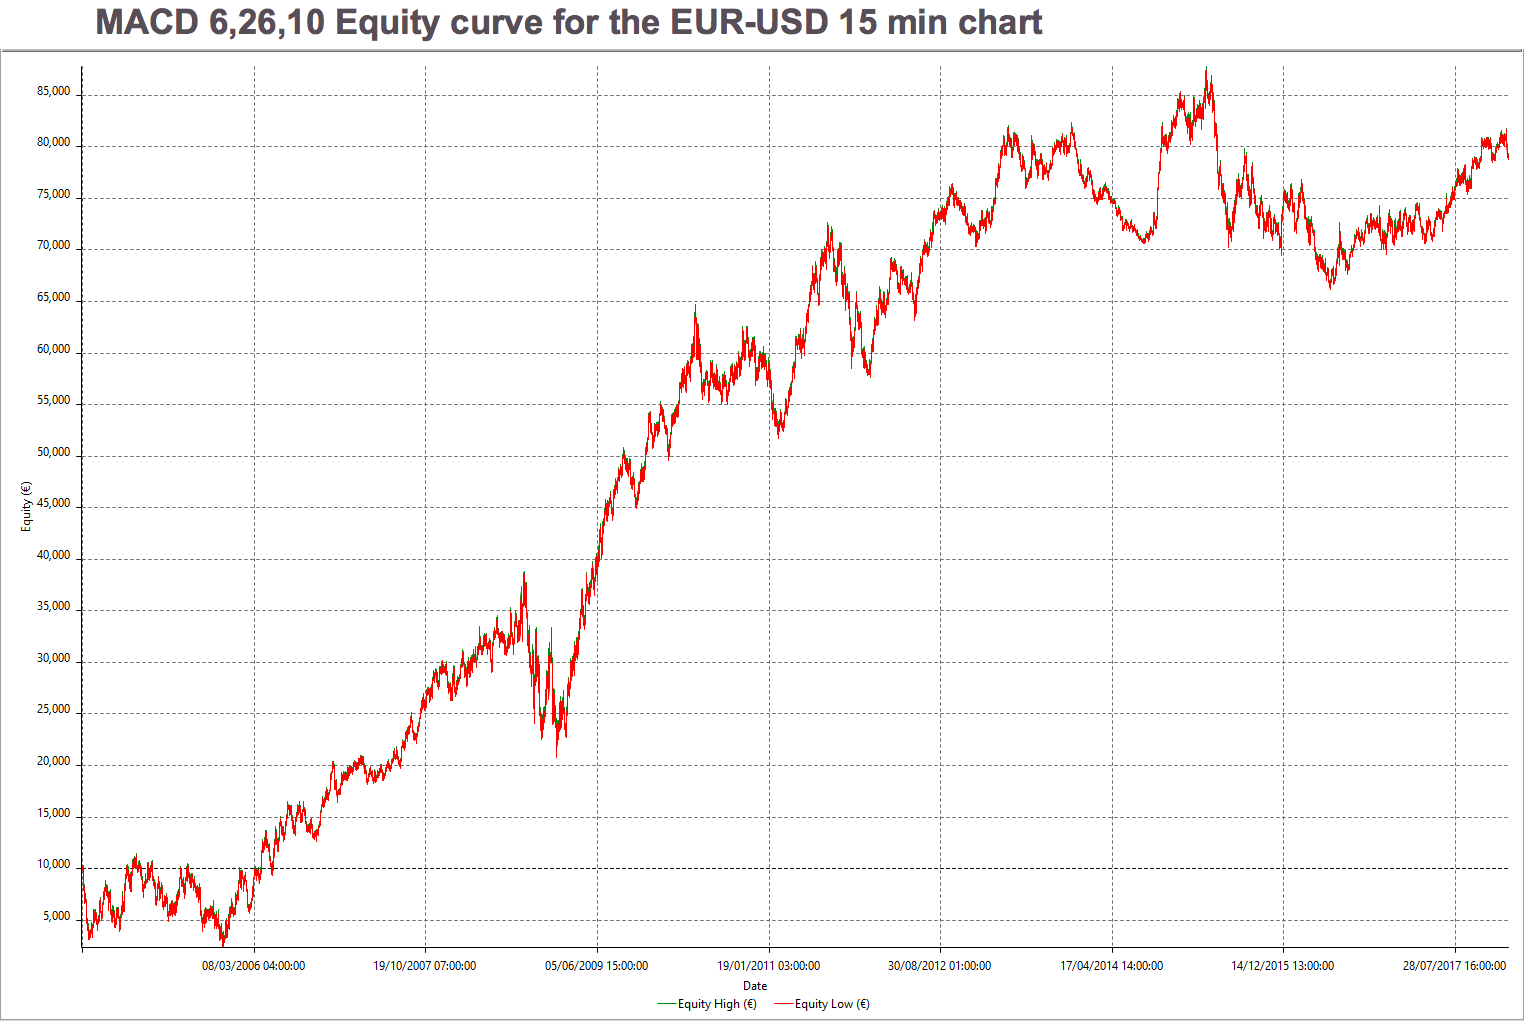
It’s great to see this kind of curve with almost no modification because it shows this trading system is robust, and we know it will improve by merely adding a trailing stop. And we’ll get even more improvement if we add proper profit targets. Below, Both equity curves.
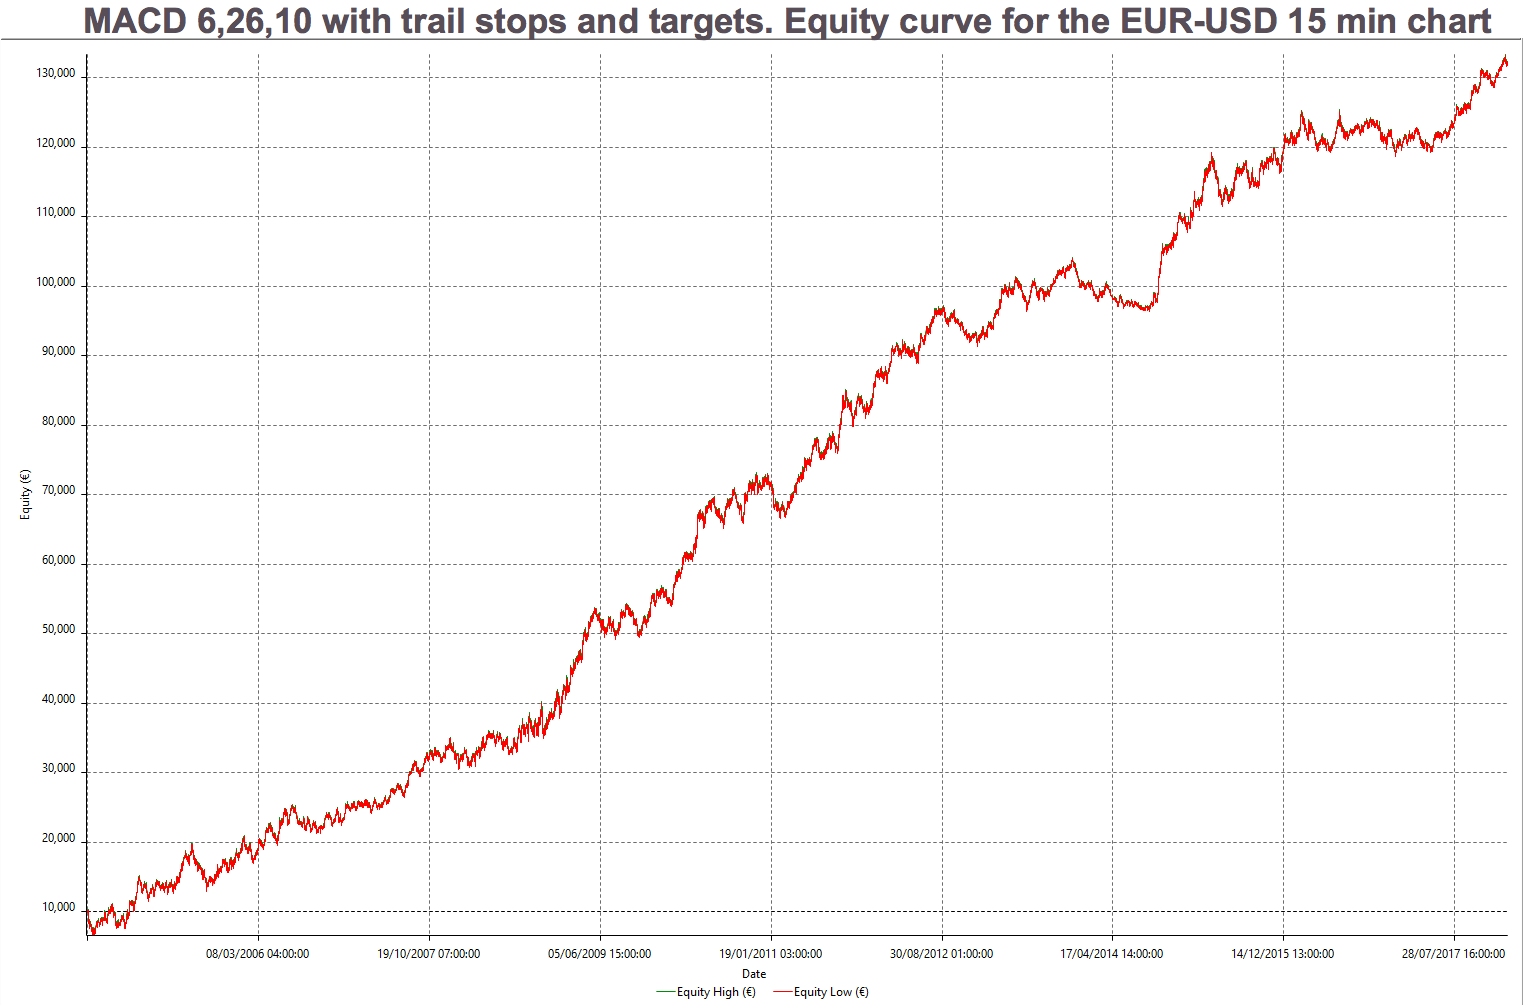
 As we can see, there is a slight improvement in the results using targets. But it’s very small and might be a by-product of the optimization process rather than a real improvement.
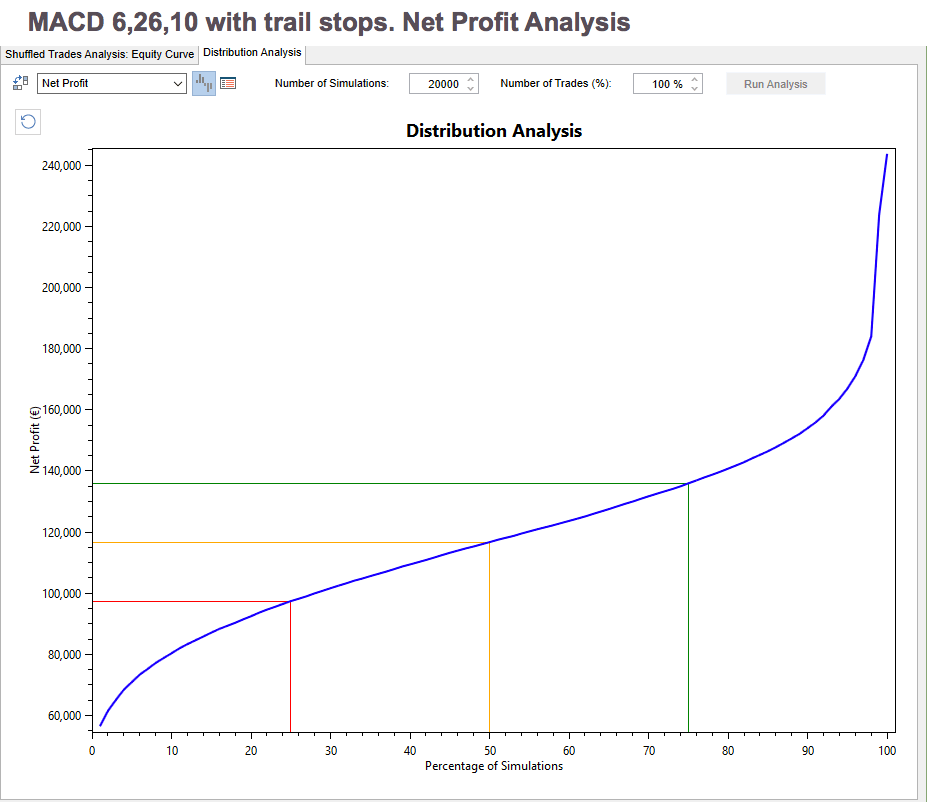
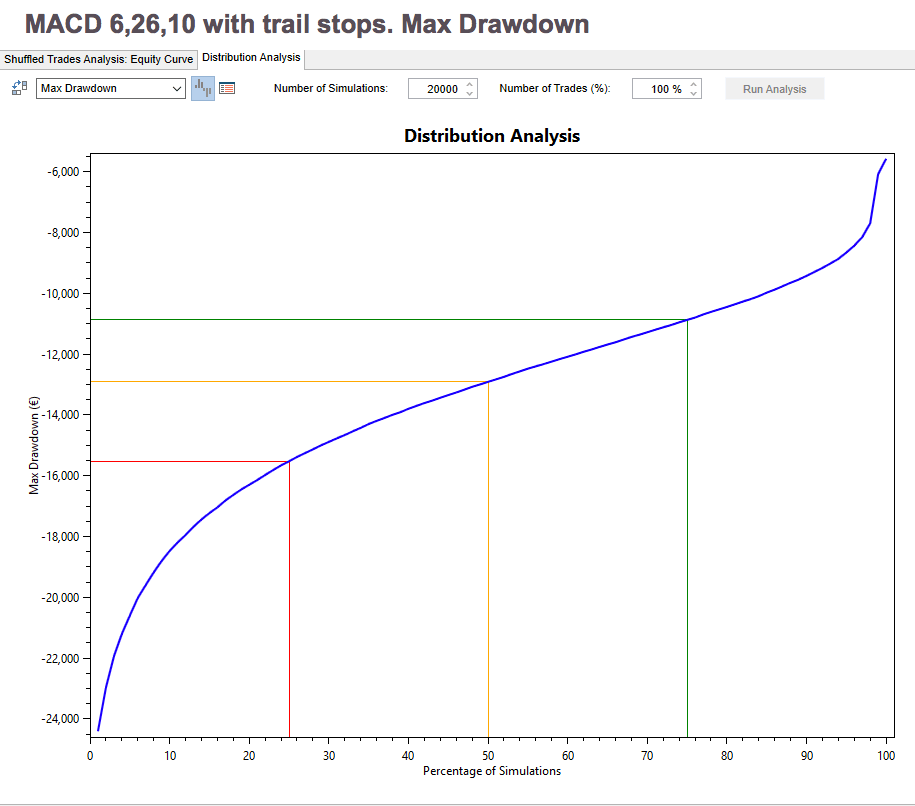
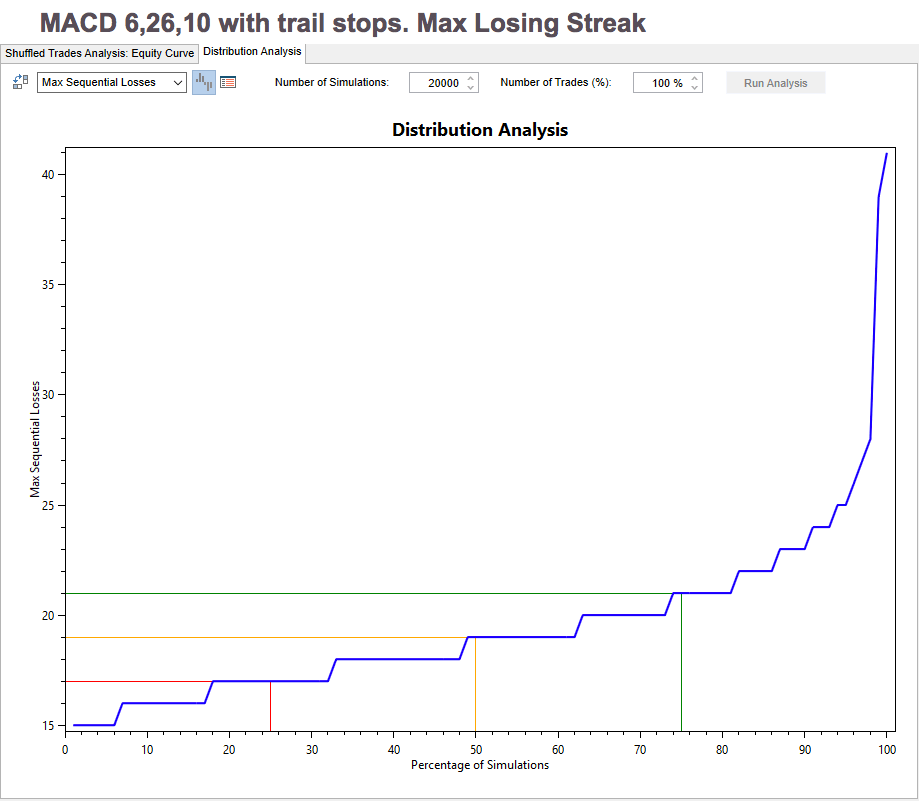
I would recommend the use of this system just using a trailing stop, because, since this is a trend following system, it follows the well-tested advice “let profits run.” Thus, starting from now, we will present the system numbers using just trailing stops. As usual, we show the system with a constant one-lot trade.
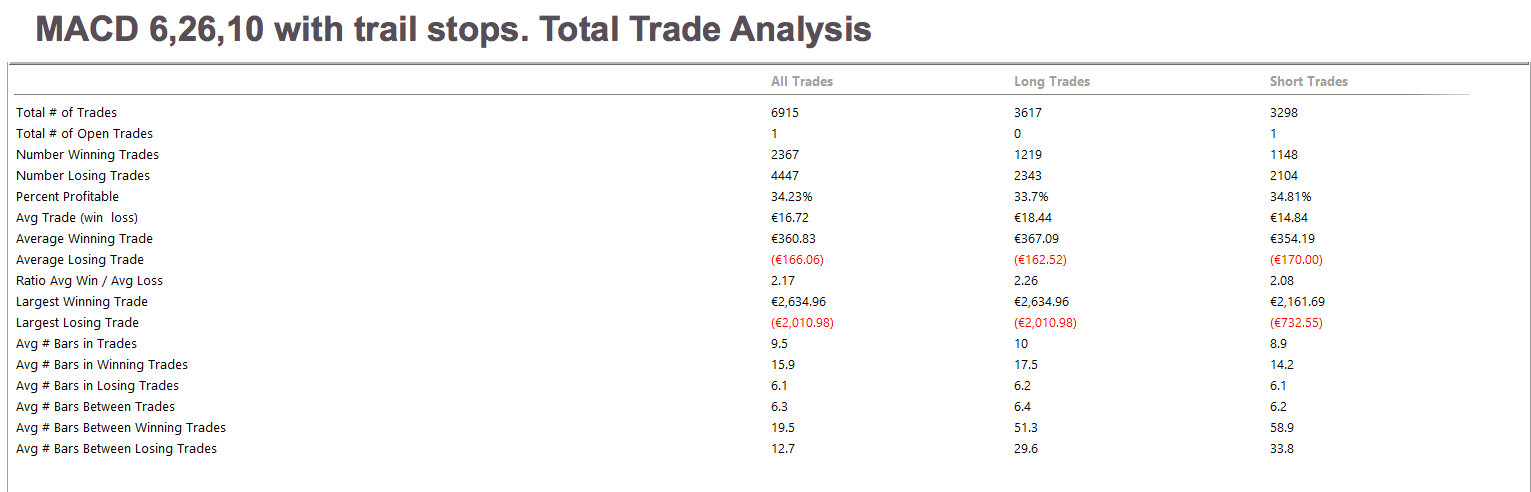
The Total Trade Analysis table shows that the percent winners is at 34.23% and the Ratio Avg Win/ Avg Loss, which shows the reward-to-risk ratio is 2.17.
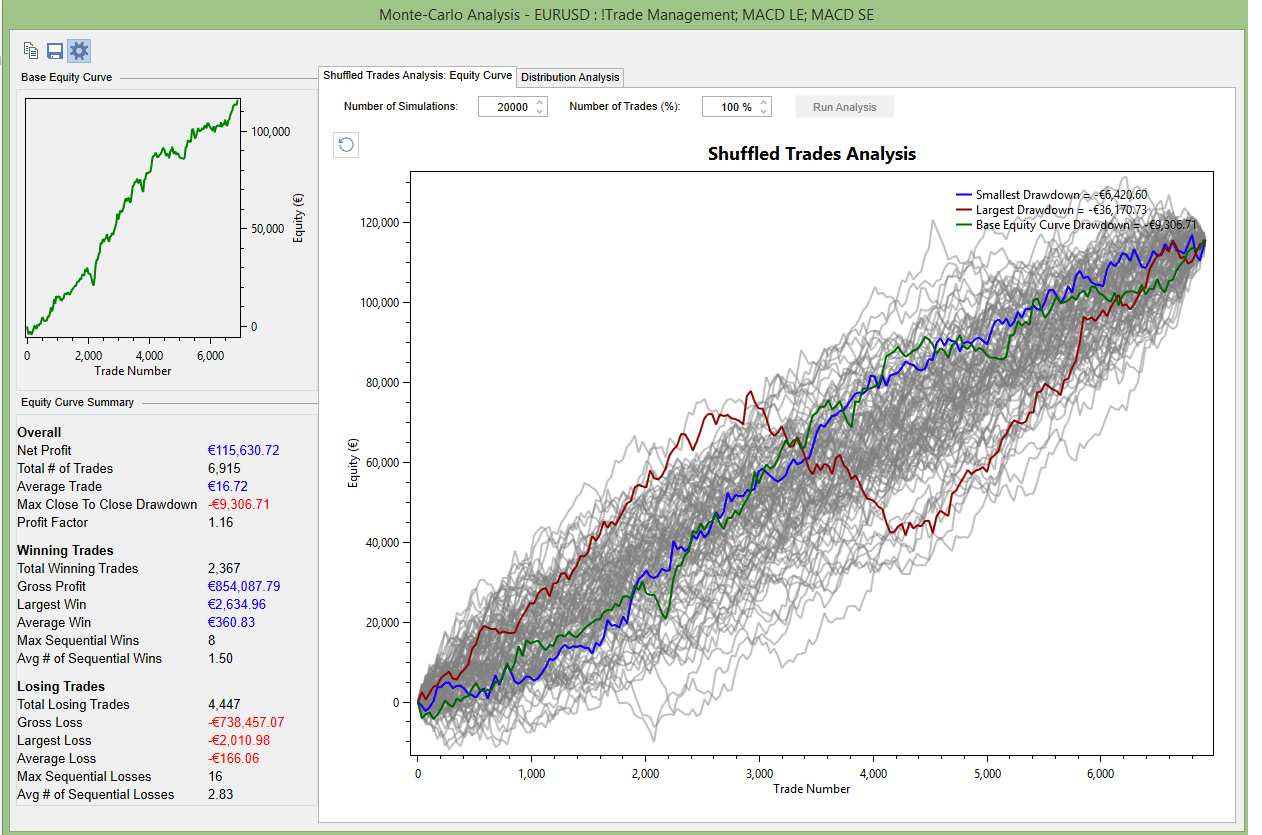
Main metrics of MACD, on the EUR-USD:
How to use Metatrader 4 to trade this strategy
To add a MACD indicator to your chart do the following:

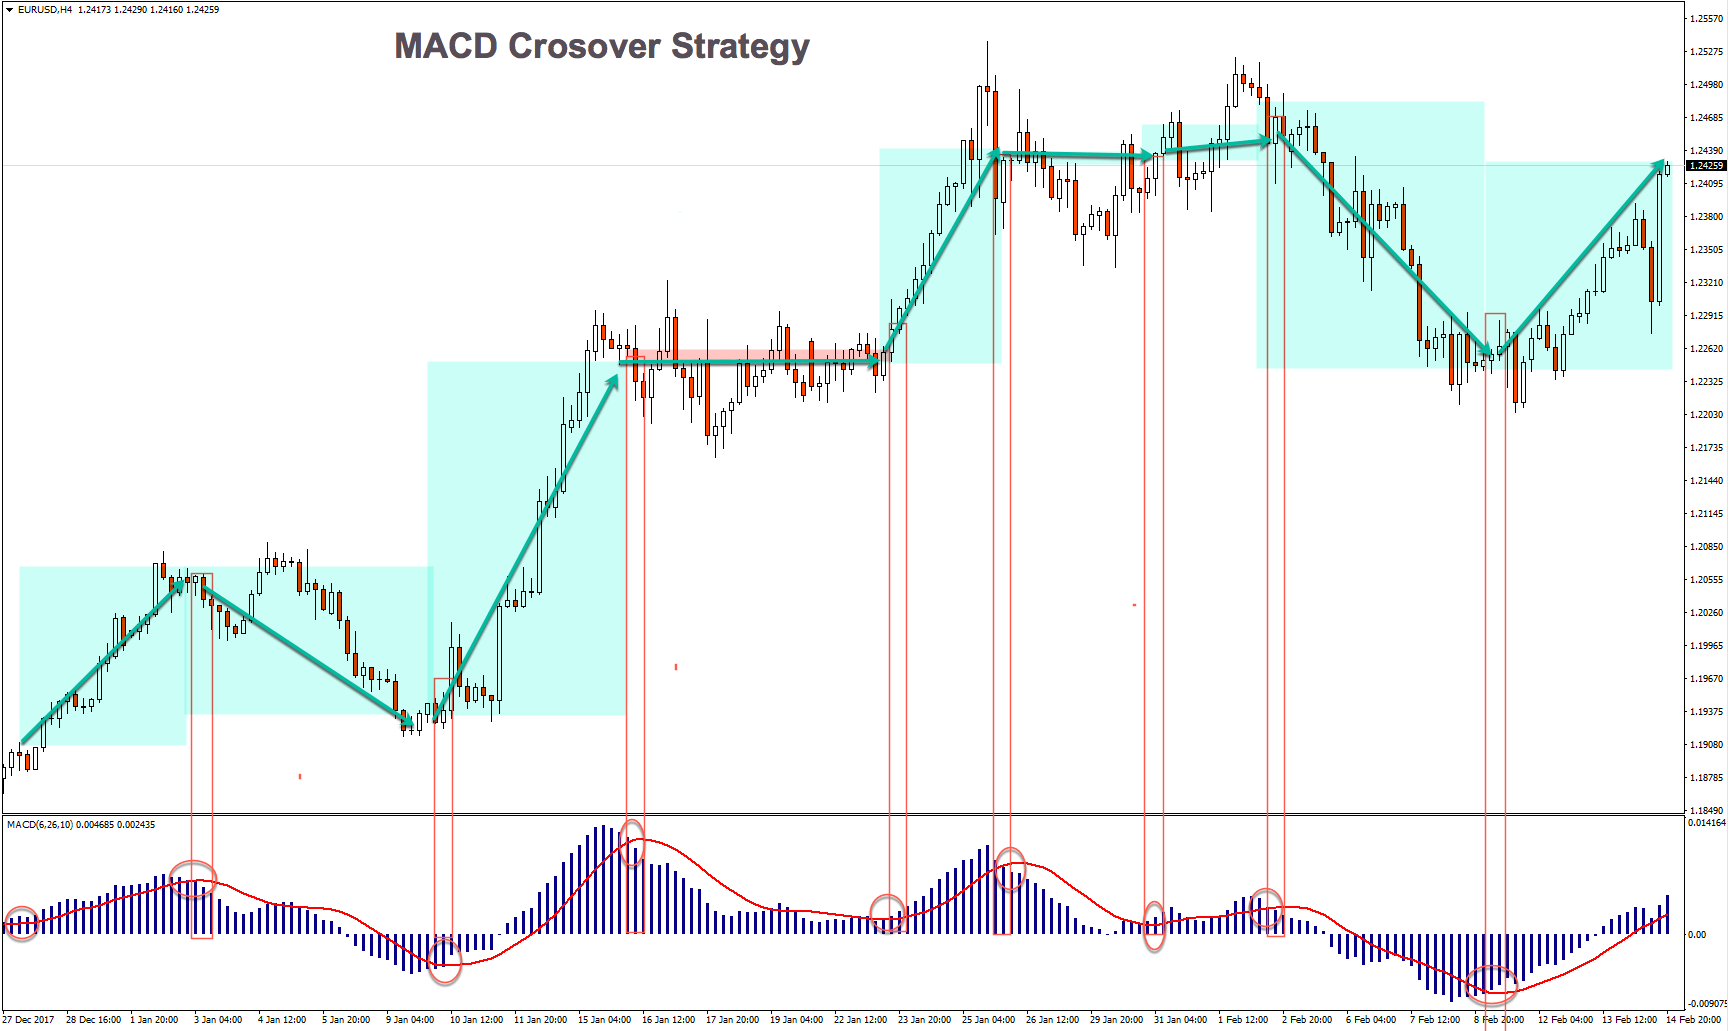
 After clicking the MACD on the menu window, another popup window with several tabs appears. In the Parameters tab, change Fast EMA to 6 and MACD SMA to 10. The Fast MACD line in this platform appears as a histogram, but it’s easy to spot MACD line crossing the fast line. See figure, below: