
Overview

There are two main measures we use routinely: The center of our observations and the variability of the points in our data set from that mean.
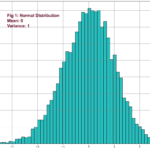
There’s one main way to compute the center of a set: the mean.
Mean: It’s the average of a set of data. It’s computed adding all the elements of a set and divide by the number of elements.
The variability of a data set may be calculated using different methods. One of the most popular in trading is the range.
Range: The range is the difference between the highest and lowest points in a data set. On financial data, usually, a variant of the range is calculated: Average true range, which gives the average range over a time interval of the movement of prices.
The Strategy
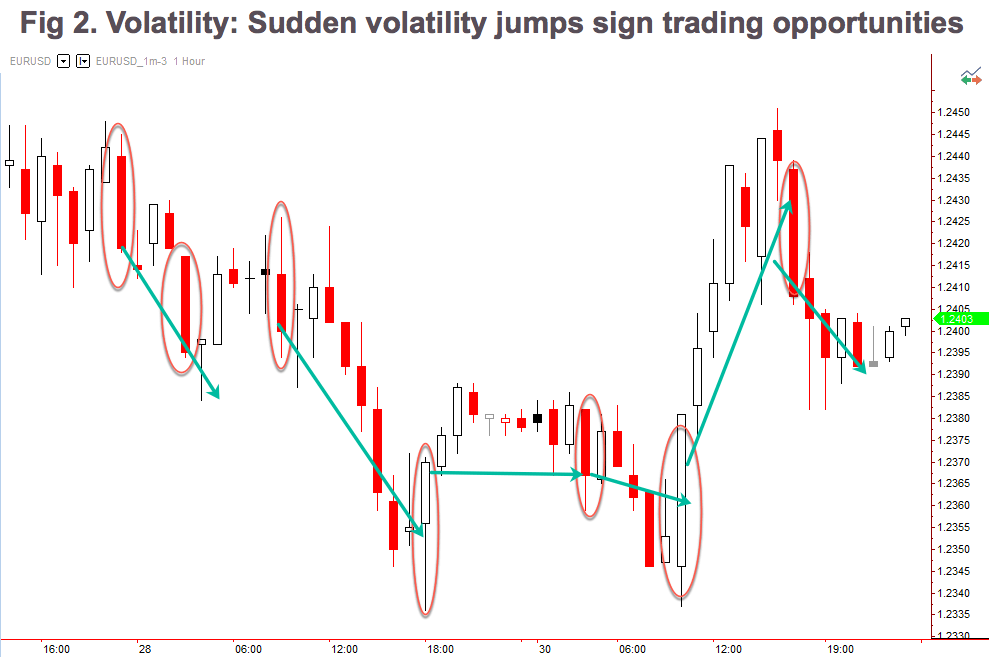
The Volatility Expansion Strategy rationale is that a sudden thrust in the volatility in the opposite direction of the current momentum predicts further moves in the same direction.
For this strategy, we are going to use the Range as a measure of volatility. Specifically, we are going to use the Average True Range indicator to spot volatility sudden changes.
The rules of the strategy are:
Long Entries:
Set a buy stop order at Open + Average( Range, Length ) * NumRanges next bar
Short Entries:
Set a stop sell short order at Open – Average( Range, Length ) * NumRanges next bar
The parameters are the Length of the average and the NumRanges for longs and shorts.
Manage your trade using a trailing stop.
Let’s see how an un-optimized system performs under 14 years of EUR_USD hourly data:
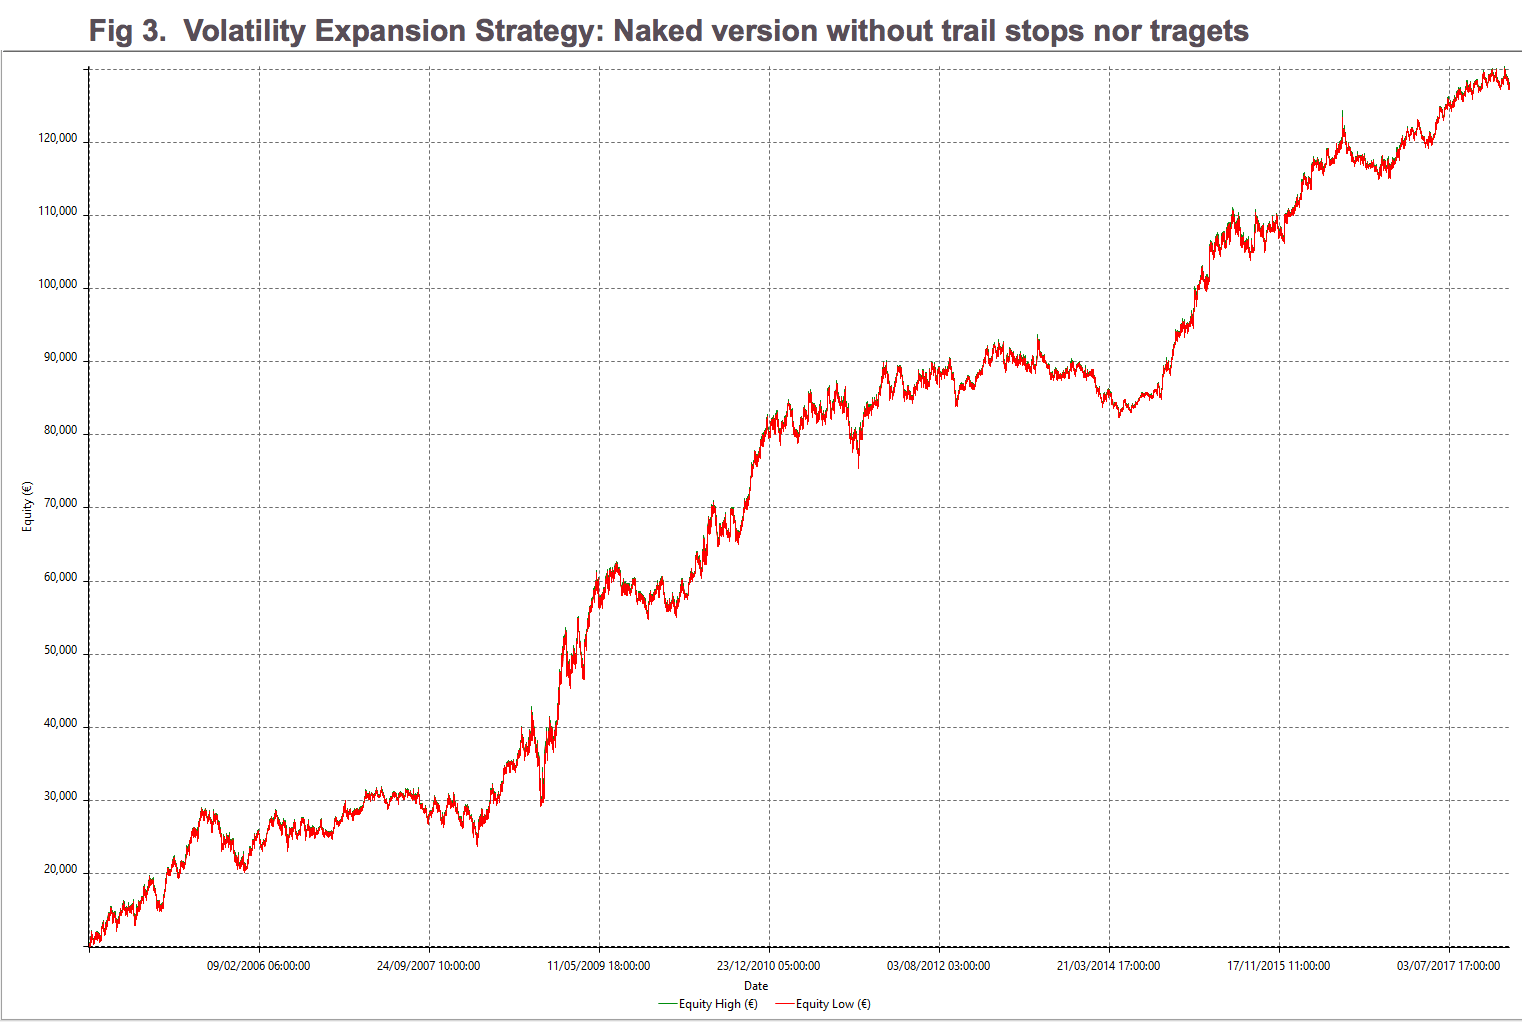
The standard parameters are:
Length: 4
NumRanges: 1.5
As we can observe, the actual raw curve is rather good, showing a continuously growing equity balance. ( click on the image to enlarge)

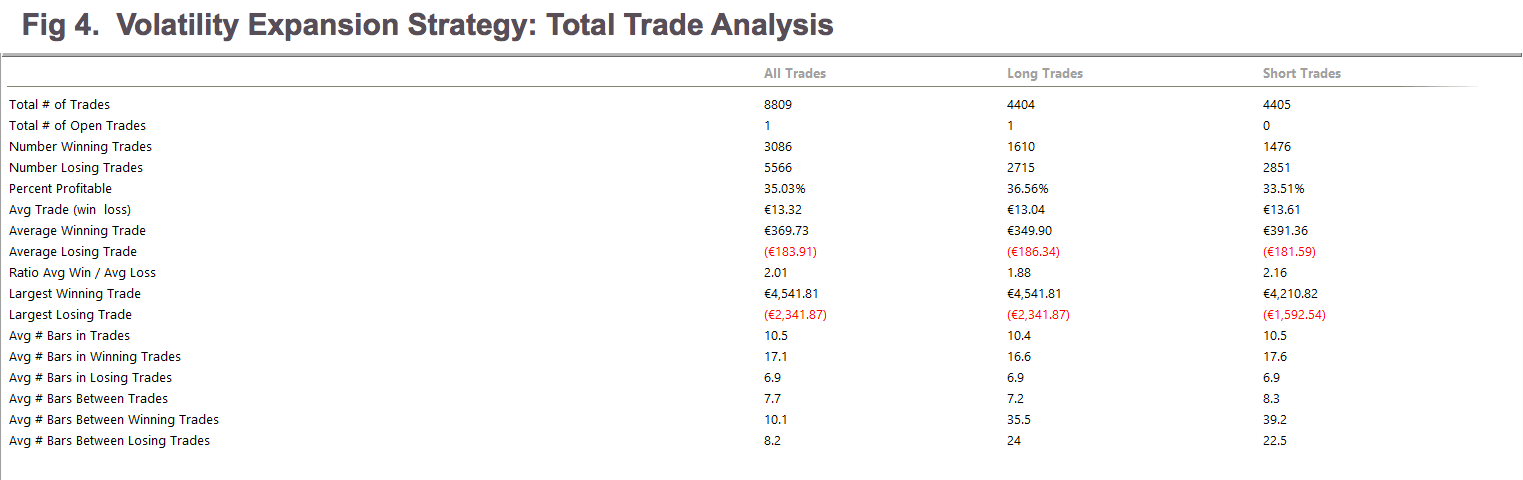 The Total Trade Analysis for single-contract trades shows a nice 2:1 Reward to risk ratio (Ratio Avg Win/Avg Loss) and a 35% winners.
Analyzing the Parameter map:
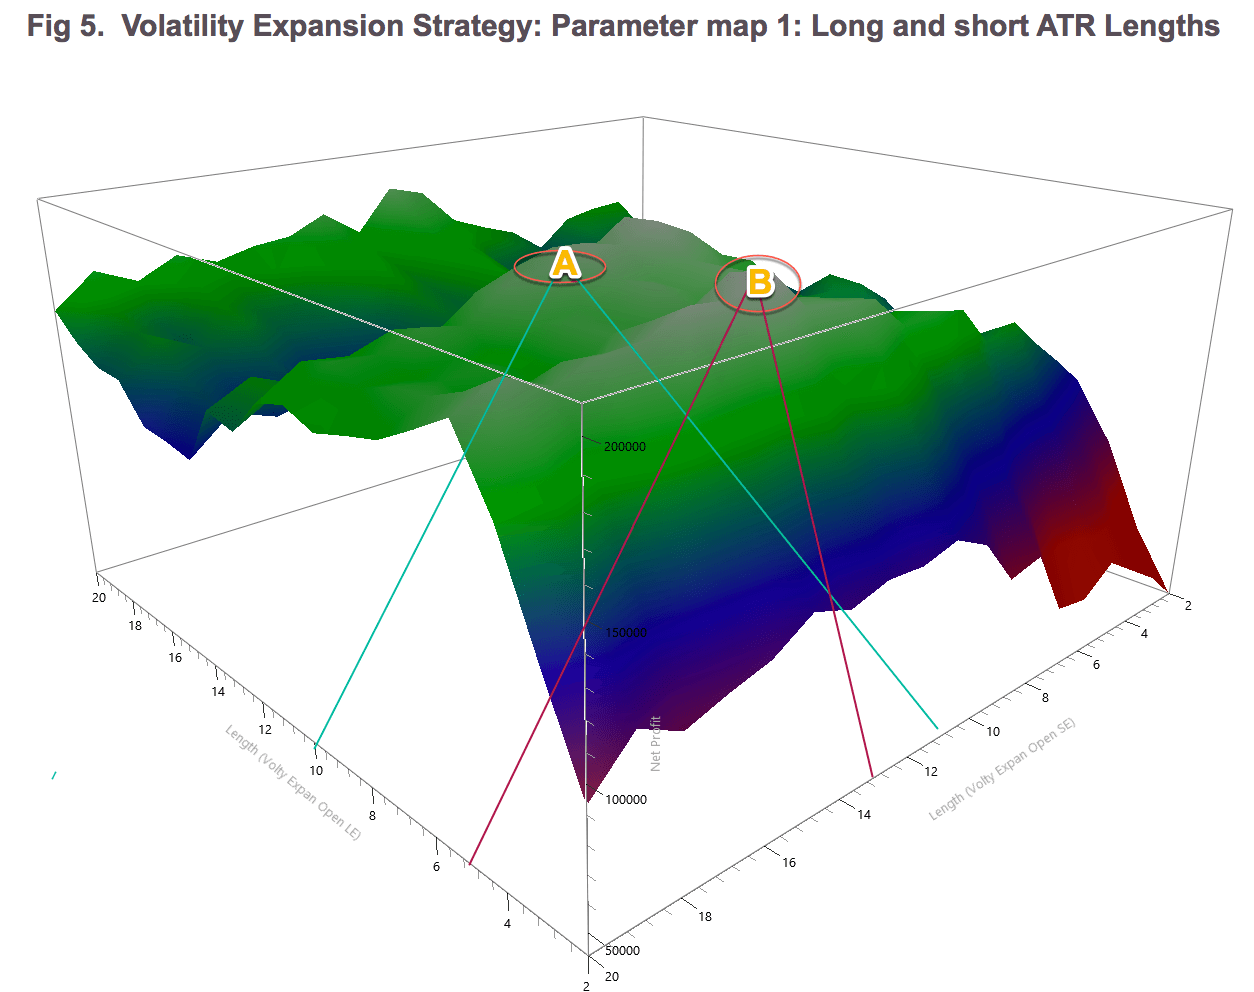 As we observe in fig 5, there are two areas A and B where to locate the best parameters for this strategy. The surface is smooth, thus, guarantying that a shift in market conditions won’t harm too much the strategy. For the sake of symmetry we will choose the A region, thus, the Long ATR length will be 10 and the short ATR length is left at 13.
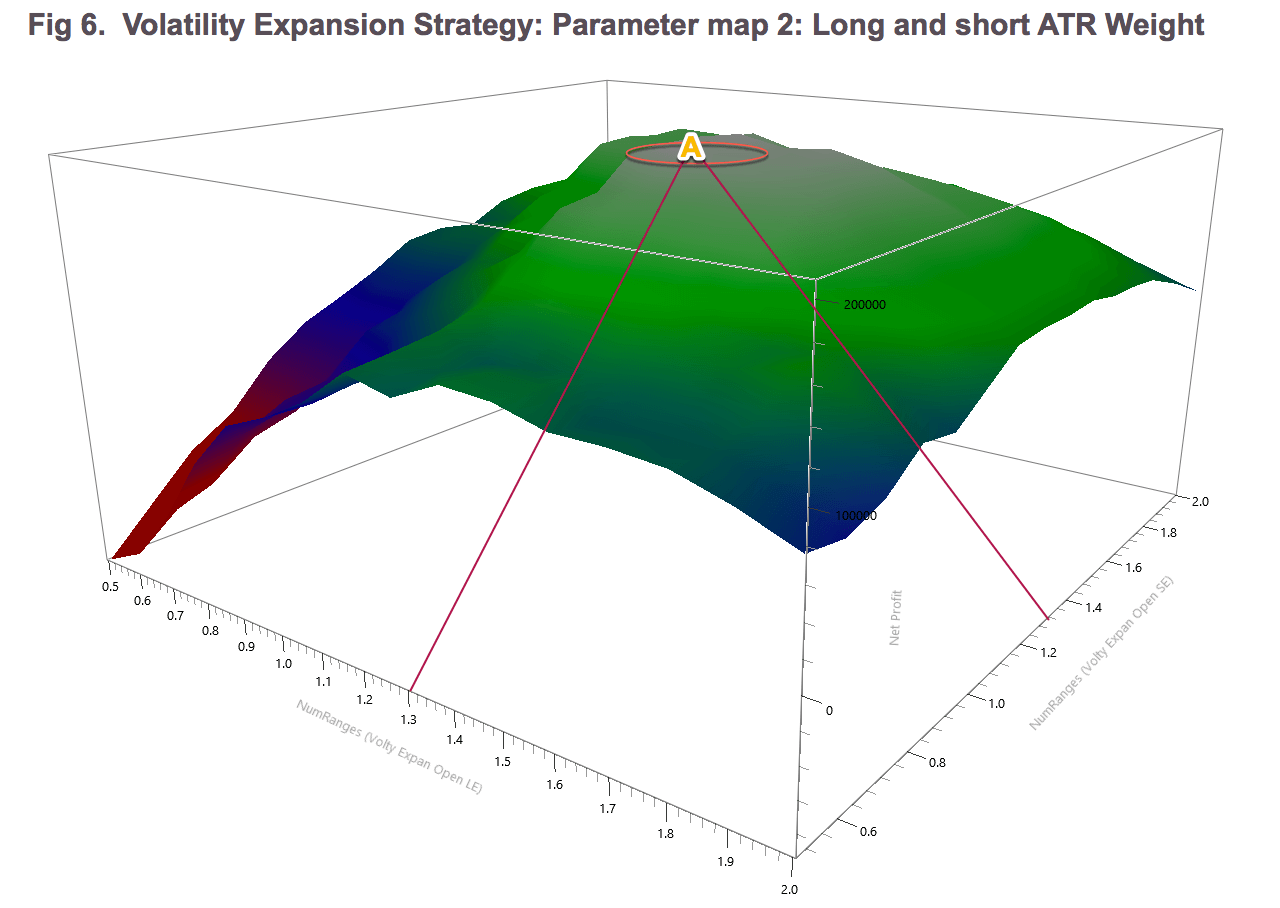 Fig 6 shows the map for the NumRanges That weights the ATR value and sets the distance of the stop order from the current open. The surface is, also, very smooth. Therefore we can be relatively sure that setting the NumRages value to 1.3 in both cases we will get good results.
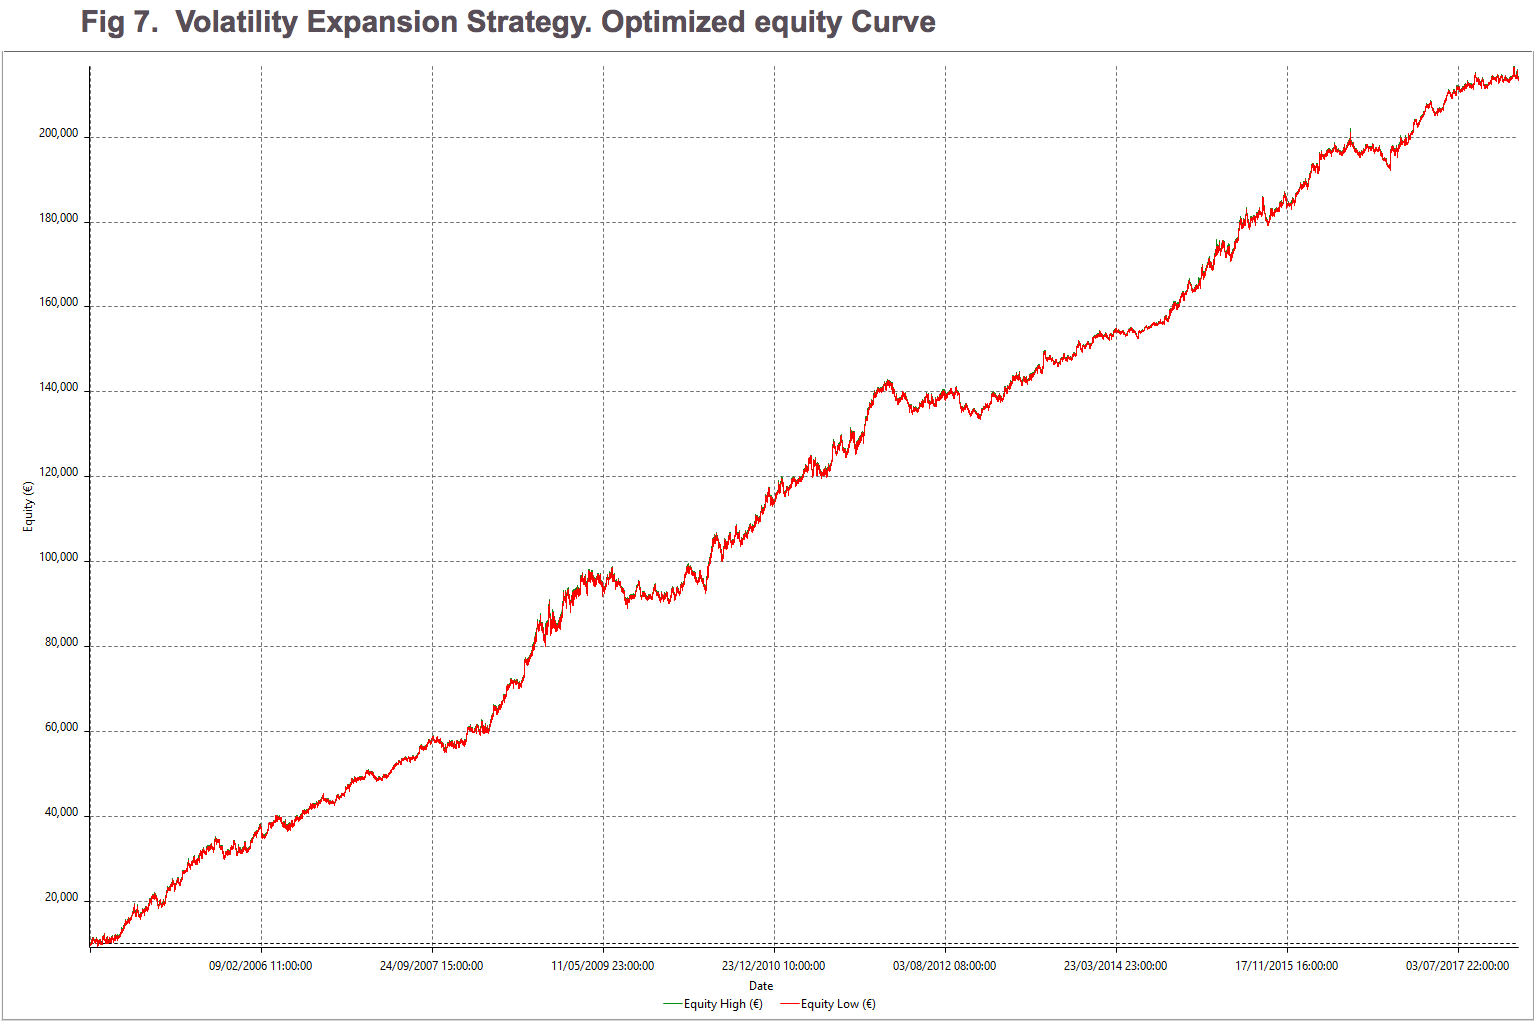
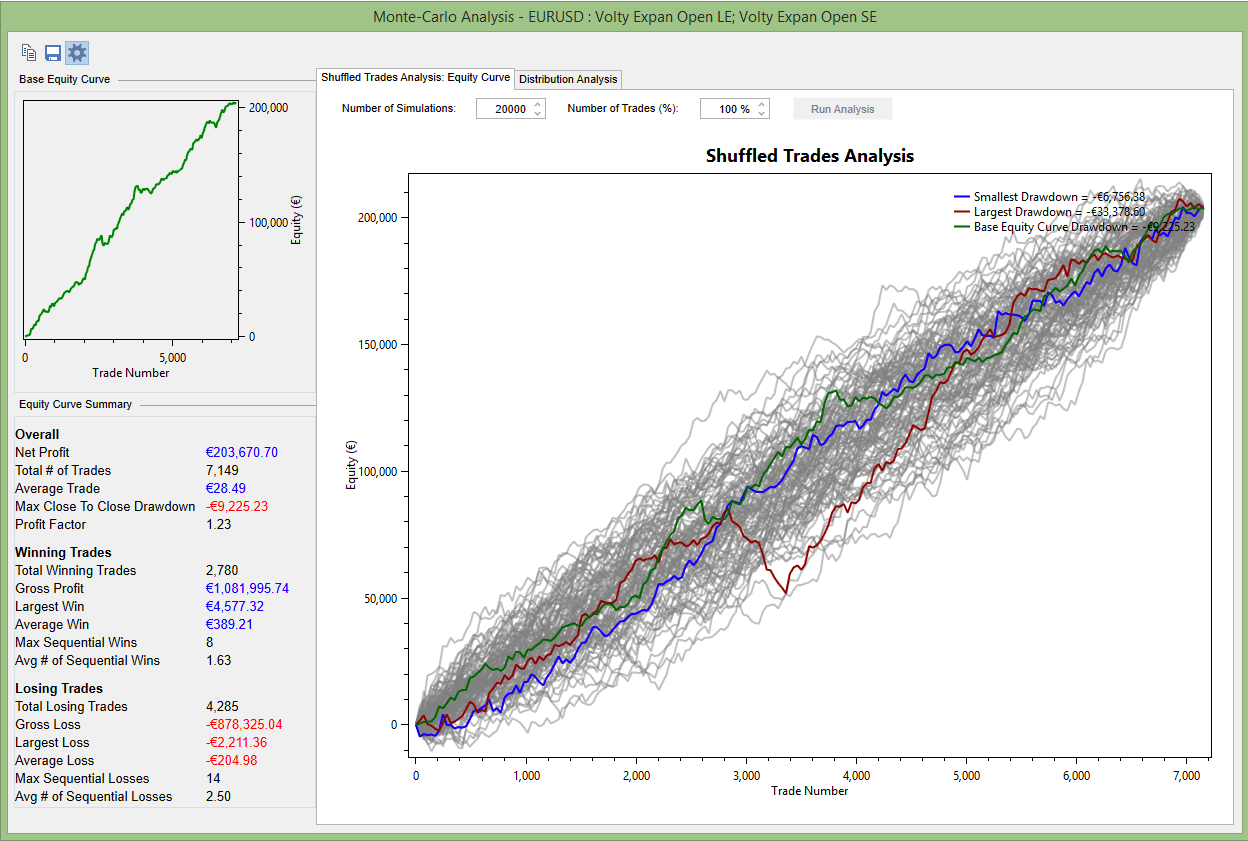
The new equity curve has improved a lot, especially in the drawdown aspect, and in the overall results, as well, although we know this isn’t a key aspect because this equity result was achieved with just a single-contract trade.
 This kind of strategy incorporates its stops because it’s a reversal system. Therefore there is no need for further stops or targets.
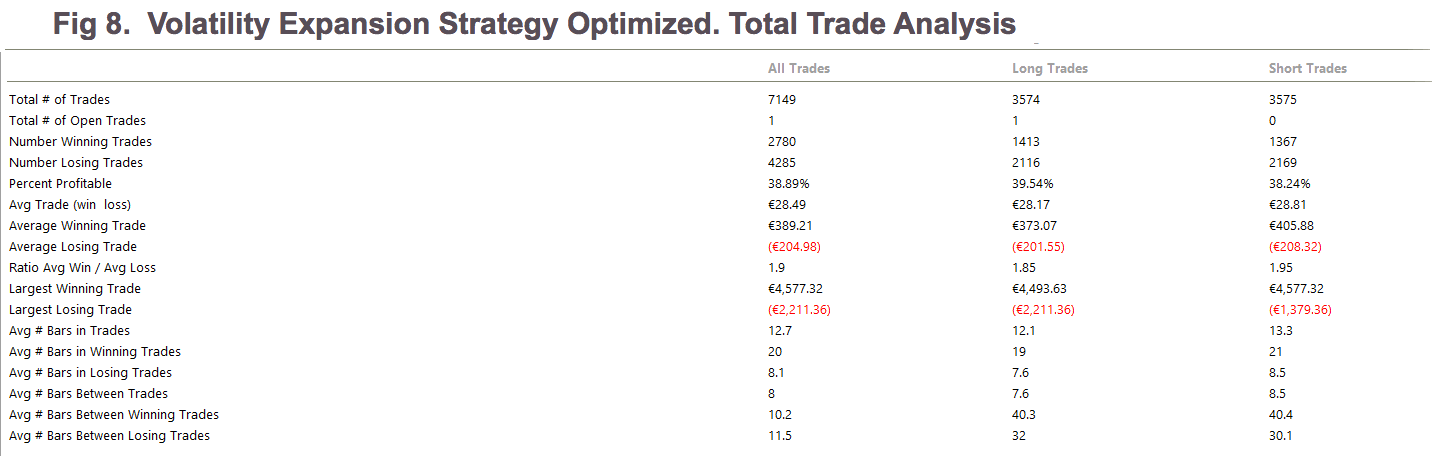 In fig 8 we observe that the percent winners are close to 39% while the risk to reward ratio represented by the ratio Avg win/ Avg loss is 1.9. Also, we see that the average trade us 28.5 euros which is the money expected to gain on every trade. That shows robustness and edge.
Main metrics of the Volatility Expansion System, on the EUR-USD
(click on the images to enlarge)


As a final note, one way to perform semi-automated trading using a volatility expansion is the free indicator Volatility Ratio, from MQL5.com
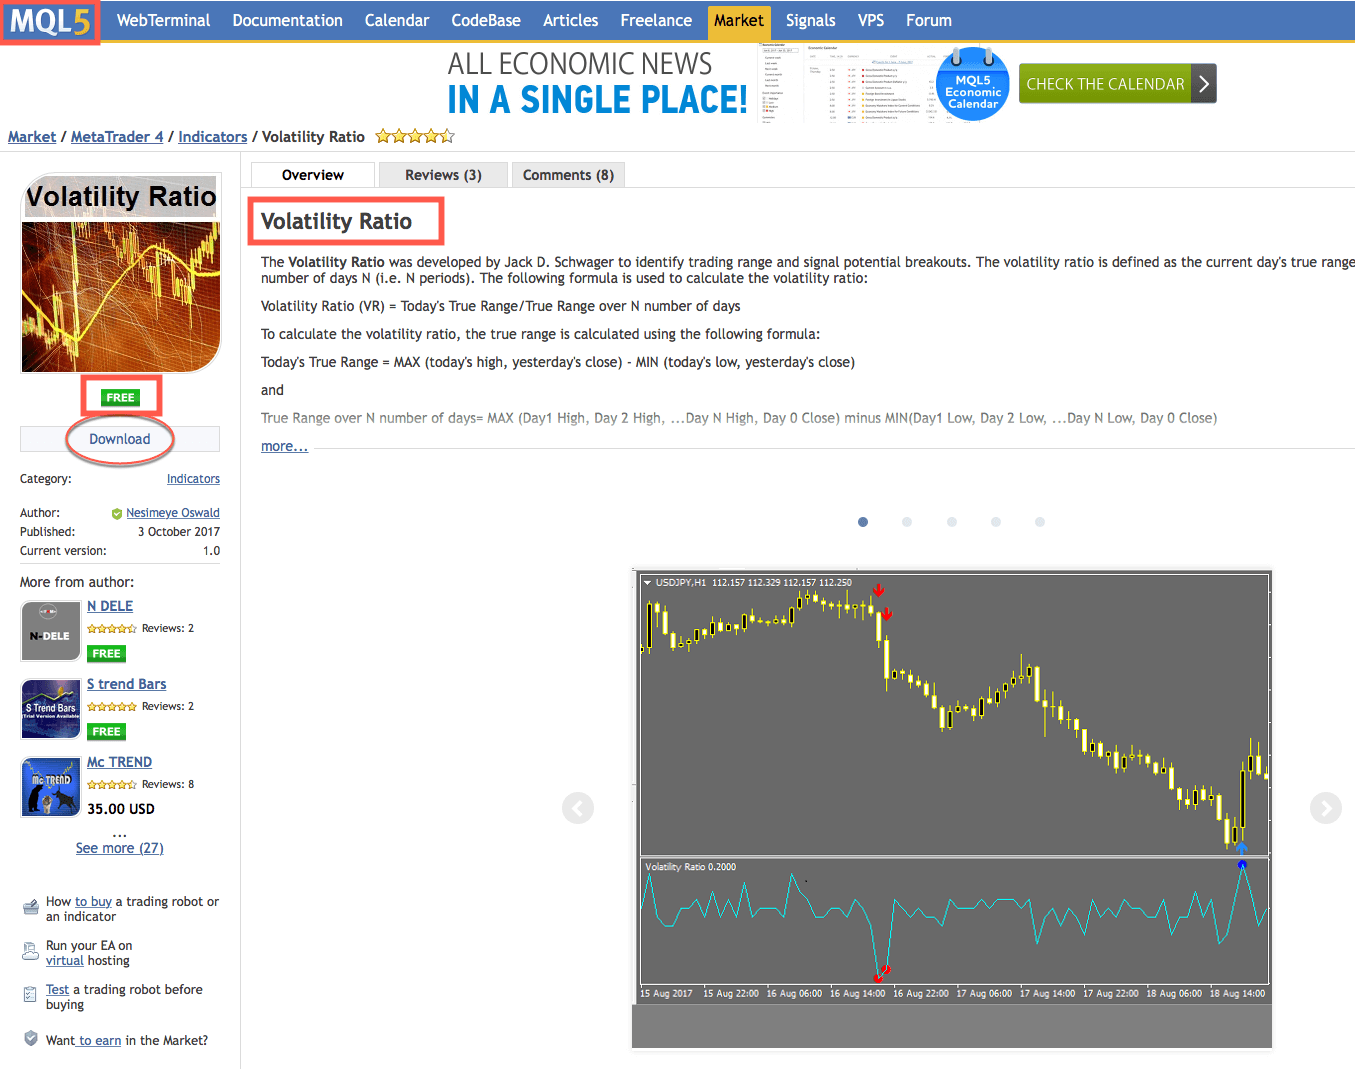 When you click on the Download button, a pop-up window appears:
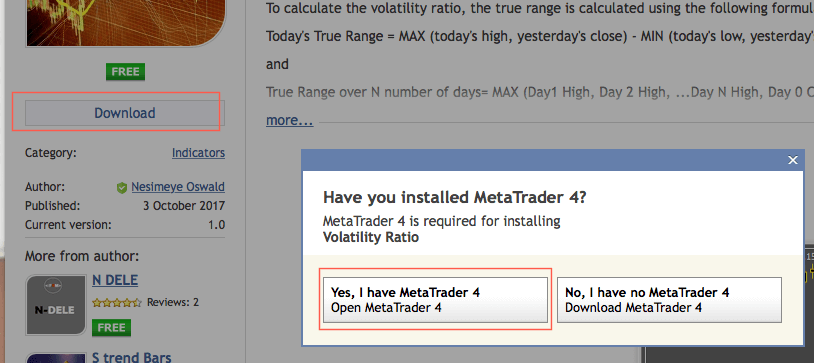 When you click on the Yes, this indicator is installed automatically in your MT4 platform. To use it on a chart you just go to Insert -> Indicators -> Custom-> Volatility Ratio, as shown below:
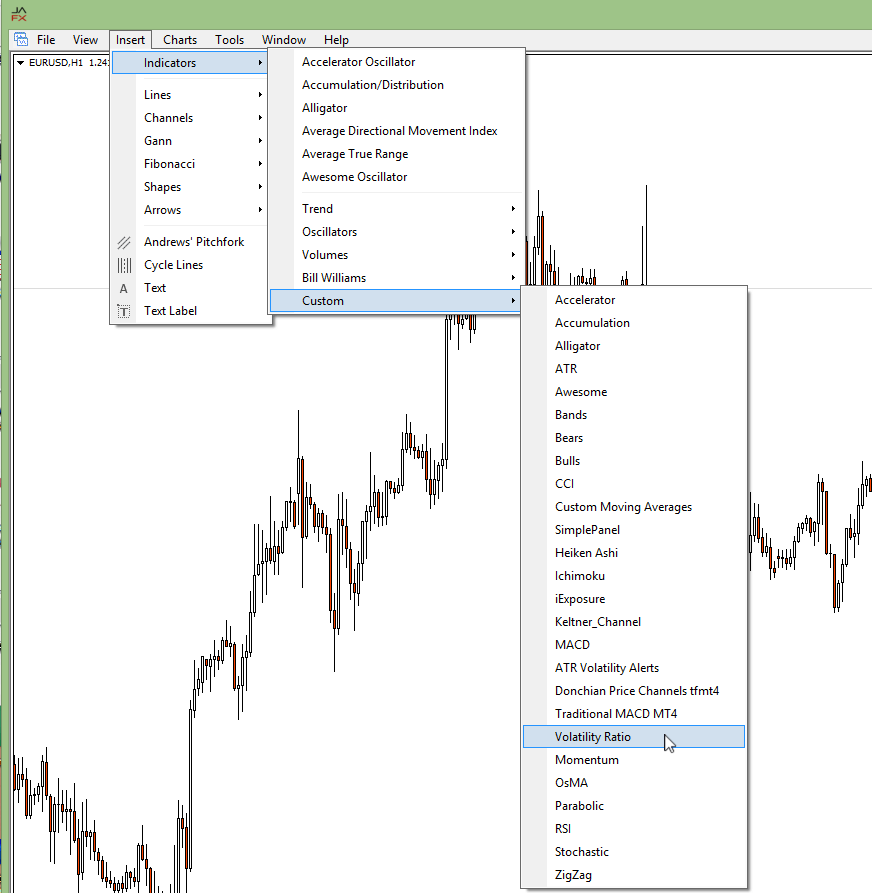
The Options window for this indicator allows you to toy with the parameter values, but I advise you to keep the default values and paper trade them, so you get the idea about how it works and how parameter changes may affect its effectiveness and the number of trade opportunities.

Finally, this is the type of chart annotations of this indicator:

 (click on the image to enlarge)