Categories
Forex Course

166. Introduction To Obscure Currency Crosses & Why It Is Very Risky To Trade Them?

Introduction

Trading currency crosses an excellent way to make money from forex trading when major currency pairs do not make a good move due to the US economy’s corrective momentum. However, the US dollar is a global reserve currency of every country. Therefore, it can provide enough liquidity to make money where the obscure currency crosses have some risks due to insufficient liquidity.

What is Obscure Currency Cross?

We can find currency crosses when we eliminate the US dollar from major and commodity currencies. However, among the cross currencies, the Euro and the Japanese Yen are mostly traded. Therefore, if you trade any Euro and Yen related cross pair, you might see the price to have adequate liquidity. But, what happens if the currency cross does not have Yen or Euro?

Any cross currency pairs that do not have Japanese Yen or Euro as a first or second currency is called an Obscure currency cross. Examples of obscure currency crosses are GBPCHF, NZDCAD, AUDCHF, CADCHF, NZDCHF, NZDCAD, etc.

Why are Trading Obscure Currency Crosses Risky?

The forex market is run through a decentralized network where no one can dominate any market. Therefore, the movement of a currency pair depends on the supply and demand of that currency pair. When the supply or demand increases, the currency pair starts to move. On the other hand, when there is less volume, the currency pair may move within a correction.

The liquidity remains lower in the obscure currency pair than major, commodity, and EUR/YEN related currency pairs. Therefore, there is a risk of market volatility and correction. In some cases, obscure currency pairs consolidate for a long time, and if we take any trade on that pair, we might have to hold the trade for a considerable time.

Conclusion

In conclusion, we can say that trading obscure currency pairs have some reason to worry due to not having enough liquidity to provide a decent movement. However, it is a great way to make money from obscure currency pairs if we can read the price action well and identify the price is moving within a trend. Overall, maintaining a profitable and robust trading strategy is the key to make a consistent profit from the forex market.

[wp_quiz id=”86520″]
Categories
Forex Basic Strategies

Exploring The Forex Market Opportunities With The Help of ‘Volume’

Introduction

In the Forex market, we don’t really have a centralised exchange as we’re trading over the counter. This is the reason why it is so difficult to determine exact trading volumes in Forex. Even though there is no centralised exchange to provide us with the volume data, many forex broker’s and trading platforms keep track of the average volumes in a pair. Each retail broker will have their own aggregate trading volume. Platforms like TradingView also have a volume attached to their chart. We all have realised over time that volume in the forex market is an important indicator, which is the reason why we need the best volume indicator.

The volume indicator used to read the volume in the forex market is the Chaikin Money Flow indicator (CMF.) The CMF was developed by Marc Chaikin, who is a trader himself, and was coached by the most successful institutional investors around the world. The reason Chaikin Money Flow (CMF) the best volume indicator is that is measures institutional accumulation and distribution.

Normally, on a rally, the Chaikin volume indicator should be below zero. Conversely, on sell-offs, the indicator should be below the ‘zero’ line.

Time Frame

The strategy works well on the 1-hour and 4-hour time frame only. Therefore, we can say that it is a swing trading strategy and is not suitable for trading intraday.

Indicators

We will be using just one indicator in this strategy, and that is the Chaikin Money Flow indicator (CMF.) The rest all is based on price action.

Currency Pairs

The strategy is suitable for trading in almost all currency pairs that are listed on the broker’s platform. But we need to make sure that the forex pair has enough trading volume.

Strategy Concept

Volume trading requires us to pay careful attention to the forces of demand and supply. Volume traders look for instances of increased buying or selling orders. They also pay attention to the current price movement and trend of the market. Generally, increased trading volume leans towards heavy buy orders. These positive volume trends will prompt us to open new positions on the ‘long’ side of the market, depending on the price action.

On the other hand, if trading volumes and cash flow decrease—it indicates a “bearish divergence. This may be appropriate to sell. We will pay attention to the relative volume—regardless of the number of transactions occurring in a trading period. By learning how to use the Chaikin money flow and other relevant indicators, we will be able to identify whether to ‘buy’ or ‘sell.’

With practice, the volume trading strategy can yield a win rate of 75%!

Trade Setup

In order to explain the strategy, we have considered the chart of EUR/USD, where we will be illustrating a ‘long’ trade using the rules of the strategy.

Step 1

Firstly, look for a price reversal in the market or a price action that reverses an established downtrend or uptrend. This is an easy and simple step that requires us to have a basic understanding of price reversal. This reversal should be accompanied by the rising Chaikin volume indicator that shoots up in a straight line from below zero to above the ‘zero’ line, during the reversal of a downtrend. In an uptrend, the slope should be downwards, i.e., from positive to negative.

When the volume indicator goes negative to positive in a strong fashion, it shows an accumulation of smart money.

Step 2

Wait for the price to pullback near the previous lower low after an upward reversal. Likewise, wait for the price to pullback near the previous higher high. The Volume Indicator should also pullback in a similar manner. If the pullback is coming in slowly, the trade has a higher probability of performing. If the pullback is strong, we will exercise some caution.

When the volume indicator is decreasing and drops below zero, we have to make sure that the price remains above the swing low. If the market is satisfying all the conditions of the strategy until now, we can move on to the next step.

Step 3

Wait for the Chaikin volume indicator to break back above the zero lines. We enter for a ‘buy’ once a ‘higher low’ is confirmed, and the price starts moving in the direction of the reversal. In a reversal of an uptrend, the Chaikin indicator should break below the ‘zero’ line. We enter for a ‘sell’ once a ‘lower high’ is confirmed, and the price starts moving lower. Once the institutional money comes back in the market, we wait for them to step back and drive the market.

The below image shows a ‘higher low’ being formed along with the volume breakout.

Step 4

This brings us to the next important step, where we establish protective stop-loss and take-profit for the strategy. We place stop-loss below the ‘higher low’ that confirmed the reversal when ‘long’ in the pair and above the ‘lower high ‘when ‘short’ in the currency pair. This strategy indicates a strong reversal in the market that will change the trend of the market. This is why we set our ‘take-profit’ at the origin of the previous trend.

In our example, the risk-to-reward of the trade was over 1:2, which is great.

Strategy Roundup

The volume trading strategy will continue to work in the future; it is based on the activities of the smart money. Even though they hide all their operations, their footprints are still visible. We can read those marks by using proper tools. The Chaikin indicator will add value to our trading because it gives a window into the volume activity the same way we traded the stocks. Make sure to follow this step-by-step guide to trade properly using volume.

Categories
Forex Market Analysis

Silver: Sustained Bullish Pressure

Silver advances over 3.14% this week, increasing its gains by the sixth week in a row. The precious metal could visit the $20 per ounce, the highest level since September 2016.

The Market Sentiment

Silver, in its weekly chart, reveals that institutional participants hold a bullish sentiment. The speculative positioning identified in green, taken from the Commitment of Traders report (CoT) issued each Friday by the CFTC, confirms that institutional traders hold its long positions expecting new higher highs. At the same time, both the COT report as the price action doesn’t reveal signals of a reversal trend.

On the other hand, the strong upward momentum that can be seen on the precious metal is driving it near its 52-week high located at $19.65 per ounce. This market context leads us to expect an increment in volatility on the metal sector, which could hit new highs.

The following daily chart reveals that Silver volume remains above the 250 trading sessions average. The relatively high volume level along with its price advancement confirms that the current uptrend remains intact.

The Elliott Wave Outlook

The Elliott wave perspective sketched in the following 12-hour chart exposes an incomplete bullish five-wave sequence, which could drive prices to exceed the $20 per ounce.

The precious metal started an incomplete bullish sequence last March 18th when the price found fresh buyers at $11.64 per ounce. Once Silver started its recovery, the market participants sent it into an internal five-wave rally to $15.84 per ounce, where it completed wave ((a)) of Minute degree labeled in black.

In the previous chart, we observe a narrow-range corrective sequence developed into a three-wave structural series that failed to achieve a new lower low. This market context warns us about the potential strong upward momentum that could drive Silver toward new higher highs. In fact, the price action reveals an incomplete fifth wave of Minuette degree labeled in blue, which remains in progress.

The RSI oscillator reveals a bearish divergence, which leads us to confirm that Silver currently moves in its fifth wave, possibly belonging to a wave ((c)) of Minute degree. In an alternative count sequence, Silver could be advancing in a wave ((3)) of Minute degree.

Considering the Elliott Wave rule of extensions, the current fifth wave could be the extended wave of the entire upward sequence. On the other hand, the Fibonacci projection suggests that the precious metal could extend its gains in a range from $20.04 to $21.66 per ounce.

Finally, as long as the price action continues advancing above the $18.47, the short-term trend will continue being led by the bull traders.

Categories
Forex Basic Strategies

Learning The Art Of Fading In Trading

What is Fading?

Fading involves placing trades against the trend to profit from a reversal. Using the concept of fading, a trader will short sell, expecting the momentum to fade when the market is in an uptrend. Likewise, he/she will buy a currency pair with the expectation that the move will fade away and reverse when the market is in a downtrend.

The fading strategy involves three assumptions:

  • The price is either at the overbought or oversold condition.
  • Early buyers or sellers are getting ready to take profits.
  • Current position holders might be at risk.

Overbought and oversold conditions can be identified using technical indicators such as the Relative Strength Index (RSI). Momentum shows the signs of shifting of forces from bulls to bears or vice-versa. And as these signs develop, current holders of the asset start to rethink their positions.

These conditions get exaggerated after an earnings announcement or news release. This may lead to a knee-jerk reaction on the part of other traders to sell the currency pair. As a result, this reaction gets overextended, and a mean-reversion takes place.

Now let us see how does the strategy work and what are the necessary steps you need to take to profit from the strategy:

The Fading strategy

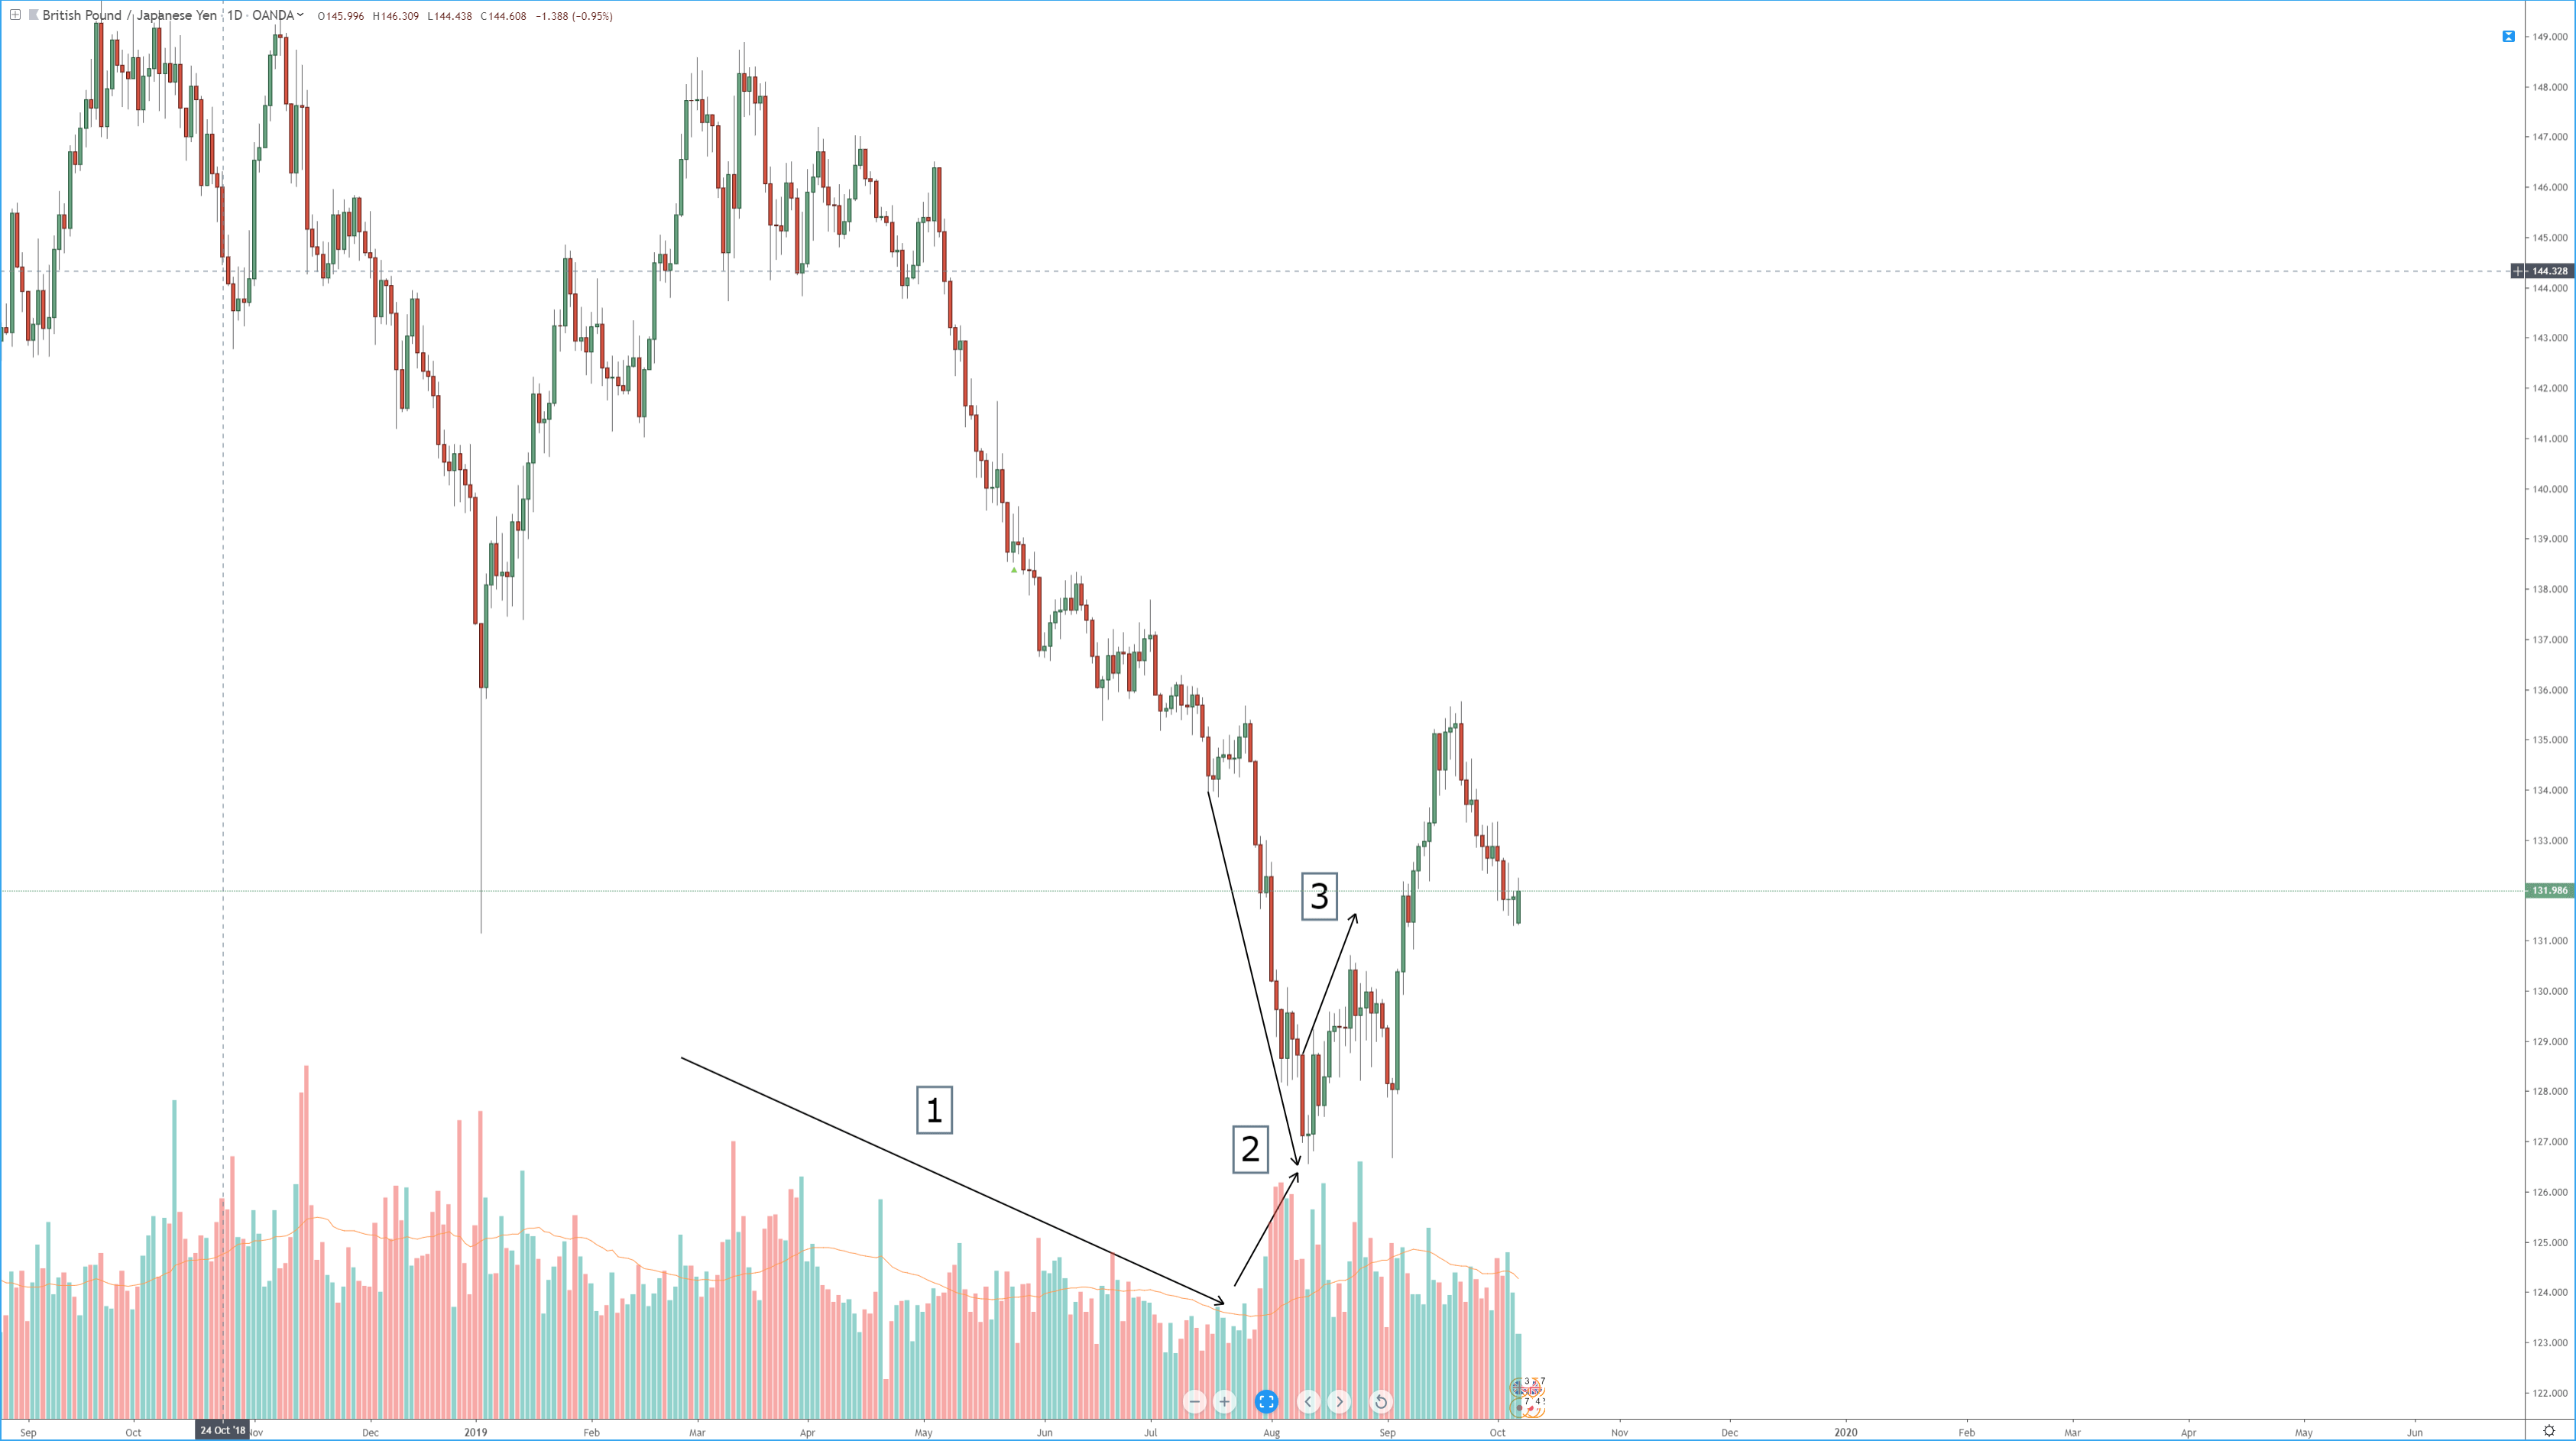
Step 1 – Identify market extremes from the daily time frame 

The first step is identifying overbought and oversold zones using technical indicators or chart patterns.

The popular indicators used for identifying the zones include:

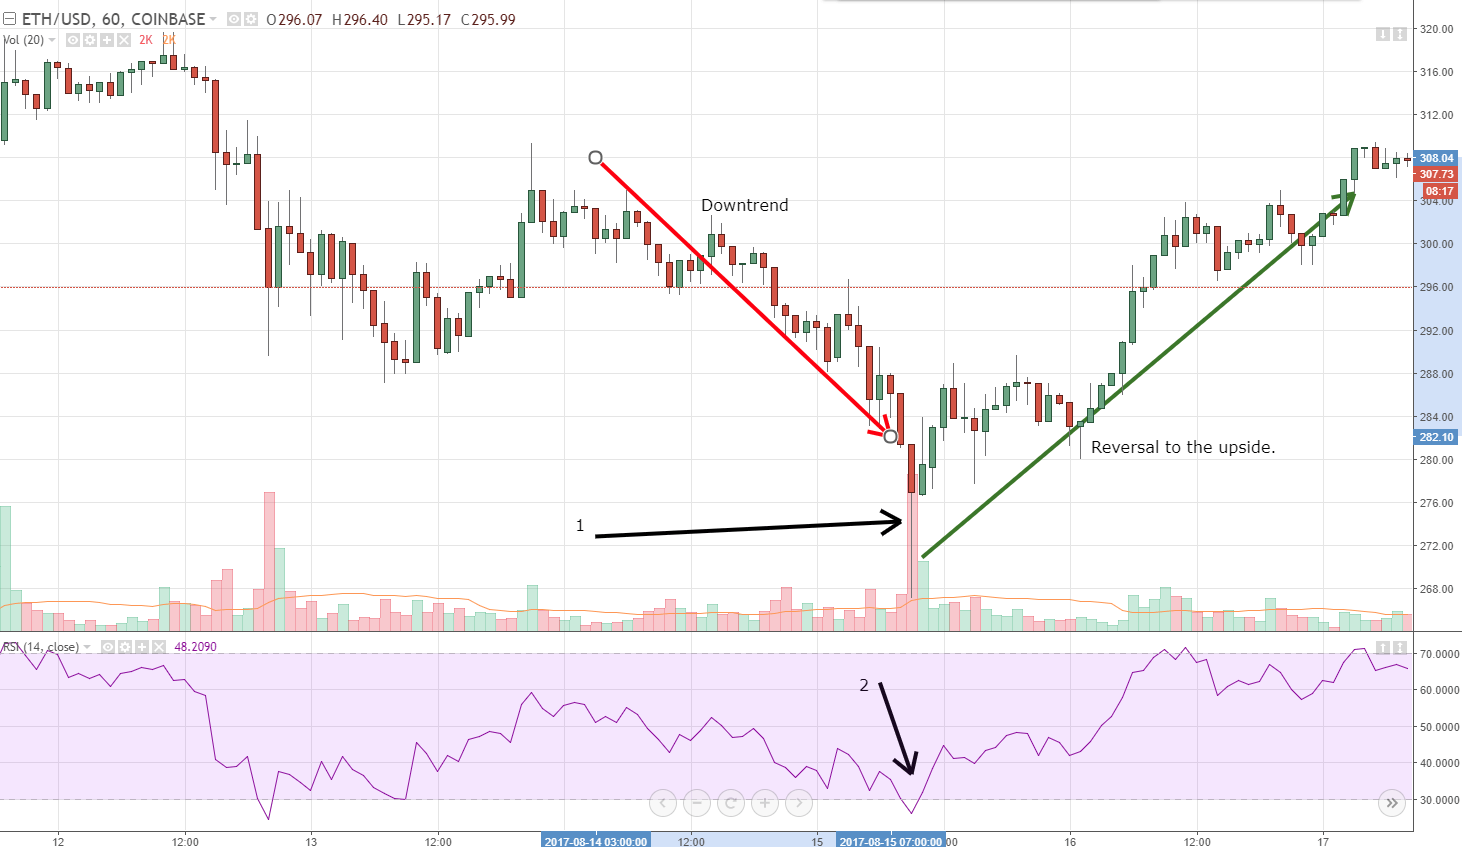
The overbought and oversold conditions are indicated by reading above or below a certain level. For example, the market is said to be in an overbought condition if the RSI is above 70, and it is said to be in oversold condition if the RSI is below 30. This can help traders in identifying fading opportunities.

In the above chart, we can see how the RSI indicator was crossing the normal range when the market gets into the overbought zone. One can find trading opportunities just using the RSI indicator stand-alone. But to trade like how professionals trade, we need to use a lot more tools.

Traders may also use familiar chart patterns or analysis based on price action and watching the price continuously.

Step 2 – Look for signs of capitulation

The second step in the strategy is to look for early signs of capitulation or change in the short-term trend using momentum. This can be mostly done by using candlestick patterns or price action with a volume indicator. We suggest looking for price action signals.

Some other signs to watch for include:

  • When technical indicators start to fade or move away from their extreme overbought or oversold levels.
  • The volume of the significant trend starts decreasing, or the volume of the opposite trend starts increasing.
  • Bearish candlestick patterns appear (in case of an uptrend), or critical support and resistance are broken.

It’s essential to identify these signs early to maximize profit and avoid mistakes.

The signs mentioned above can be explained better with the help of some figures.
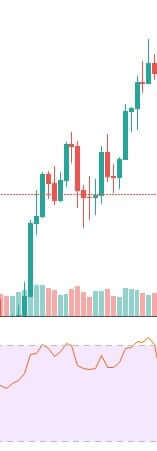
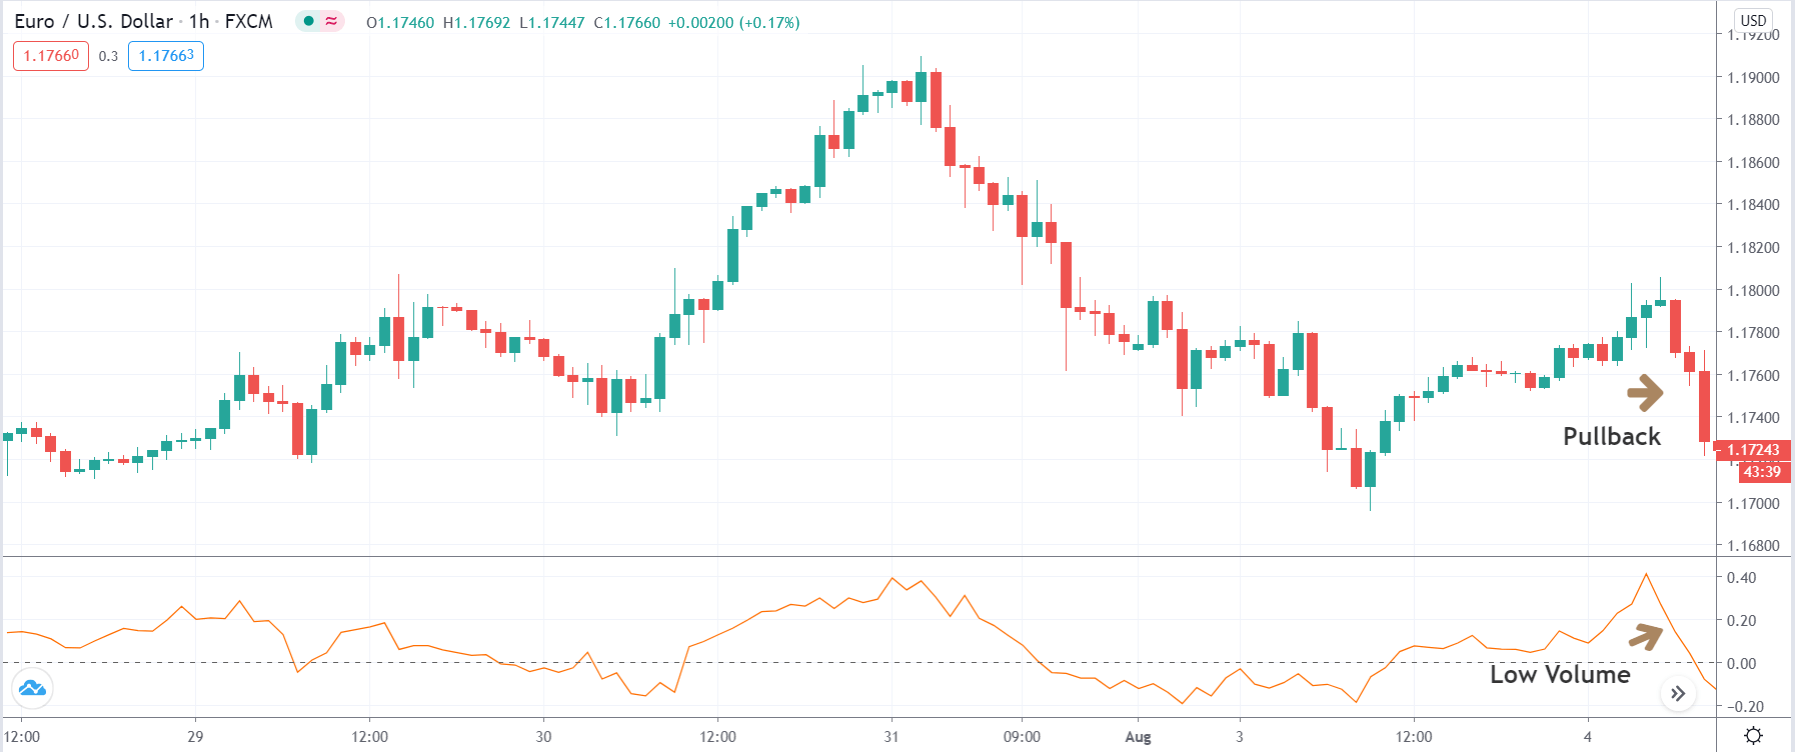
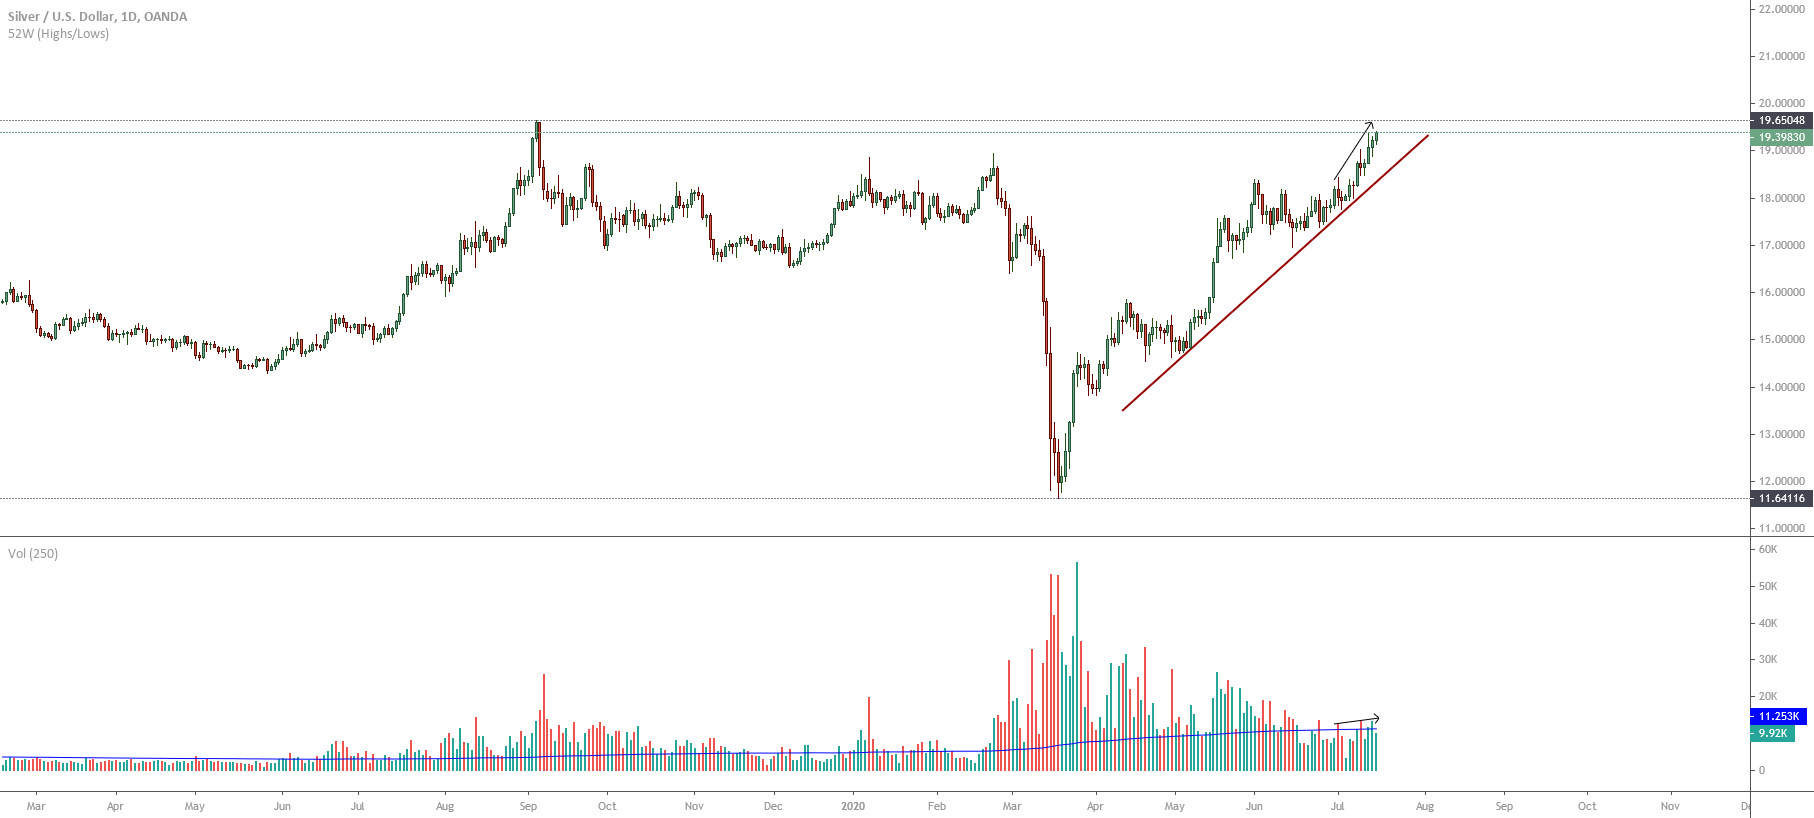
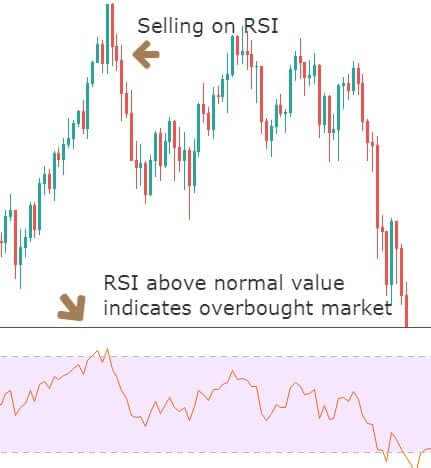
Image 1

In the above image, we clearly see that the market is in an uptrend and has been trending from a few days (as it is a daily chart). The volume of the significant trend is also high with the decreasing volume of the sellers, which is a good sign for bulls. But in the end, the volume starts to decrease. The RSI declines sharply after entering the overbought zone for a while.
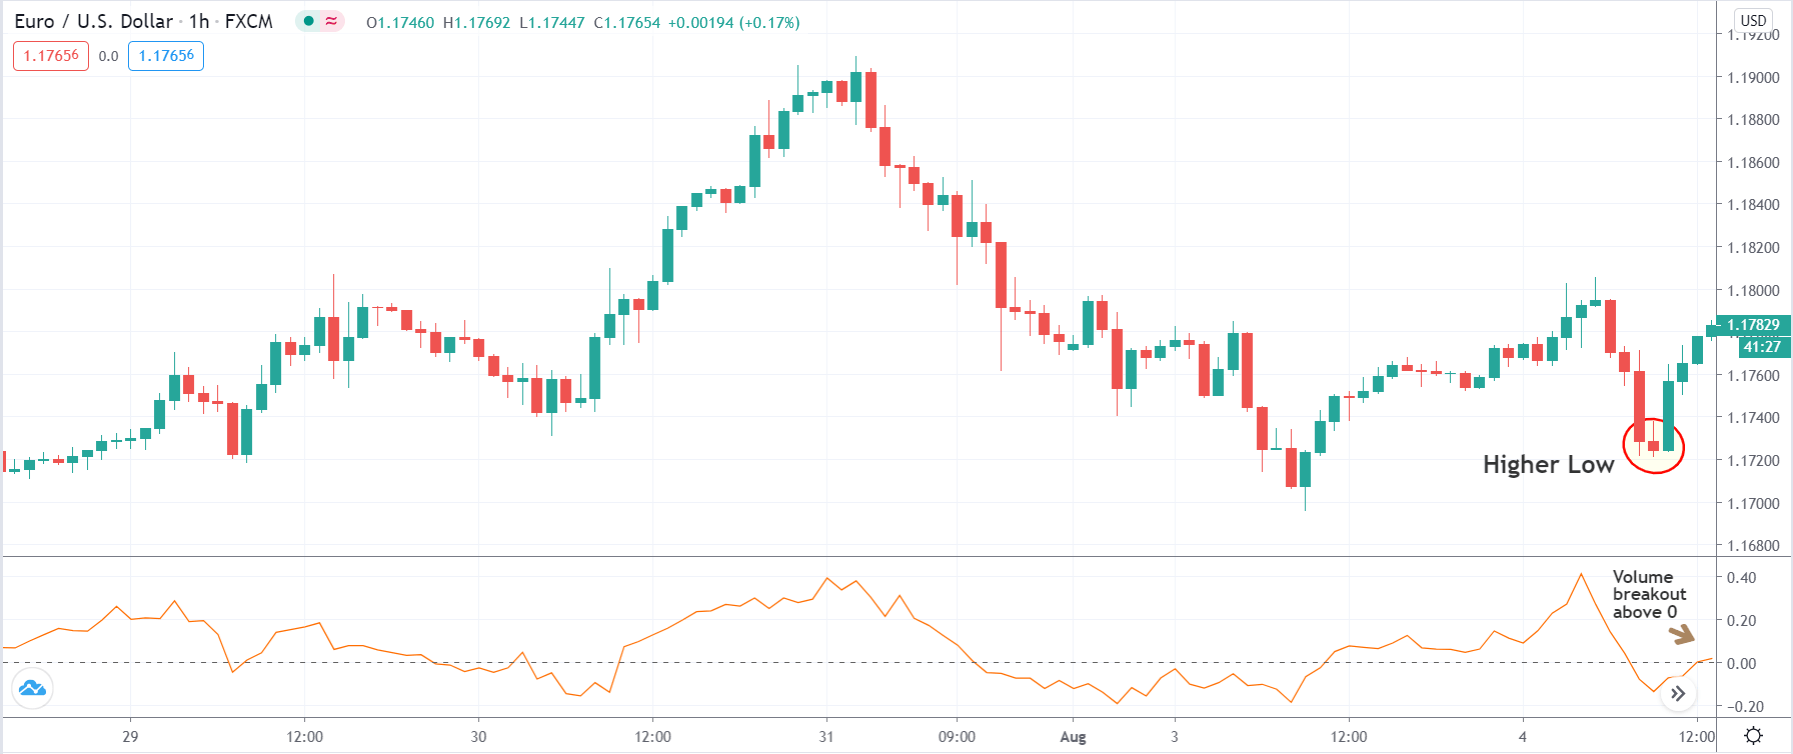
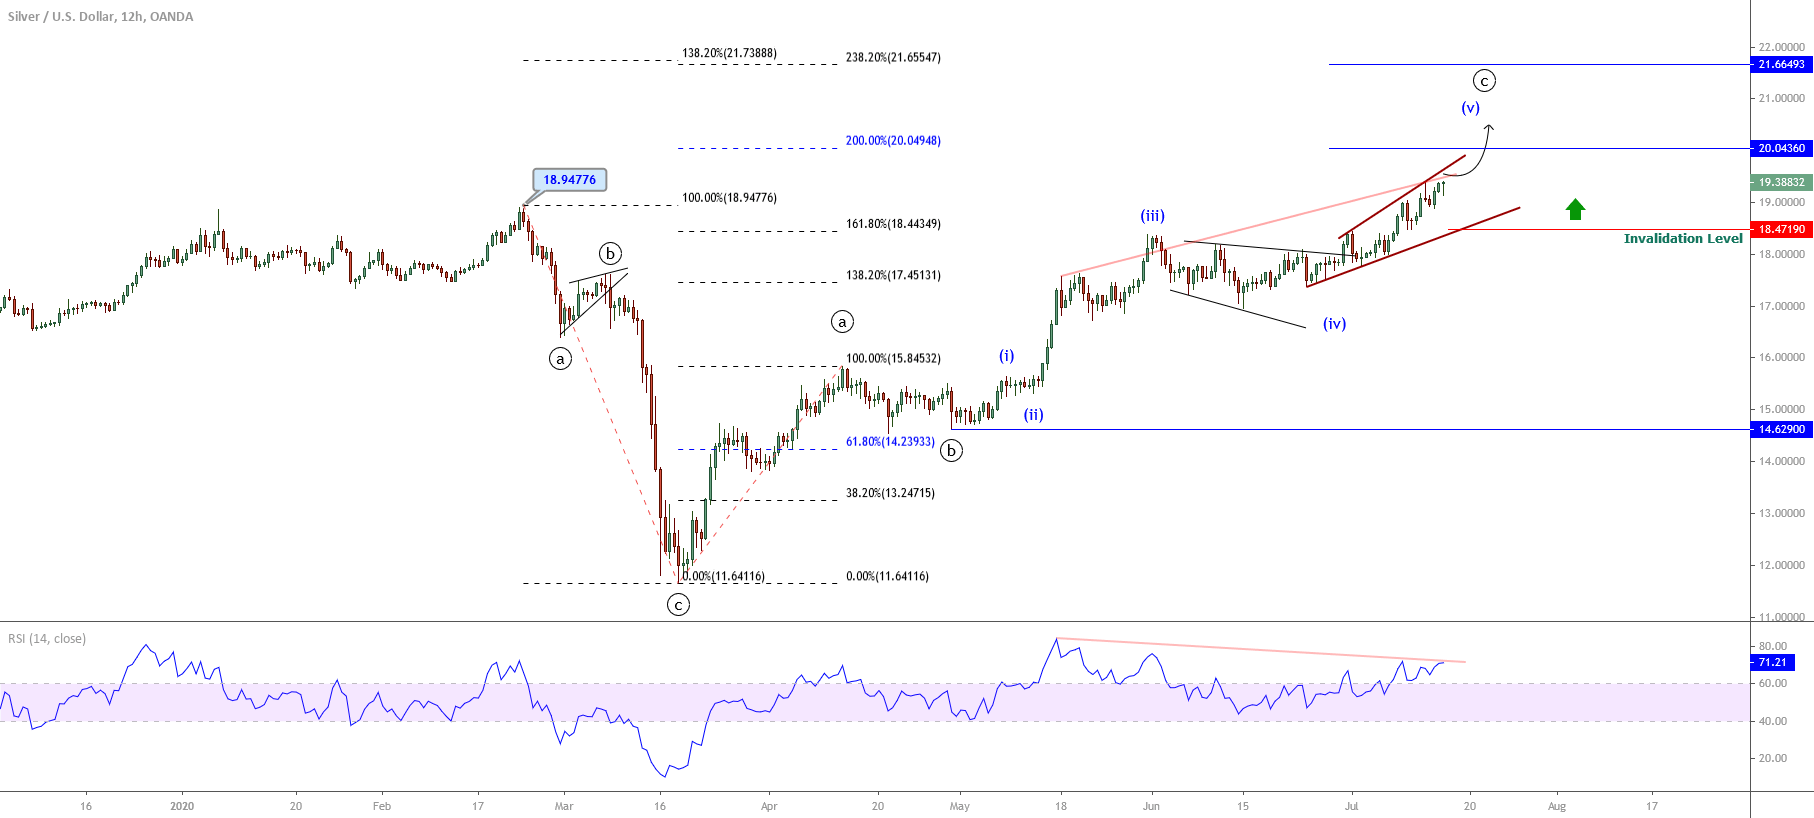
Image 2

Immediately we see an increase in the volume of sellers with a drastic drop in the RSI indicator (Image 2). The signs are getting stronger for a reversal, and this trend can continue. All the traders who are holding the currency pair start exiting the market. This could be one of the most reliable signs for us to take appropriate action.
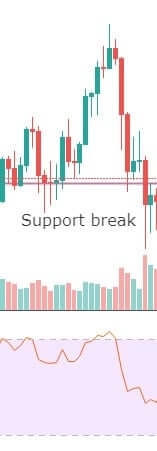
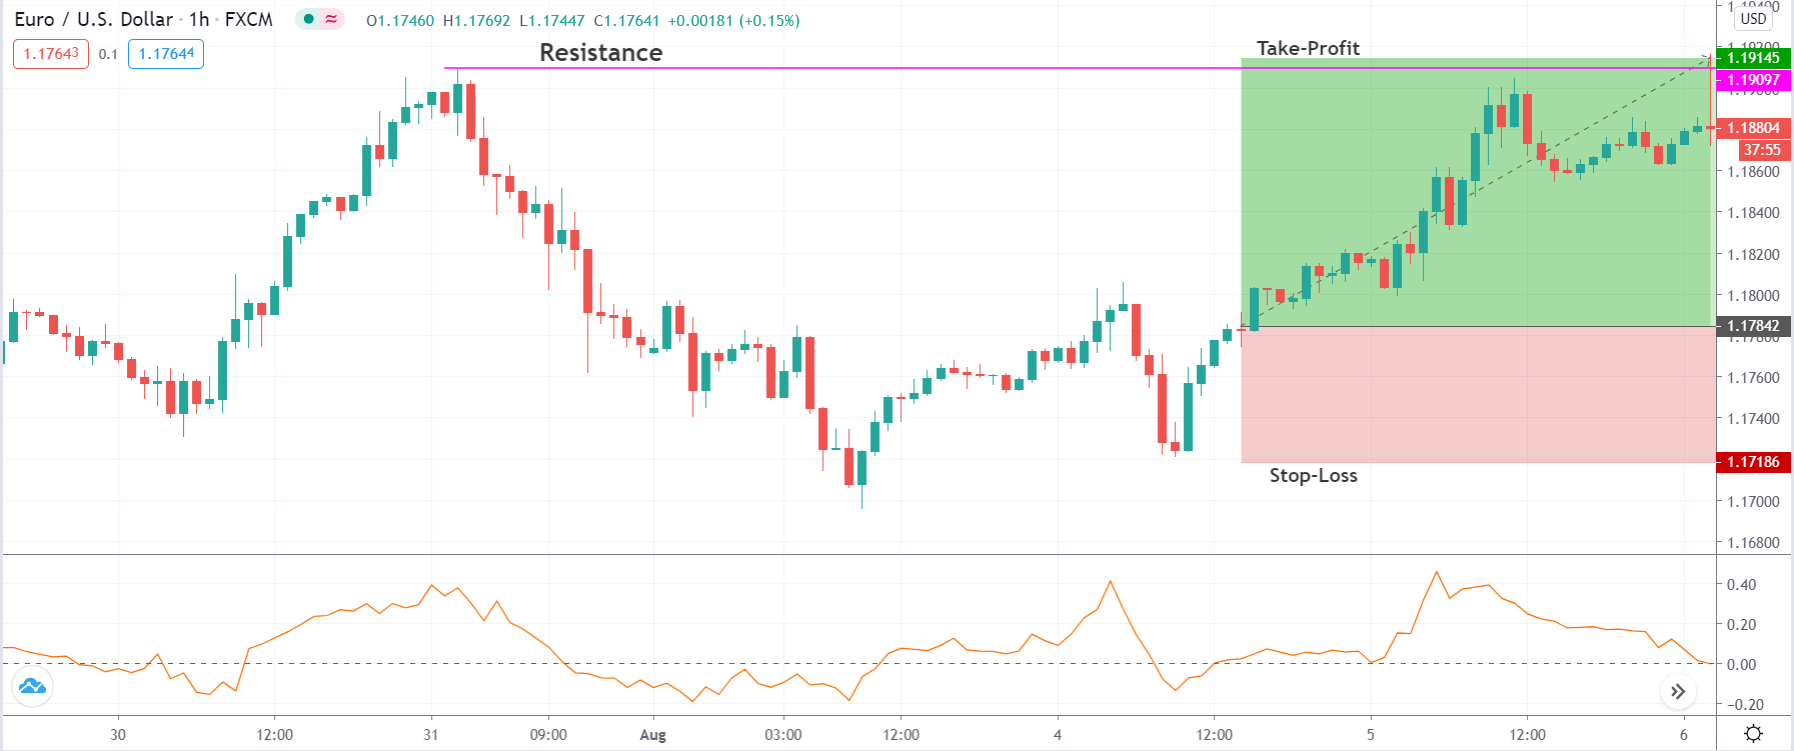
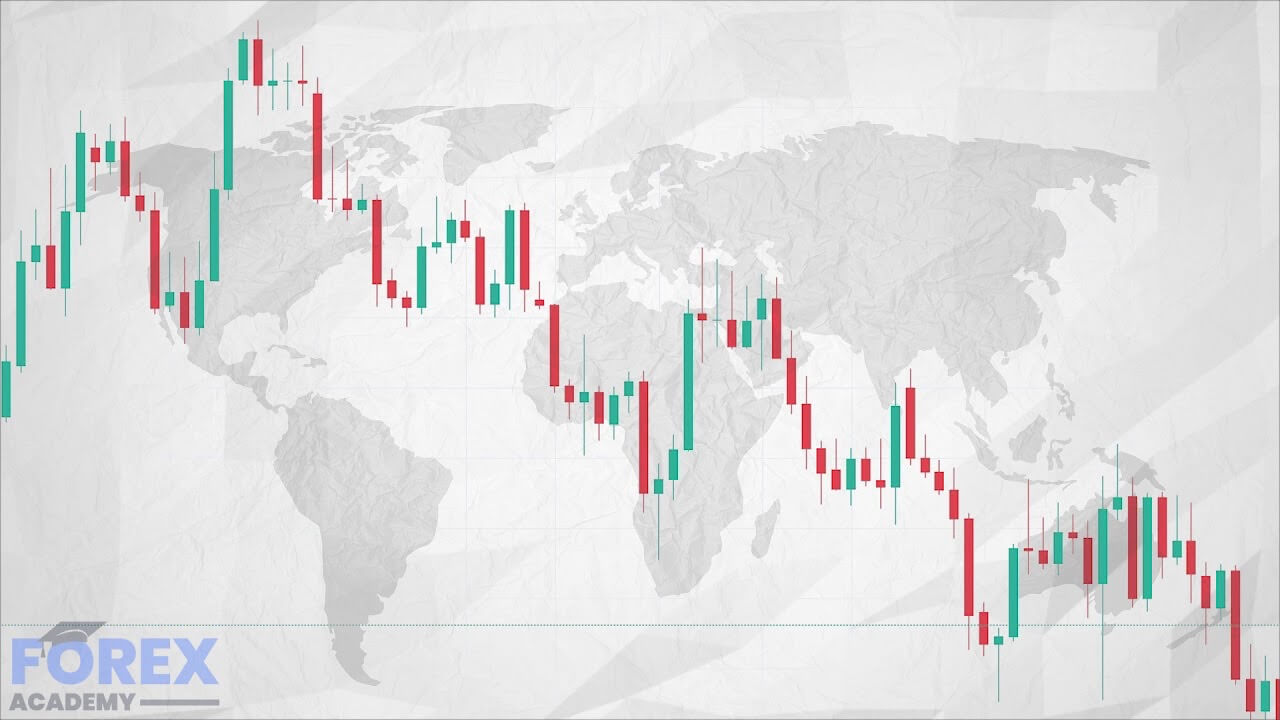
Image 3

Finally, we see a break in the ‘support’ by the bears with high volume. Now we have combined all the tools, and each of them is indicating a reversal. Hence, we should take a position in the opposite direction. This is precisely the kind of setup that you need to be looking for every time.
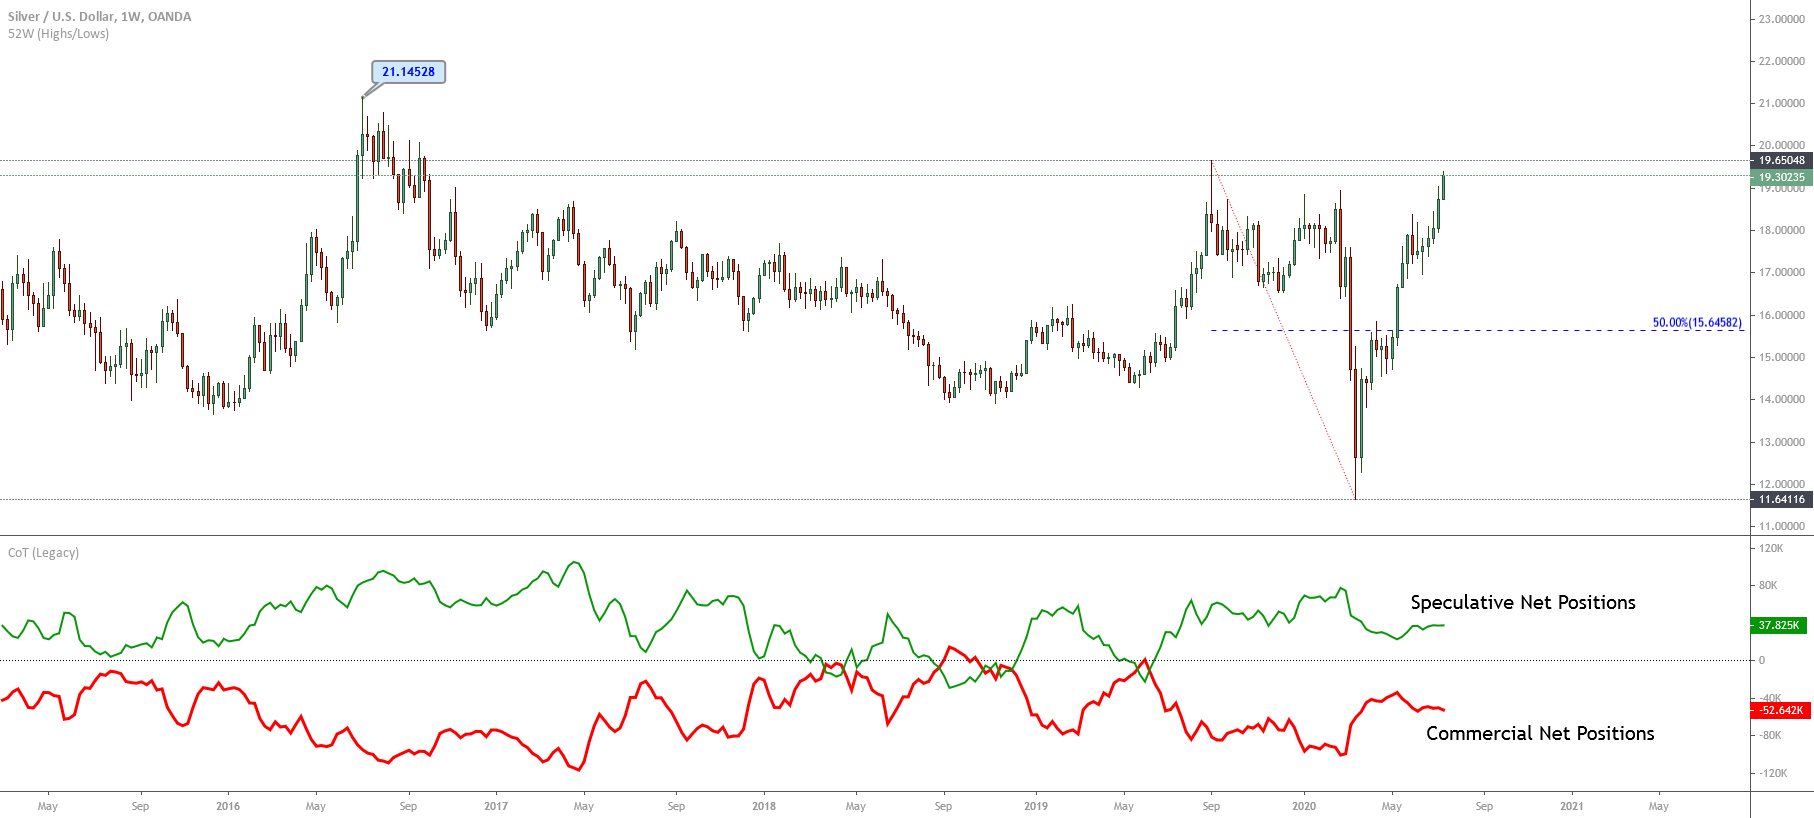
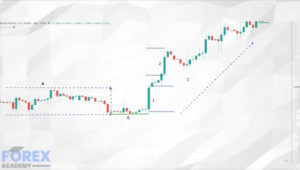
Image 4

In order to find the exact entry, we need to magnify the chart. For this, you need to go on a lower time frame to analyze and set your stop-loss or target based on that time frame. This is mandatory for getting precise entries. The above figure is the lower time frame chart of the explained example.

Note: Images 1, 2 & 3 belong to the daily timeframe, whereas Image 4 belongs to the 4H timeframe.

Step 3 – Enter the trade with a stop-loss and take-profit

The last step is to enter the market with a compulsory stop-loss and take profit to ensure risk management is in place. In this strategy, a stop-loss order can be placed above the price where the RSI enters the overbought/oversold zone. Avoid putting small stop-loss as you can prematurely get stopped out from the trade.

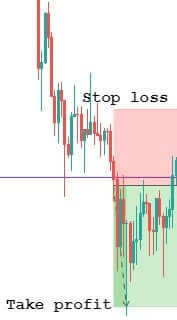
Profit can be booked when the volume of your trend starts to decrease. Now, the stop-loss and target would be placed, as shown in the above chart. This trade would result in a risk-to-reward ratio of a minimum of 1:5. Traders can also use a moving average or any other indicator to set a profit-taking price level. Limit orders are almost used by all traders to avoid any slippage or other issues, particularly in less liquid assets.

Bottom line

Fading strategies can be considered as risky as you are going against the trend. It is always a good idea to take a trade if the risk to reward ratio is favorable. These strategies are commonly used by short to medium term traders to capitalize on short term reversals. Even though it seems risky, it can be extremely profitable if appropriately used. This is because the market has reached a saturation state, and there has to be some balancing force. This is why fading strategies are also known as contrarian strategies. Because they work on the assumption that prices deviating far from the trend, tend to reverse and revert back. That’s about Art Of Fading. If you have any queries, let us know in the comments below. Cheers.

Categories
Forex Videos

Using Volume As A Form Of Technical Support – Forex Tips & Tricks

Using Volume As A Form Of Technical Support – Forex Tips & tricks

One of the problems for retail Forex traders is that there is no tool currently available that tells them how much volume – in terms of currency amount – floating around in the market at any given time. The Forex market is not like the stock market, where we can see amounts of stocks and shares being bought and sold. Although some brokers will tell you what percentage of the traders are either long or short on a currency pair, it doesn’t give you the whole of market volume. And because there are so many market makers and so many brokers out there, it is impossible to determine the amount of volume – in terms of currency – in the market at any given time.

Therefore traders have to use their technical analysis to establish when volume is high and low in the market. One of the best ways to establish volume is to look at the size of Japanese candlesticks. For example, the longer the candlestick – and especially those which have very short wicks at either end – usually means a large volume of currencies are being simultaneously bought and sold, pertaining to the particular pair a trader is focused on.
Logically, the times when traders are more likely to see large volumes going through in a pair is likely to be around the times of economic data releases, in particular, those relating to GDP, interest rate decisions, employment, imports and exports, and manufacturing.

We might expect to see smaller candlesticks and, therefore, smaller amounts of volume in a pair in areas of price congestion, price consolidation, and also quiet times in the market, such as time zone overspills.

Let’s look at the example ‘A’

This is a 4-hour chart of the GBPUSD pair, also known as Cable. We have split the price action in this period into three sections marked, ‘A,’ ‘B’ and ‘C.’ In area ‘A,’ price action has gravitated to the bottom, which is a key level of support at the 1.22 exchange rate. This is technically a period of consolidation and sideways trading because no trend has been allowed to develop to the upside or downside. Let’s now turn our attention to the area ‘B,’ where the candlesticks are very small and where price action is merely fluctuating around the 1.22 to level. The candlesticks are very small, and this can only mean one thing: that volume is thin in this area. Now let’s take a look at area ‘C.’ We have marked the first candlestick as number 1 and where price action has accelerated away from the 1.22 level to just above the 1.24 level; again, this is a key level. We also note that there are small wicks at either end of the candlestick. This candlestick has also taken out or engulfed the preceding candlesticks in areas A and B. This is a strong move to the upside, and was a lot of volume has gone through during this 4 hour our time frame. Candlestick number 2 is also a large candlestick, although it does have a small wick at the top denoting a decrease in volume towards the end of that period. The strong push higher with candlestick 1 and 2 confirms large volume, which kicked off what turned out to be the beginning of a trend higher in this pair.
Traders need to be mindful of potential areas of support and resistance while factoring in economic data releases, which could subsequently reverse or cause a continuation of a trend in price action.

Useful tools to be able to gauge support and resistance during technical analysis are; Fibonacci retracement, stochastic overbought and oversold, and being mindful of possible Elliott waves forming.
One key area to focus on in order to fully understand volume in the markets is an understanding of the psyche of institutional traders.

Let’s imagine that an institutional trader comes to his or her desk at 7 AM in the morning, bright and breezy, and looking for the earliest opportunity to make money for their investment firm.
Now, this guy or girl may be on a salary of over €/£/$100.000, for example, and also gets a big fat annual bonus cheque. This puts them lots of pressure to make money.
Therefore at the beginning of each session, whether it be the USA, Asia, Europe, or the United Kingdom sessions, you will find that volatility usually picks then. Therefore Forex Traders, we need to be mindful that volatility equals volume, and the greater the volume, the greater the risk of larger swings in price action.


Categories
Forex Course

5. How Large & Liquid Is The Forex Market?

When compared to other markets like the stock and commodity market, the foreign exchange market is the largest in the world in terms of size and liquidity. In this lesson, we shall go over some insights on the size and liquidity of the forex market.

Where is the Forex market headquartered?

The stock markets across the world have different central exchanges where all the transactions are processed. But, in the case of the forex market, there is no central exchange (physical counter) where the transactions can be processed. In fact, this market runs electronically, connected by a network of banks. This, in short, is called an interbank market or an over-the-counter (OTC) market. Hence, this enables traders to trade in the forex market from anywhere in the world. Also, this is one of the reasons for its high volume of trading.

Forex market’s volume

The amount of money traded in the forex market is humongous. Being the most traded market, the value of it reaches up to $3 trillion. The number is made up of all the types of transactions performed in the market. The amount of different transactions is listed as follows:

$1,005 billion comes from spot transactions

$1,714 billion is added from forex swaps

$362 billion accounts for outright forwards

$129 billion for estimated gaps

Currency distribution in the Forex market

There are about seven currencies on which most transactions take place. Out of these currencies, the US Dollar dominates with around 85% of all the operations in the forex market. Next up in the line stands EUR, which is then followed by JPY and GBP. A graphical representation for the same is given below.

Here, the sum of all the variables totals to 200%, as currencies are traded in pairs.

What are the Foreign Exchange Reserves?

They are the assets that comprise banknotes, bonds, deposits, etc. The central bank of a country holds these with two primary purposes. One to maintain the balance payments of a country and the second is to control the confidence in financial markets. These reserves can be held in more than one currency.

According to the International Monetary Fund (IMF), 64% of the world’s forex reserves are made up of the US Dollar. And after USD comes GBP, JPY, and EUR comprising of 4%, 4%, and 2% of the world’s FX reserves, respectively.

Liquidity of the Forex market

Liquidity is simply the possibility to square off a position smooth and quick without causing the market to make a drastic move. In simple terms, liquidity is the level of supply and demand in the market. So, when there are large numbers of buyers and sellers in the market, we can call this market to be highly liquid.

With respect to the Forex market, it is the most liquid market in the world. This implies that the forex market constitutes a large number of participants (buyers and sellers). With high liquidity, one can liquidate their positions much faster and at their quoted price. Moreover, high liquidity causes the prices to move smoothly, gradually, and in small steps. Hence, this even leads to more consistency in the quoting of prices.

Below is the chart of EUR/USD on the 5-minute timeframe. We can see that the prices move smoothly in spite of being in a small timeframe.

Below is the chart of a small-cap stock in the US. Here, we can see that the prices are not moving in a flow, and there are gaps between the prices. And this is solely due to the lack of liquidity in the market.

That’s about the liquidity of the Forex market. We hope you had a good read. Check your learnings by answering the below quiz.

[wp_quiz id=”42489″]
Categories
Beginners Forex Education Forex Indicators

How to Properly Interpret Volume

Volume

Historically, and this is especially true in traditional equity markets, volume is often the most important indicator out there. Some people argue that volume is not overly reliable in forex markets. There is a significant debate on whether volume should be considered as important in forex markets as it is in equity markets due to the drastic differences in the amount of volume from one broker to another. Others believe that it is already (we can see volume from many of the exchanges). For the stock market and futures and almost any traded instrument, volume tells you what people are doing. And what they are not doing.

Volume helps you spot reversals and can tell you if the reversal candlestick is a ‘true’ candlestick. For example, in the image below, the hammer candlestick forms at or near the end of a downtrend. However, this candlestick (and those before it) should have increased and above-average volume. A hammer candlestick on high volume in a downtrend can be a great signal when you accompany it with another indicator, like the RSI.

Look at number one. The arrow is pointing to a very large hammer candlestick; the volume column is massive and definitely above the average volume (orange line average volume). If we look at the RSI, it is oversold. Those can be great conditions for going long!

Candlestick Principles with Volume

Volume is an extremely important component of any candlestick. A candlestick tells us what happened to move price in that period, but volume tells us how hard people fought for that movement and how much conviction was in that move. Here are some principles about candlesticks to keep in mind.

  1. The length of any wick, either the top or the bottom, is ALWAYS the first point of focus because it instantly reveals strength, weakness, indecision, and (more importantly) market sentiment.
  2. If no wick, then that signals strong market sentiment in the direction of the closing price.
  3. A narrow-body indicates weak sentiment. A wide-body represents strong sentiment.
  4. A candle of the same type will have a completely different meaning depending on where it appears in a price trend.
  5. Volume often validates price – Any candlestick that closes at or near an important high or low should be watched very closely for how much volume was involved.


High volume near highs and lows

Volume can give a clear, early warning that a current trend (long term or short term) may be coming to an end. If you observe price moving lower, but volume starts to increase and become greater than a 20 to 30-period average, then you may be looking at the bottom of a move. In other words, the market may reverse and become bullish. Observe the chart below:

  1. Price is declining as the price is dropping. That is a clear sign that no one is interested in buying or supporting higher prices.
  2. As prices have continued to make new lows, notice how the volume begins to spike higher – well above the most recent candlesticks volume.
  3. This increase in volume indicates more participation and is generally a combination of new entrants going long (buying), and those current traders who are short, have to cover and convert to long. That volume becomes a powerful variable that reverses the price action.

Key Points

  1. Look to see if the current chart is showing new and important highs or lows.
  2. If new highs or lows are present, observe the volume indicator. If it is rising, then that can mean the current price action may reverse.