Using Volume As A Form Of Technical Support – Forex Tips & tricks
One of the problems for retail Forex traders is that there is no tool currently available that tells them how much volume – in terms of currency amount – floating around in the market at any given time. The Forex market is not like the stock market, where we can see amounts of stocks and shares being bought and sold. Although some brokers will tell you what percentage of the traders are either long or short on a currency pair, it doesn’t give you the whole of market volume. And because there are so many market makers and so many brokers out there, it is impossible to determine the amount of volume – in terms of currency – in the market at any given time.
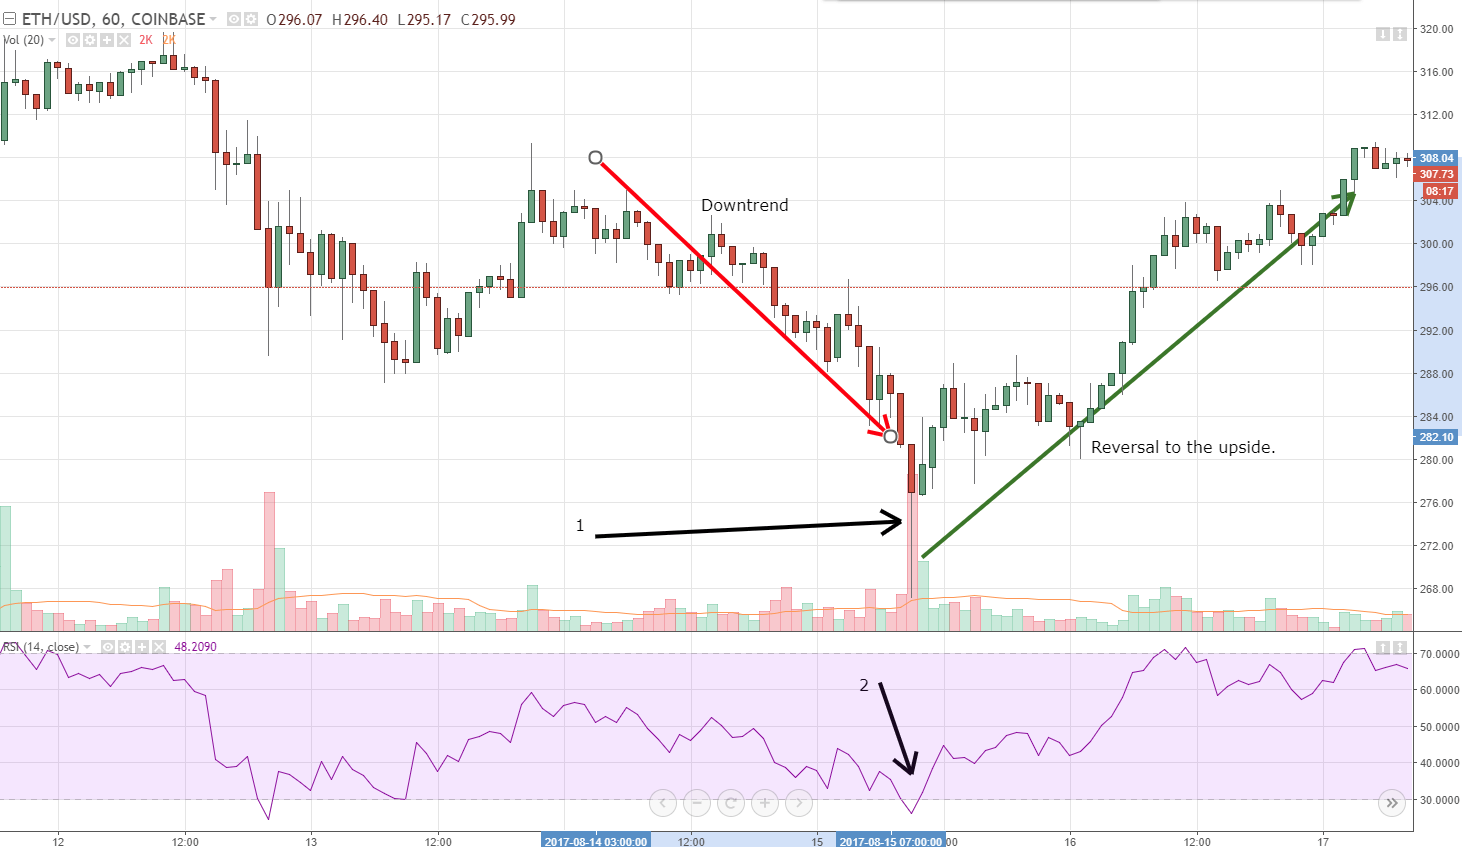
Therefore traders have to use their technical analysis to establish when volume is high and low in the market. One of the best ways to establish volume is to look at the size of Japanese candlesticks. For example, the longer the candlestick – and especially those which have very short wicks at either end – usually means a large volume of currencies are being simultaneously bought and sold, pertaining to the particular pair a trader is focused on.
Logically, the times when traders are more likely to see large volumes going through in a pair is likely to be around the times of economic data releases, in particular, those relating to GDP, interest rate decisions, employment, imports and exports, and manufacturing.
We might expect to see smaller candlesticks and, therefore, smaller amounts of volume in a pair in areas of price congestion, price consolidation, and also quiet times in the market, such as time zone overspills.
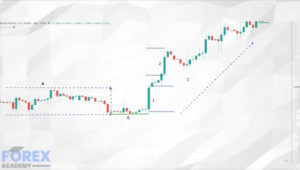
Let’s look at the example ‘A’
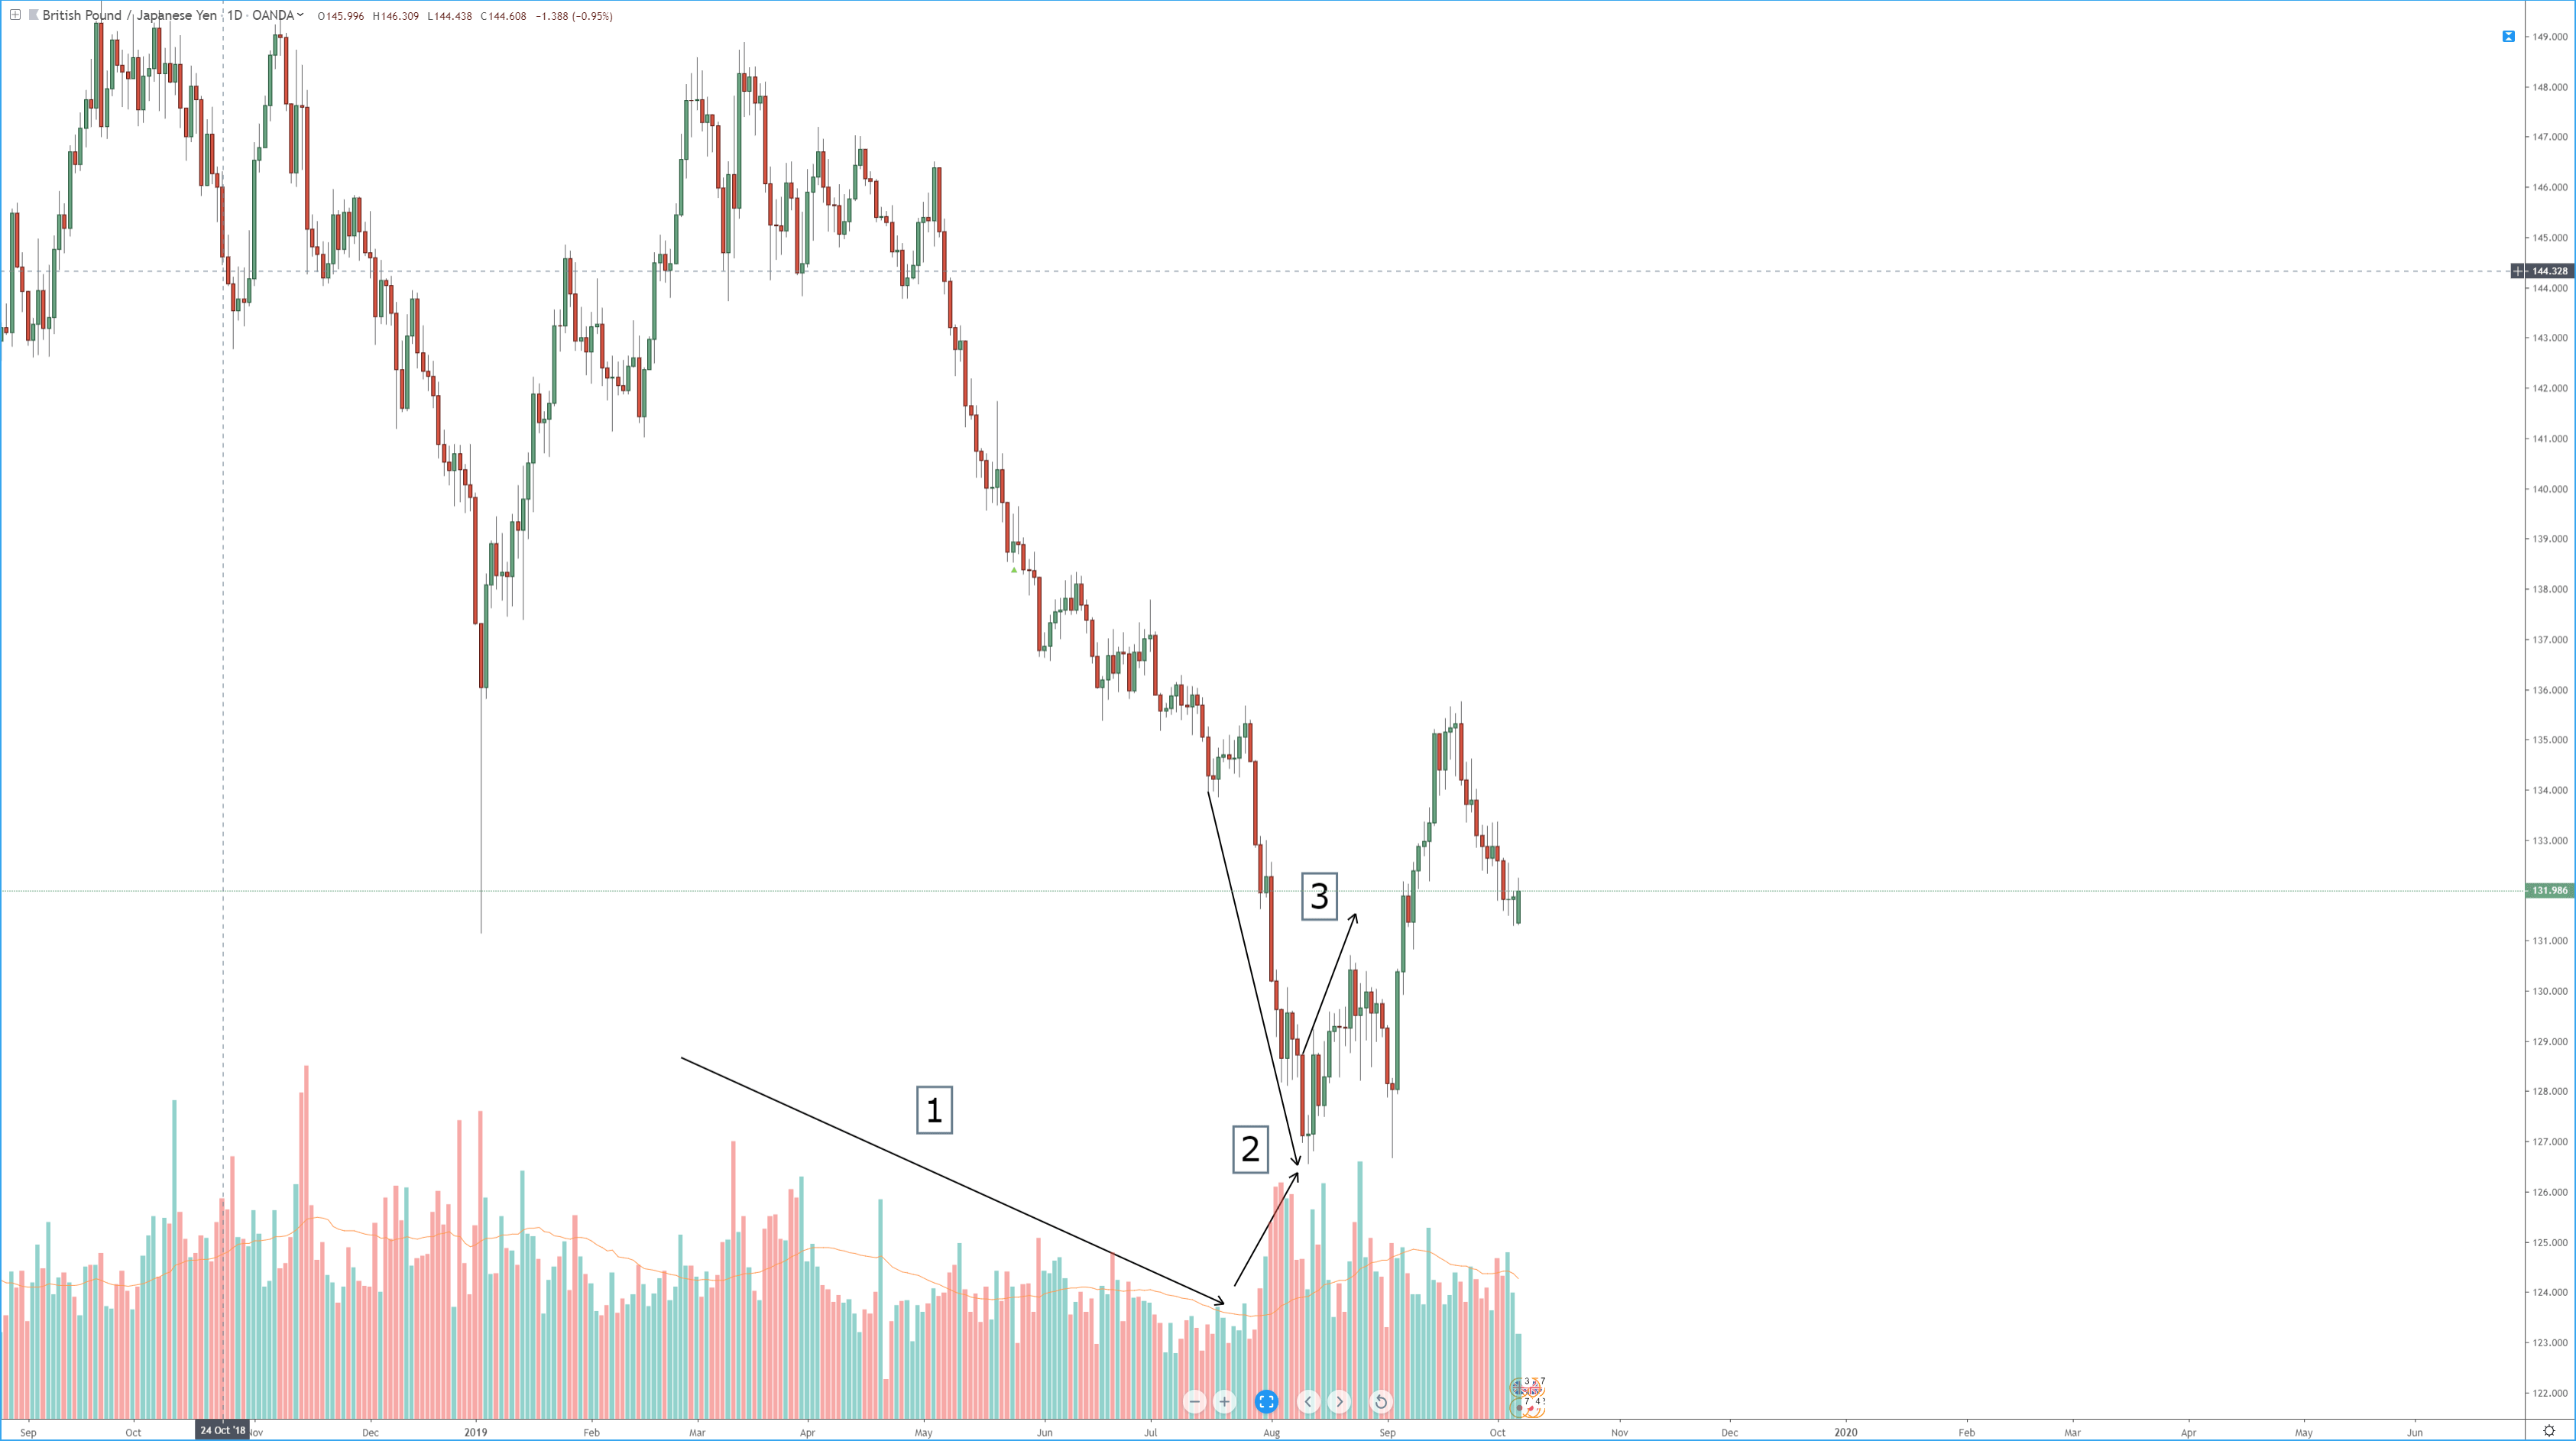
This is a 4-hour chart of the GBPUSD pair, also known as Cable. We have split the price action in this period into three sections marked, ‘A,’ ‘B’ and ‘C.’ In area ‘A,’ price action has gravitated to the bottom, which is a key level of support at the 1.22 exchange rate. This is technically a period of consolidation and sideways trading because no trend has been allowed to develop to the upside or downside. Let’s now turn our attention to the area ‘B,’ where the candlesticks are very small and where price action is merely fluctuating around the 1.22 to level. The candlesticks are very small, and this can only mean one thing: that volume is thin in this area. Now let’s take a look at area ‘C.’ We have marked the first candlestick as number 1 and where price action has accelerated away from the 1.22 level to just above the 1.24 level; again, this is a key level. We also note that there are small wicks at either end of the candlestick. This candlestick has also taken out or engulfed the preceding candlesticks in areas A and B. This is a strong move to the upside, and was a lot of volume has gone through during this 4 hour our time frame. Candlestick number 2 is also a large candlestick, although it does have a small wick at the top denoting a decrease in volume towards the end of that period. The strong push higher with candlestick 1 and 2 confirms large volume, which kicked off what turned out to be the beginning of a trend higher in this pair.
Traders need to be mindful of potential areas of support and resistance while factoring in economic data releases, which could subsequently reverse or cause a continuation of a trend in price action.
Useful tools to be able to gauge support and resistance during technical analysis are; Fibonacci retracement, stochastic overbought and oversold, and being mindful of possible Elliott waves forming.
One key area to focus on in order to fully understand volume in the markets is an understanding of the psyche of institutional traders.
Let’s imagine that an institutional trader comes to his or her desk at 7 AM in the morning, bright and breezy, and looking for the earliest opportunity to make money for their investment firm.
Now, this guy or girl may be on a salary of over €/£/$100.000, for example, and also gets a big fat annual bonus cheque. This puts them lots of pressure to make money.
Therefore at the beginning of each session, whether it be the USA, Asia, Europe, or the United Kingdom sessions, you will find that volatility usually picks then. Therefore Forex Traders, we need to be mindful that volatility equals volume, and the greater the volume, the greater the risk of larger swings in price action.