Volume
Historically, and this is especially true in traditional equity markets, volume is often the most important indicator out there. Some people argue that volume is not overly reliable in forex markets. There is a significant debate on whether volume should be considered as important in forex markets as it is in equity markets due to the drastic differences in the amount of volume from one broker to another. Others believe that it is already (we can see volume from many of the exchanges). For the stock market and futures and almost any traded instrument, volume tells you what people are doing. And what they are not doing.
Volume helps you spot reversals and can tell you if the reversal candlestick is a ‘true’ candlestick. For example, in the image below, the hammer candlestick forms at or near the end of a downtrend. However, this candlestick (and those before it) should have increased and above-average volume. A hammer candlestick on high volume in a downtrend can be a great signal when you accompany it with another indicator, like the RSI.
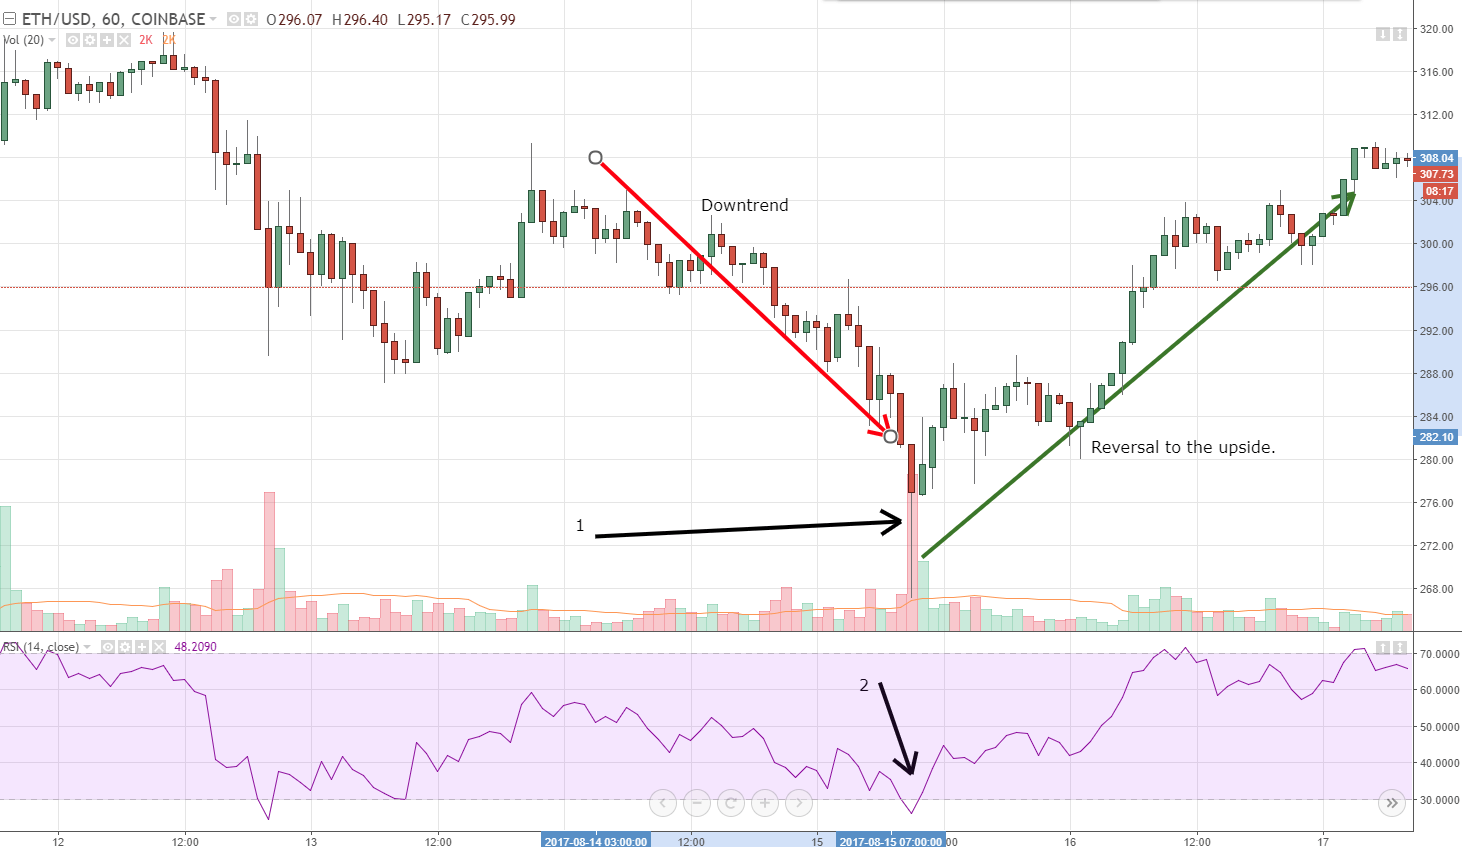
Look at number one. The arrow is pointing to a very large hammer candlestick; the volume column is massive and definitely above the average volume (orange line average volume). If we look at the RSI, it is oversold. Those can be great conditions for going long!
Candlestick Principles with Volume
Volume is an extremely important component of any candlestick. A candlestick tells us what happened to move price in that period, but volume tells us how hard people fought for that movement and how much conviction was in that move. Here are some principles about candlesticks to keep in mind.
- The length of any wick, either the top or the bottom, is ALWAYS the first point of focus because it instantly reveals strength, weakness, indecision, and (more importantly) market sentiment.
- If no wick, then that signals strong market sentiment in the direction of the closing price.
- A narrow-body indicates weak sentiment. A wide-body represents strong sentiment.
- A candle of the same type will have a completely different meaning depending on where it appears in a price trend.
- Volume often validates price – Any candlestick that closes at or near an important high or low should be watched very closely for how much volume was involved.
High volume near highs and lows
Volume can give a clear, early warning that a current trend (long term or short term) may be coming to an end. If you observe price moving lower, but volume starts to increase and become greater than a 20 to 30-period average, then you may be looking at the bottom of a move. In other words, the market may reverse and become bullish. Observe the chart below:
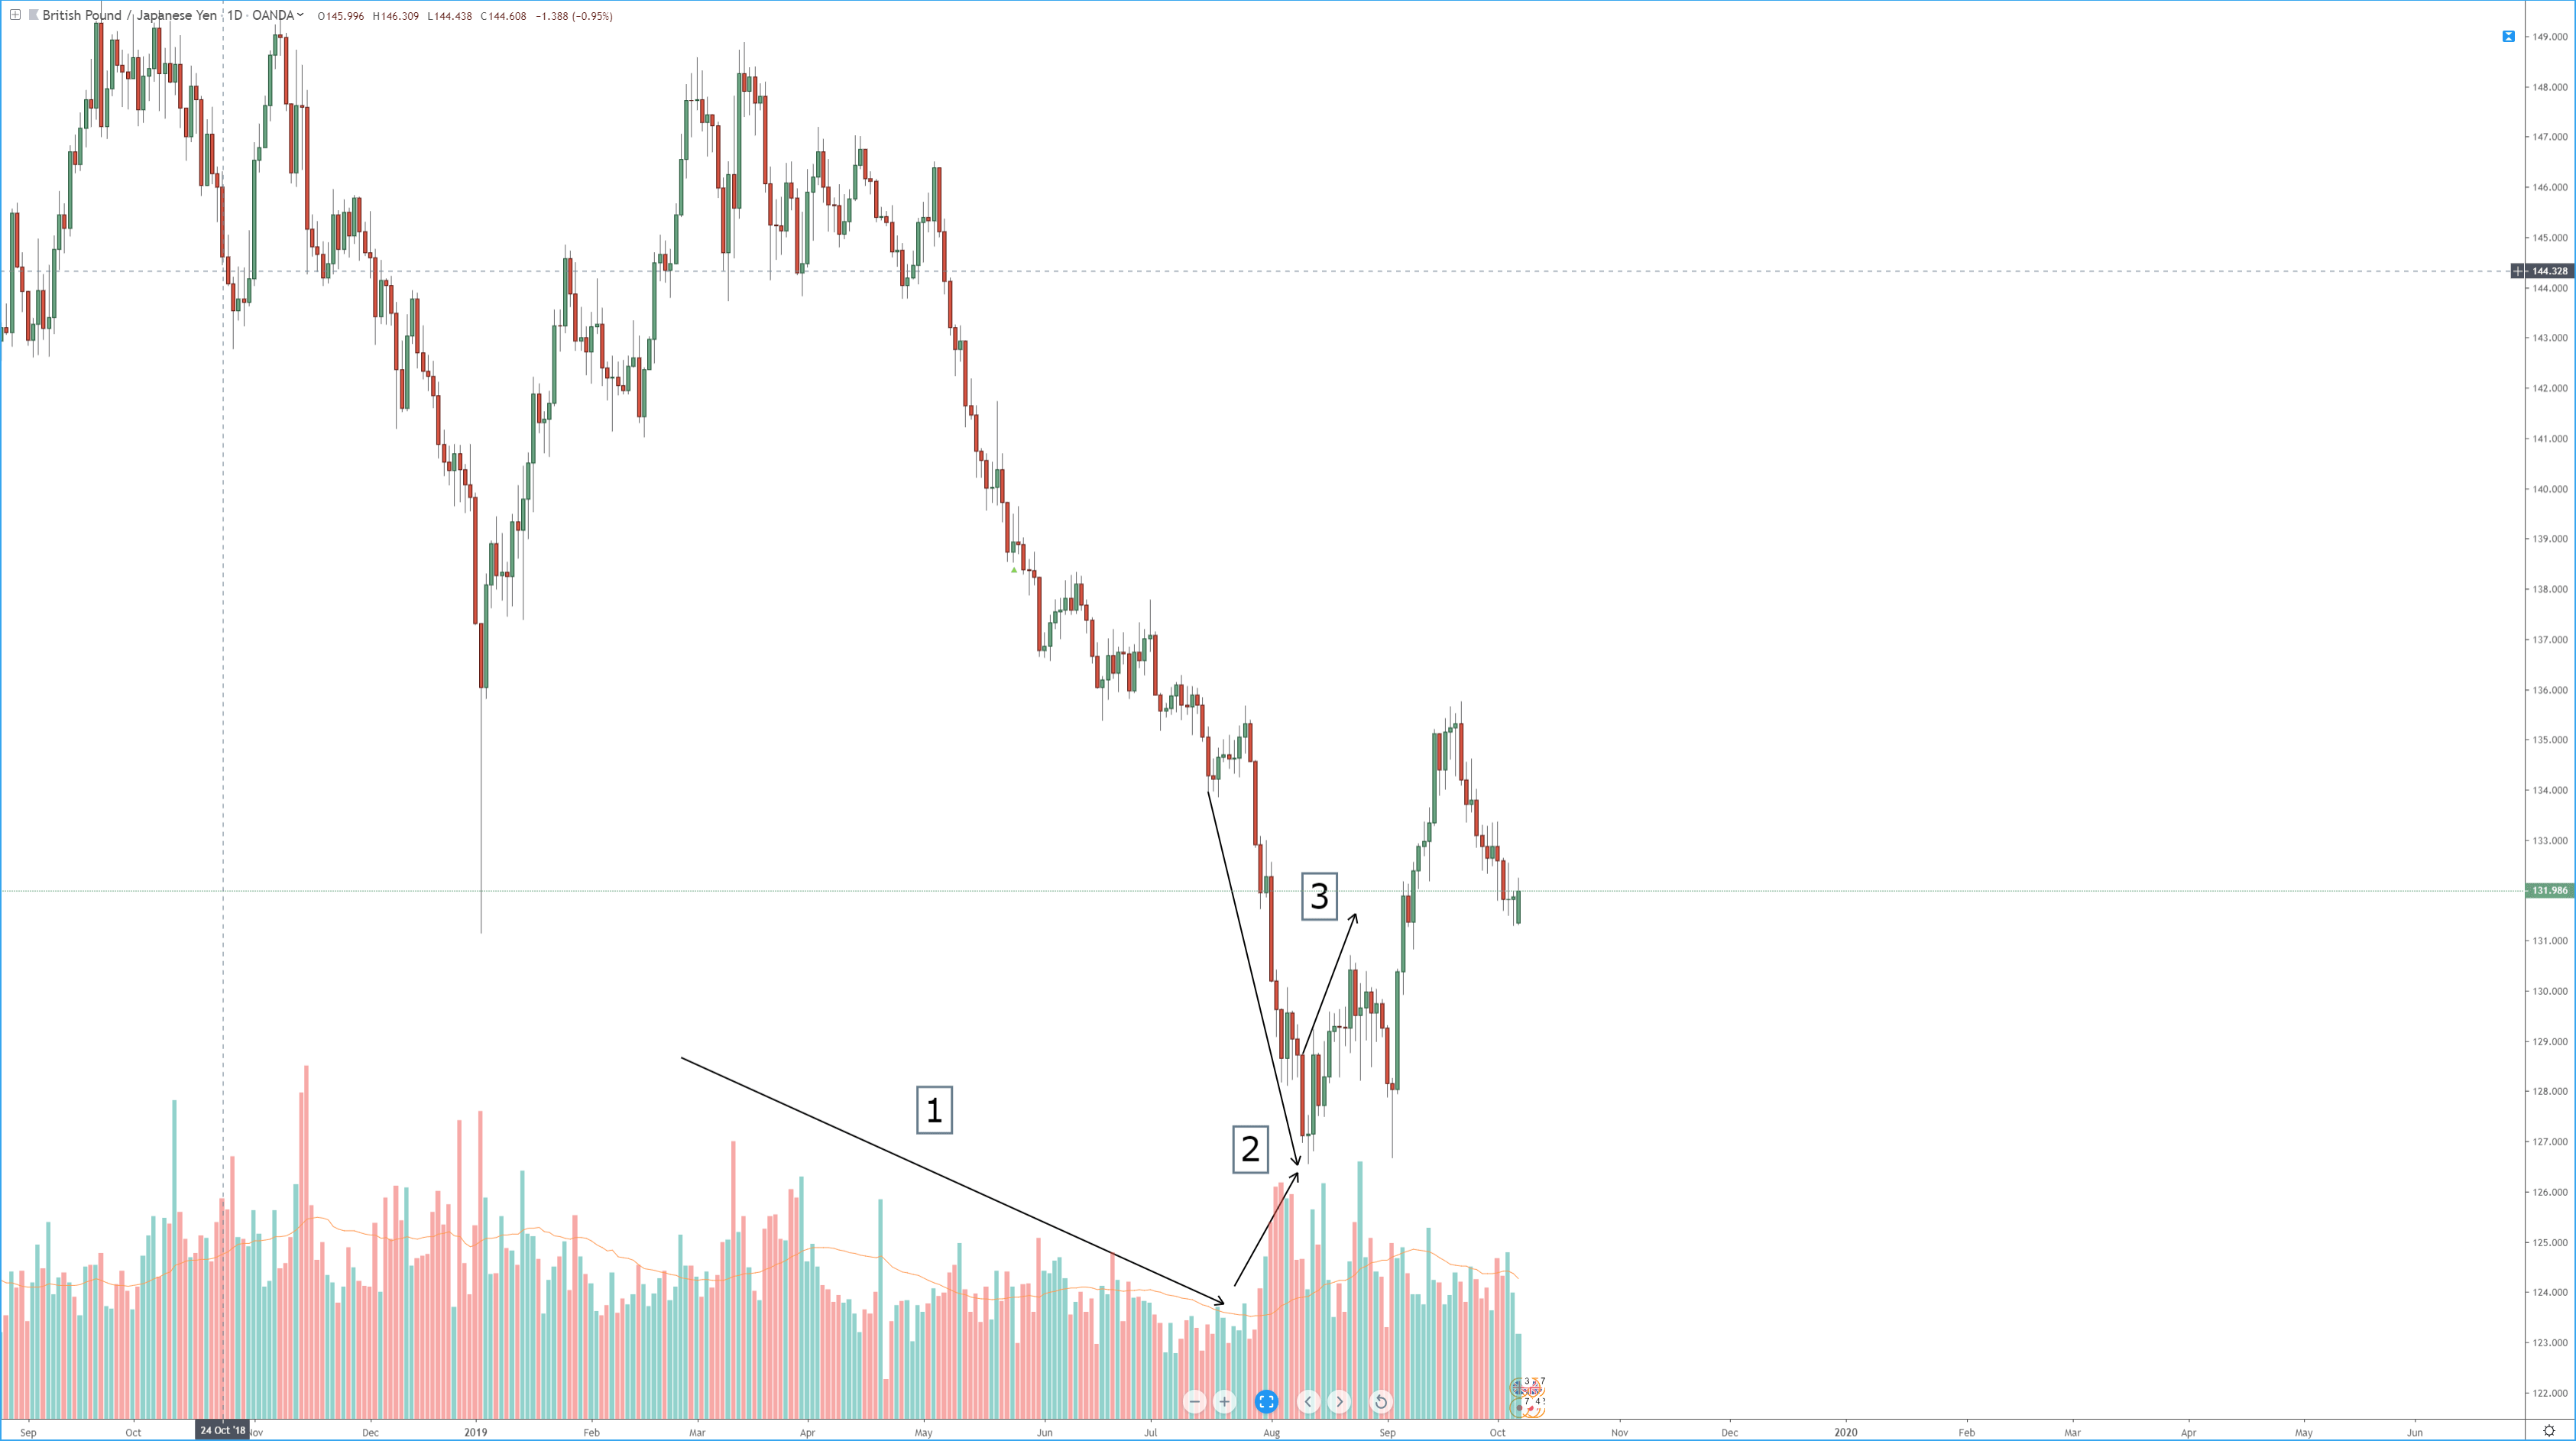
- Price is declining as the price is dropping. That is a clear sign that no one is interested in buying or supporting higher prices.
- As prices have continued to make new lows, notice how the volume begins to spike higher – well above the most recent candlesticks volume.
- This increase in volume indicates more participation and is generally a combination of new entrants going long (buying), and those current traders who are short, have to cover and convert to long. That volume becomes a powerful variable that reverses the price action.
Key Points
- Look to see if the current chart is showing new and important highs or lows.
- If new highs or lows are present, observe the volume indicator. If it is rising, then that can mean the current price action may reverse.