Customized strategies usually have rigid structures that are not performing well on other currency pairs or markets. This one we represent in this article of the series could be applied to all 28 major currency pairs on forex, and with some adjustments, it could also be used in other markets. For this reason, it is our choice of best trading system examples.
Chaikin money flow is a confirmation indicator from the volume category. This might not mean much to a beginner trader but to remind you, trends need momentum to continue and CMF combines measures of market energy (volume) and price direction. Indicators that have these aspects in their formula tend to do very well for trend-following strategies. CMF, to be precise, measures how the price moved before the candle closed, it’s high and low, and then compares those with the closing price. Volume part increases how sensitive CMF will be to that price change, it will move when it matters, and that is what traders want to avoid fake signaling. So if you look out for good trend confirmation indicators, formulas like this are promising you to have something that works.
CMF could be considered too choppy by default settings (20 periods) depending on your trading preferences and timeframe. You may abide by the Fibonacci sequence or just forget about it, use the setting that is best according to your testing. Here is how we believe is the best fit for different strategies.
- On 21 CMF is rather quick and best used for active scalping on any timeframe, however, higher time frames have fewer absurd candles. Expect some false signals here.
- Increased period to 30 has beneficial effects because we had fewer false signals but still managed to get early enough to get some pips. For more lagging, “sure-thing” style check the 50.
- The below 20 setting makes CMF too choppy for trend confirmations, but maybe you would like some levels that are not used by default design. You can set “oversold” or “overbought” zones and use them as you would RSI. This transforms the indicator not to be trend confirmation but probably trend reversal, pullback rebuy, or as an exit signal.
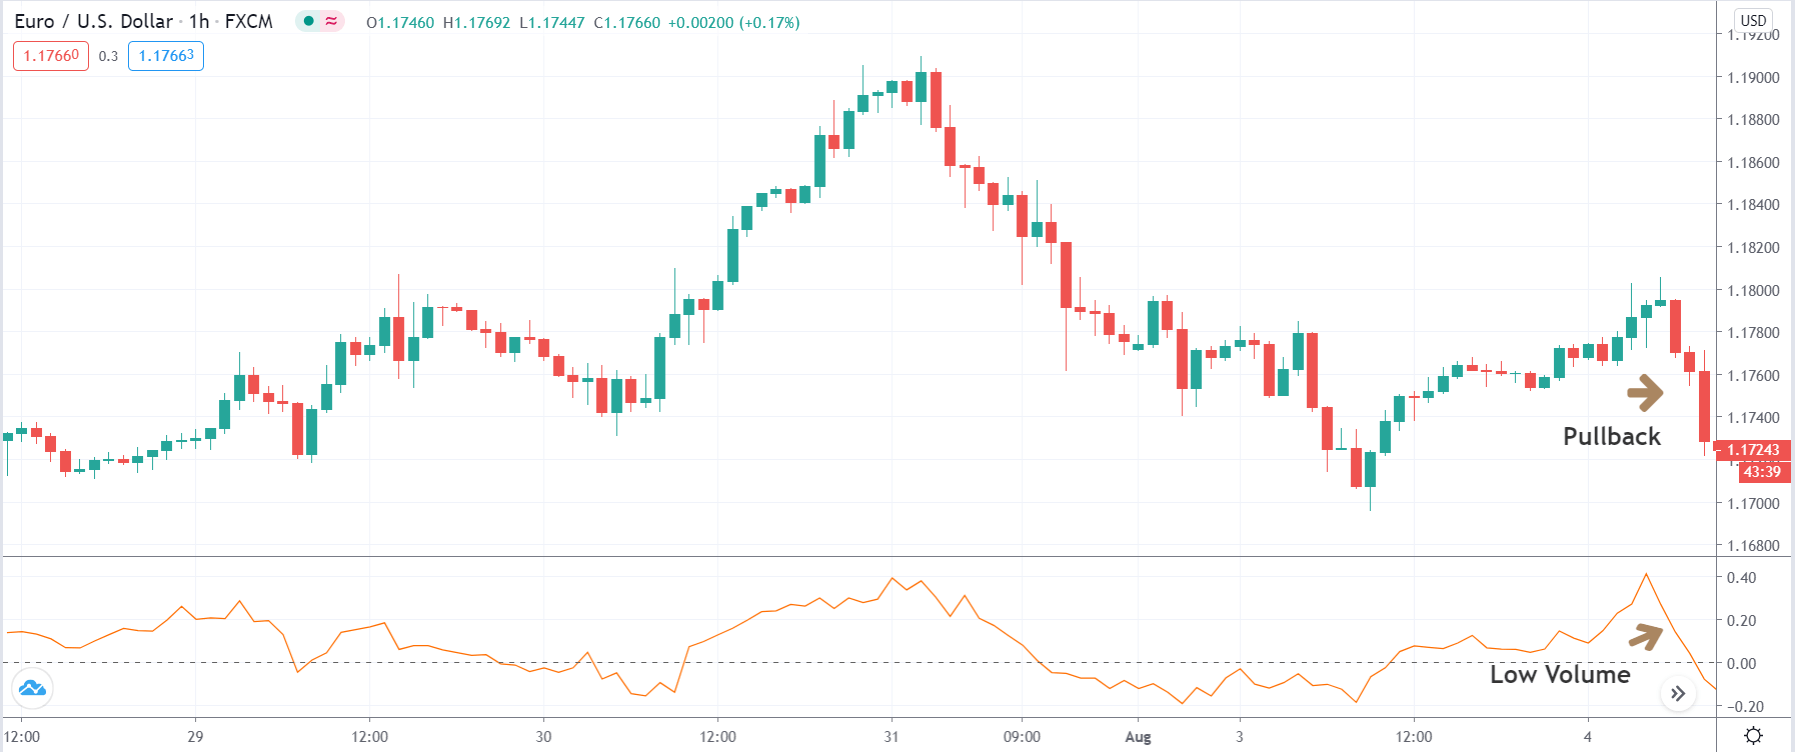
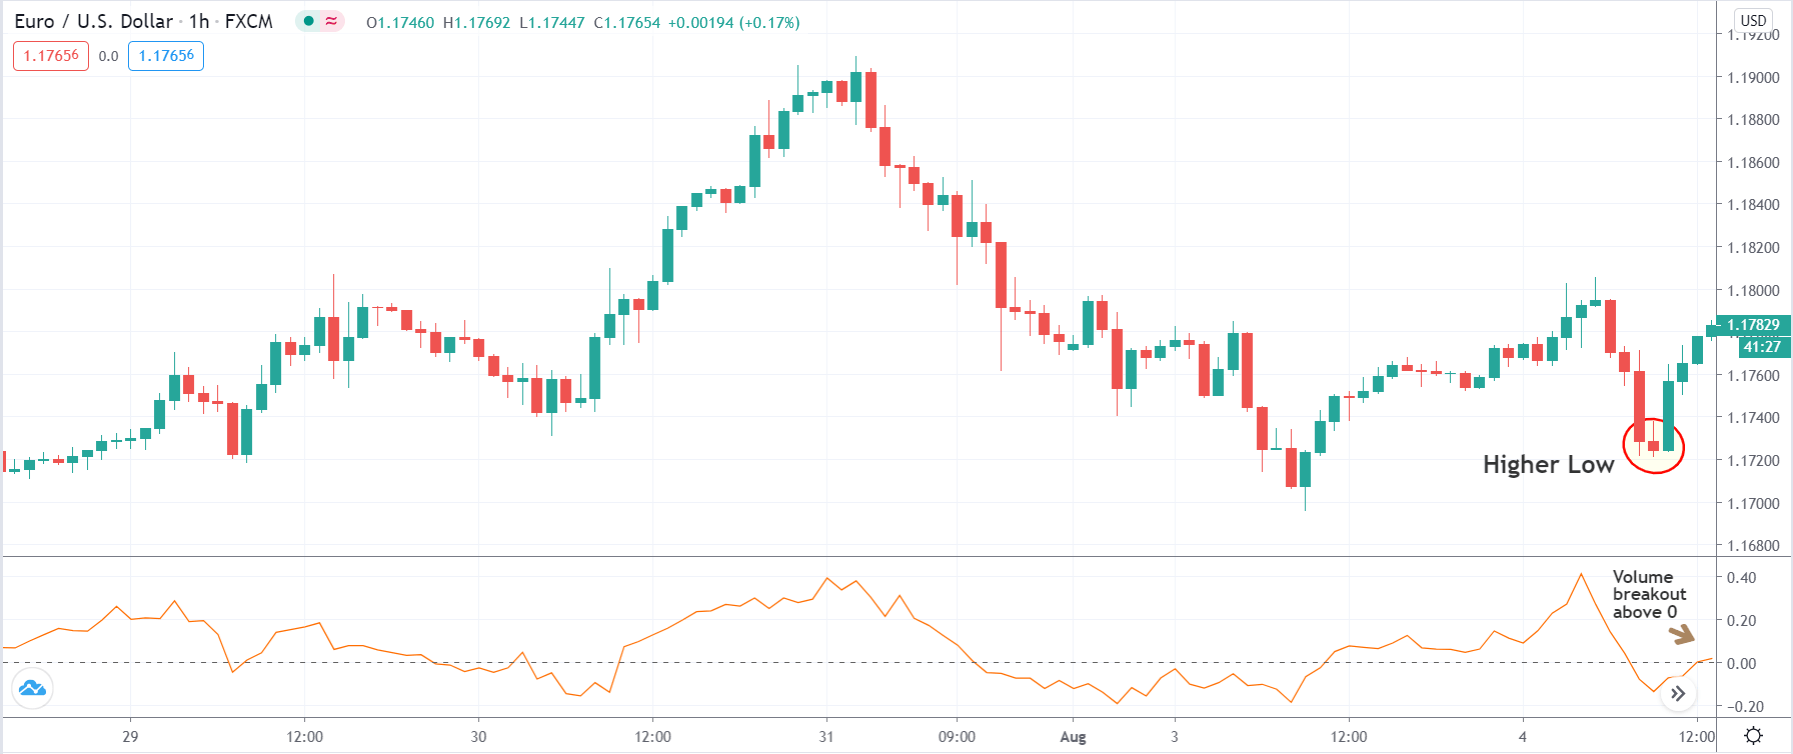
Our strategy builds around this zero-cross indicator and we will add new tools to make it better. Every time a signal line crosses the zero does not mean it is a new signal to enter, it has to be confirmed or filtered. The default of 21 periods settings will generate false signals when the trend is consolidating or accumulating for a new jump. Because of this, CMF could be regarded as neither a lagging nor predictive indicator, a trader can decide to put a small filter zone below/above the zero line. Also, they can use CMF as a no-entry or exit signal whenever it is close to zero.
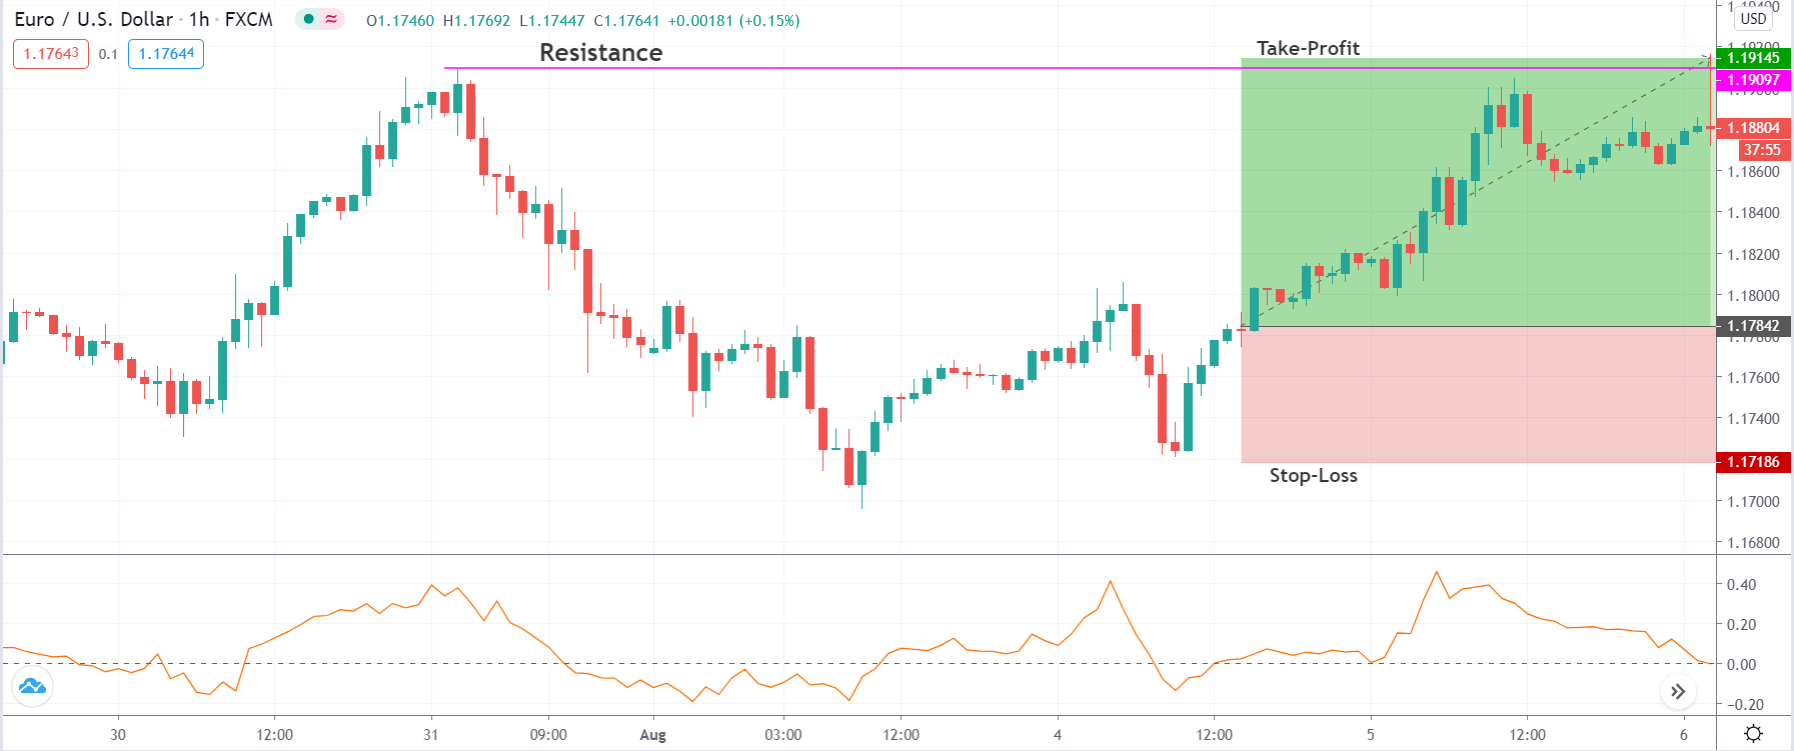
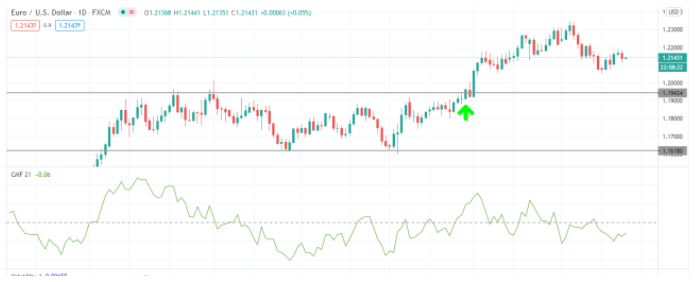
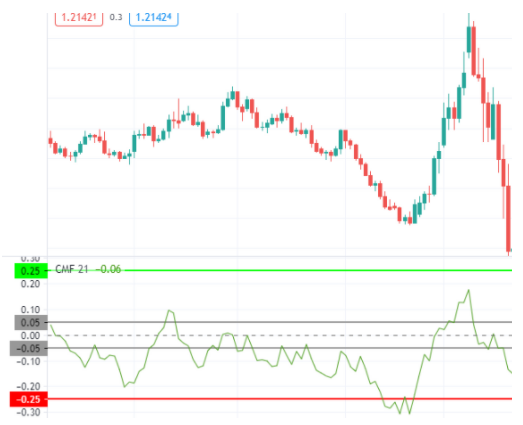
CMF can also be a good breakout confirmation indicator. When the price action dictates a ranging market, CMF easily picks moments when PA breaks out. This is a recent EUR/USD chart with PA support and resistance lines placed. CMF confirmed the breakout for a solid gain from a bullish trend continuation on a daily timeframe.
Some traders may complain about CMF not being able to cope with the gaps. Gaps could form in forex after the weekends but considerable gaps are more common in equities and the commodity market. CMF would react to gaps too much making it useless for a few candles until it settles down.
CMF value reading can be separated into zones so each zone represents a certain market condition. We have mentioned that a zone between 0.05 and -0.05 is no man’s land and that you should not trade here. A value between 0.05 and 0.25 is considered a bullish trend zone where the trend is about to unleash. Once it breaches values of 0.25 and up to 0.4 it is considered the bulls are a dominating side of the sentiment. Everything more than 0.4 means a very strong trend but it also means you probably missed a good point of entry. Symmetrically applies for a bear sentiment and it looks like this:
We have pimped up our CMF but we can still do more. Let’s leave this for later, now we want the strategy to get better by cutting the losers generated by the CMF choppy action still present around the – +0.05 zone. We do this by adding a baseline. Our first baseline of choice is the Kijun-Sen from the Ichimoku indicator using the default setting of 26. The baseline rule says we only trade short trades when the price is below the Kijun and only long when it is above. This way we follow the general trend, you can even call it a higher grade trend.
Believe it or not, we can make this concept even better using the Kumo cloud too from the Ichimoku indicator. This is our second best choice. Instead of the Kijun-Sen, we can plot a 20 EMA on the CMF window itself as our baseline! This trick can be done with most indicators in Metatrader platforms or TradingView (in MT4, select to apply an MA to “first indicator data”). When all combine this strategy setup should look like this:
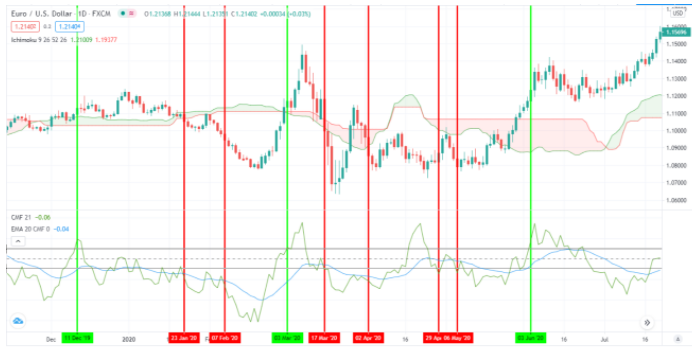
We have marked long and short trades signals (vertical lines). Now, depending on your exit indicator, you could probably have a good win rate, smaller losers, and bigger winners. Needless to say, traders should avoid trading inside the CMF – + 0.05 zone and also avoid trading inside the Kumo cloud. This is the difference between the Kijun-Sen and the Kumo, Kijun does not have a no-trade zone.
The main drawback of this strategy is when the market is not trending. Even with all the filters, some will slip by. Adding more filters will probably just diminish the number of trades and the P/L line, not necessarily the win rate.
Trading different time frames require settings adjustment for each component of the strategy. Of course, this concept will work with different filtering methods such as higher timeframe CMF or even two CMF indicators with lower and higher settings. When they all align we can have some certainty it is not a false signal.
Understand the strategy has many ways to be improved, however, avoid adding too many tools or rules, more is not better. Strategies should remain simple and more importantly followed to the letter, even if you had a losing streak. There is no way to filter all the false signals, what you can do is to notice when the market is choppy or flat. You can do this just by looking at the chart or incorporating a volatility/volume indicator instead of the zone lines we have added to CMF. The example above should be regarded more as a thinking process when you build a strategy – cut the losses with the right tools and rules, and test it with new settings.
If this CMF strategy construction made you excited to make one for yourself, then our goal is complete, you are on the right track to becoming a pro. If you need more we still have 2 more successful trading ideas to show. Pull up your sleeves and see you in part 4 of the series!