Categories
Forex Course

182. Summary – Market Sentiment

Introduction

If you have gone through the previous courses, you already have a solid knowledge of what market sentiment is. You should also be able to create your COT index indicator to spot market trends and points of potential reversals.

To recap, here are a few things you should have in mind by now.

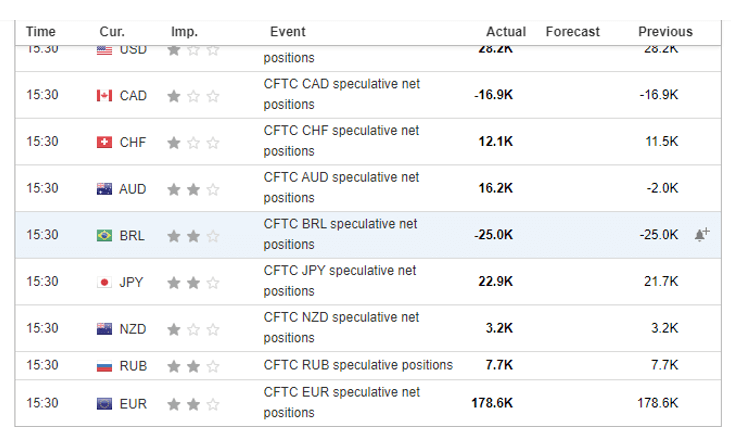
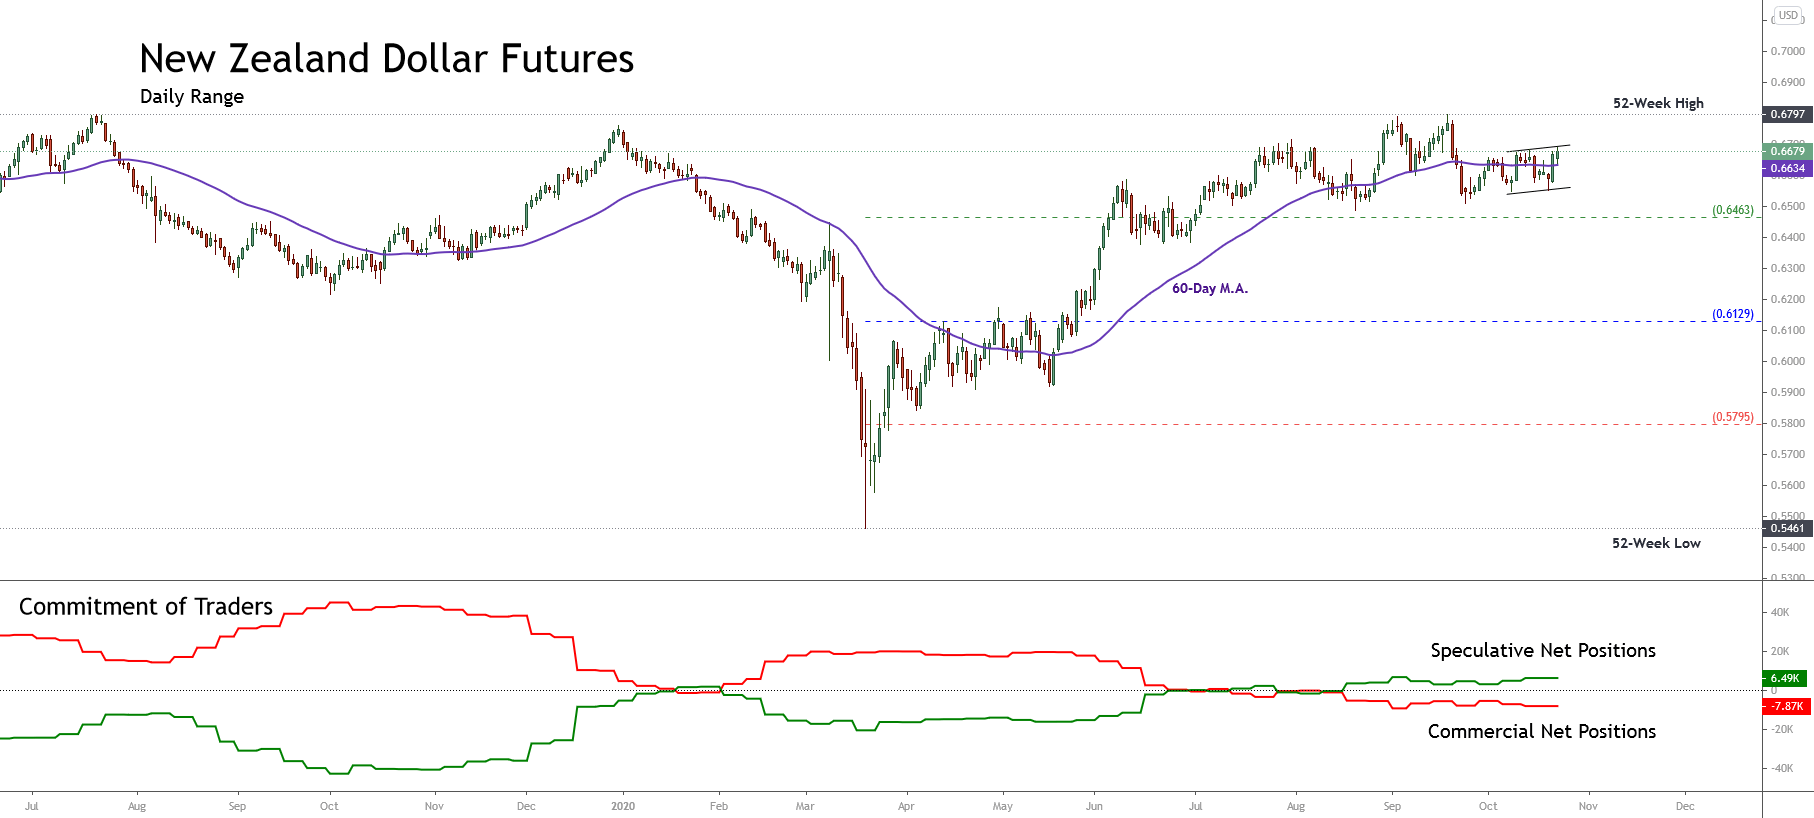
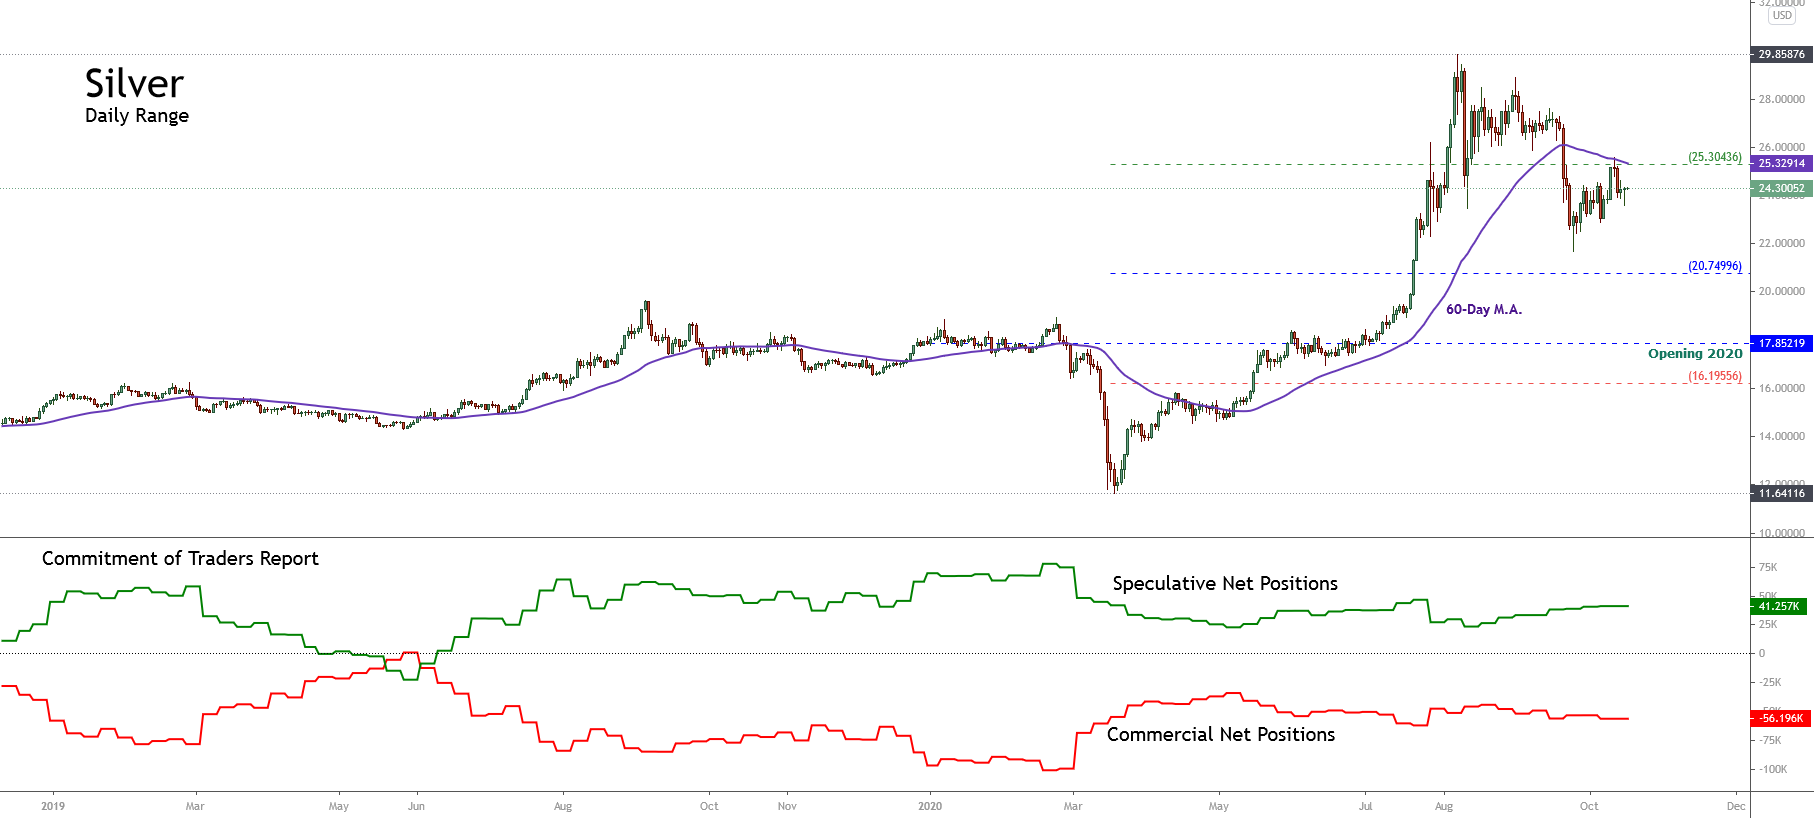
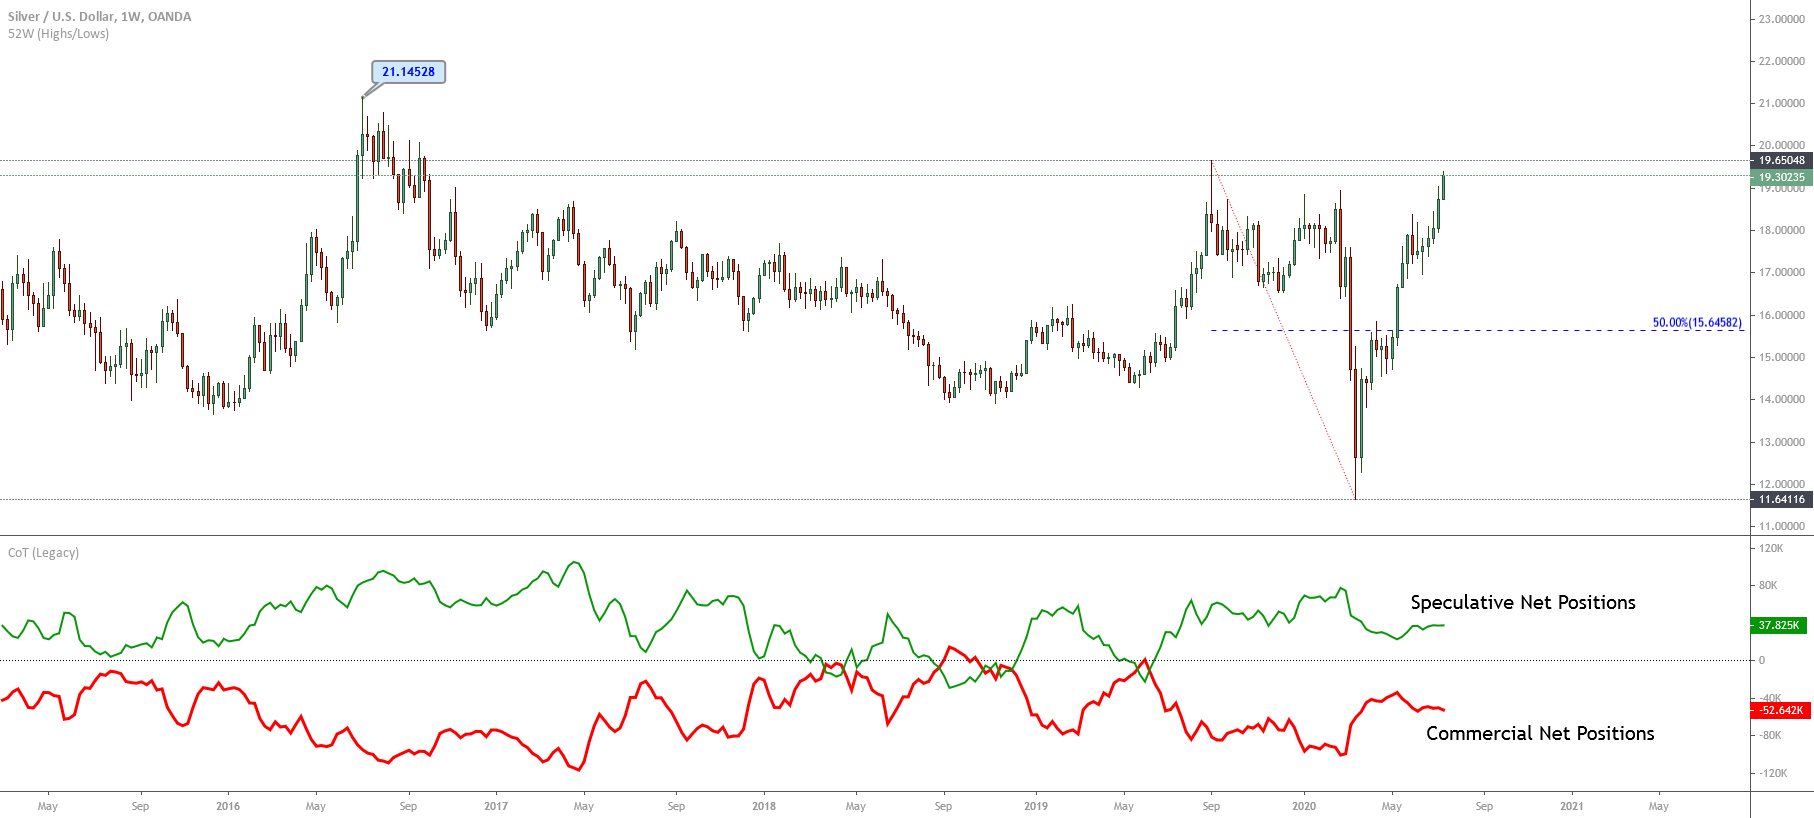
  • The Commitment of Traders (COT) report is the best gauge of the forex market sentiment in
  • The COT report tracks the trading activities by commercial, non-commercial, and retail traders in the futures market.
  • In the futures market positioning, the commercial and non-commercial traders are usually on opposite sides. i.e., when non-commercial traders are long, commercial traders are short.
  • A market reversal can be anticipated when the spread between commercial and non-commercial traders is the widest.
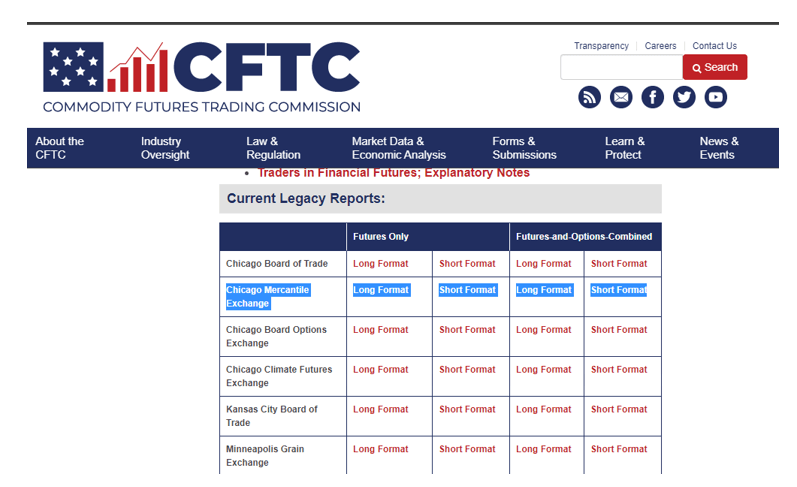
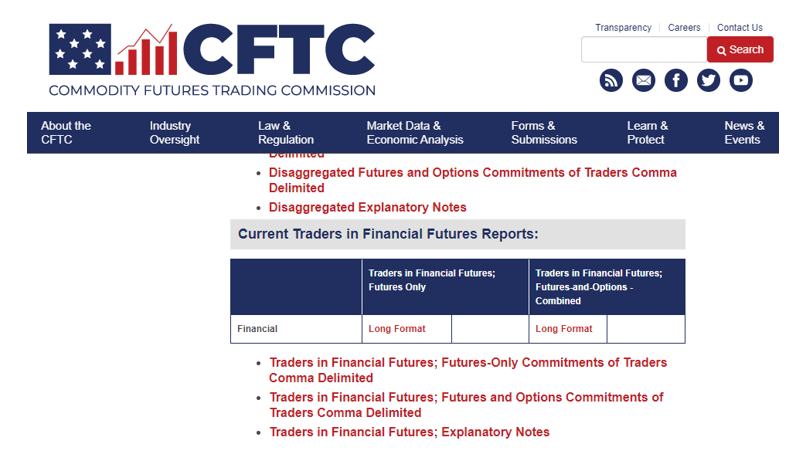
  • The ‘Chicago Mercantile Exchange’ section of ‘Current Legacy Reports’ in the COT report is best suitable for forex traders.

Let’s now conclude this segment with a few things you MUST always keep in mind.

If you haven’t noticed by now, the COT report is best suited for long term trading. If you are a shorter-term trader, you might be inconvenienced if you solely rely on the COT report for a trading signal. You see, the trends established by the COT report index take time to form. But this shouldn’t discourage you; it’s always good to know how the market is trending.

For traders who opt to use the COT report to generate trading signals, the COT report trading indicator is not foolproof. Like thousands of other indicators in the forex market, it is bound to fail at some point. So, you should conduct thorough backtesting with different timeframes to get a proper feel of how the indicator works. Note that with backtesting, you can be able to spot instances where using the COT report can generate false signals, which will help you avoid such conditions in live trading.

Well, even after you have conducted your thorough backtest, you must know that the forex market trends are not solely driven by market sentiment. Several other factors could lead to reversals in the forex market other than the COT report. In any given month, hundreds of high-impact economic indicators and geopolitical developments can significantly influence trends in the forex market. So, be sure to double-check with your economic calendar to know what else is going on in the economy.

[wp_quiz id=”94030″]
Categories
Forex Course

181. Accurately Interpreting The COT Report

Introduction

To this point, you know how to establish market extremes using the COT report. Since you can create your COT report trading indicator, let’s learn how you can effectively interpret the COT report. While spotting the overbought and the oversold regions using the COT report seems arbitrary, a more accurate way of interpreting the COT report would be using percentages of the long and short positions.

We have already established that the best way to identify tops and bottoms using the COT report is by following the trend of the non-commercial traders. Just like the formula for creating the COT trading indicator, calculating the percentages of the long and short positions helps filter out the biases of the raw data.

Calculating the percentage of long positions

For a given currency pair, we first identify the number of long and short contracts. We then use this formula to determine the percentage of long contracts:

For the week of July 31, 2020, the EUR had a net long speculative futures position of 180,648 contracts. The percentage of the long contracts was

For the week of September 18, 2020, the EUR had a net long speculative futures position of 178,576 contracts. The percentage of the long contracts was

Now, assume that you are asked to pick the market top using the raw data for both the above dates. You would have selected the week of July 31, 2020, as your market top. The reason is that the raw data showed that the net long positions for speculative traders have 180648 contracts, while for the week ended September 18, 2020, they had 178576 net long contracts. Clearly, with the raw data, July 31, 2020, would have been the market top.

However, by calculating the percentage of the long contracts for both periods, we see that the week ended September 18, 2020, had the highest percentage at 63.1% compared to 52.6% for the week ended July 31, 2020.

Looking at the futures chart for the EUR, we can confirm that, indeed, the week ended September 18, 2020, was the actual market top.

[wp_quiz id=”94024″]
Categories
Forex Course Forex Daily Topic

180. Picking Accurate Tops & Bottoms Using the COT Report

Introduction

Our previous lesson covered how you can use the Commitment of Traders report to trade in the forex market. In this lesson, we will learn how you can use the COT report to identify the tops and bottoms, i.e., the levels where a currency is overbought or oversold.

Any forex trader would know that the best timing for a reversal trade is when the market is at extreme levels. The COT report helps us understand the trades’ volume and how the different types of traders are positioned. In the previous lesson, we learned that non-commercial traders’ positioning could be used to determine the market trend. On the other hand, commercial traders accumulate their trades around extreme levels where they believe a market reversal could occur. Thus, the positioning of hedgers can be used to determine the market tops and bottoms.

Now, let’s see how you can identify these extreme levels in forex using the COT report.

How to identify Tops (Overbought Levels) Using the COT Report

It is worth noting that when the markets are rising, the non-commercial traders are buying, i.e., they are bullish. Conversely, the commercial traders (hedgers) are bearish when the markets are rising, meaning they are actively shorting the futures contracts in a bullish market. Therefore, in a bullish market, when speculators continually go long as the hedgers keep shorting, a market top will form.

However, it is almost impossible to predetermine a market top. The best way to spot a market top is to notice a reversal beginning to occur in the market when the spread between the commercial traders and non-commercial traders has widened.

The screengrab above shows a market top formed when the short positions by commercial traders were at maximum. Also, notice that the spread between the commercial and non-commercial traders was wider.

How to identify Bottoms (Oversold Levels) Using the COT Report

When the market prices are falling, non-commercial traders are bearish while the commercial traders are bullish. Therefore, a bearish market will reach the bottom when the non-commercial traders keep selling, and the commercial traders maximize their futures bullish positions.

The best way to spot a market bottom is to notice a bear market trend reversing while the spread between the commercial traders and non-commercial traders has widened.

The screengrab above shows a market bottom forming when the long futures position by the commercial traders was at the maximum. Also, note that the spread between the commercial and non-commercial traders was widest at this point.

[wp_quiz id=”89702″]
Categories
Forex Course

179. Using the COT Report for Trading & Analysis

Introduction

Our previous lessons have covered where you can access the Commitment of Traders Report and the components contained within the report. In this lesson, we discuss how you can use the Commitment of Traders Report in forex trading.

Since the COT report gives the market sentiment in forex, this report’s publication should affect the price action in forex. Most forex traders pay attention to the non-commercial traders’ category of the COT report. The interest with the non-commercial traders is because these traders are considered speculative participants.

The nonreportable positions held by small-scale retail traders are not significant enough to move the markets. Similarly, since commercial traders are not considered speculative traders, the impact of their positions on price action tends to be subdued.

How the COT Report Affects Price Action?

When the non-commercial traders are accumulating their positions, it affirms a particular trend. Let’s take the AUD/USD, for example. When non-commercial traders, over time, are accumulating futures short position on the AUD as the AUD/USD pair falls, is a confirmation that this downtrend will persist. Conversely, when the non-commercial traders are accumulating future long positions of the AUD as the AUD/USD keeps rising, it is a confirmation that the uptrend will continue. This way, you can use the COT report as a trend confirmation indicator.

The COT report can also be used to indicate the overbought and oversold regions. The non-commercial traders, i.e., speculators, have a limit on how much they can buy or sell. These traders will reach a point where they would want to close their positions and take profits. Furthermore, when in a persistent uptrend, speculators might feel it’s no longer profitable to keep buying futures contracts at higher prices. Similarly, in a downtrend, these traders might not consider it profitable to keep selling at lower prices.

When the speculators have reached their critical limits in the forex futures, they begin reversing their trends. For day traders, the impact of the COT is diminished since its effects are long-term.

How the COT Report Publication Affects Forex Charts?

The screengrab below is GBP futures. At the bottom, if the COT indicator is showing the trend of commercial traders, non-commercial traders, and retail traders. In this case, we are interested in the non-commercial traders (i.e., large traders) since their positions influence the trend.

As you can see, the market moves at pace with the changes in the positioning of the large traders.

[wp_quiz id=”89690″]
Categories
Forex Course

178. Decoding The COT Report

In the previous lesson, we learned how, where, and when you can access the Commitment of Traders report. In this lesson, we will discuss the elements contained in the COT report. The CFTC prepares four COT report types: the Legacy Report, the Supplemental Report, the Disaggregated Report, and the Traders in Financial Futures report. For forex traders, the Legacy and the Traders in Financial Futures reports are of most importance.

The Legacy Report
The Legacy report is categorized by different exchanges. Forex traders pay attention to the reports from the Chicago Mercantile Exchange. The Legacy reports have categories for only futures report and a combination of both futures’ and options report. The open interest positions that are reportable are categorized into two: non-commercial and commercial traders.
The Traders in Financial Futures (TFF) Report

This report contains financial contracts, including the US Treasuries, currencies, the VIX, and Eurodollars. Like the Legacy report, it has two categories; only futures report and a combination of both futures’ and options report. The open interest positions in the TFF report are categorized into four: leveraged funds; dealer/intermediary; asset manager/institutional; and other reportable.

Understanding Terms used in the COT Report

Open Interest: The totality of all futures and options contracts that have not yet been executed but are yet to be offset by exercise, delivery, or transaction.

Reportable Positions: these are open interests that are equal to or exceed the reporting level set by the CFTC. These positions are reported to the CFTC by foreign exchange brokers, futures commission merchants, and clearing members. The reportable positions account for about 70% to 90% of all open interests in a given market.

Nonreportable positions: are calculated by subtracting the reportable positions from the total open interests in a given market. The traders involved in nonreportable positions are unknown, as is their classification on whether they are commercial or non-commercial. These are mainly small-scale retail traders.

Commercial Traders: are traders who participate in the futures and options market to hedge their core business activities. In forex futures, commercial traders seek to offset the risks of the spot market. The CFTC has set the definition that qualifies a commercial trader under Regulation 1.3 (z). Commercial traders do not seek to take possession of the assets underlying a futures contract.

Non-commercial Traders: are also known as large speculators. These traders participate in the futures market primarily as an investment by speculating on price movements. They have no intentions of taking ownership of the underlying asset to profit from the price difference.

Changes in commitments from previous reports: shows the difference between the data in the current and the immediate previous publication of the report.

Number of Traders: show the reportable traders in each category. For each category, a trader is counted if they have an open position. The number of traders in each category can exceed the total number of traders because a single trader can have open positions in different categories.

[wp_quiz id=”89679″]
Categories
Forex Course

177. Simple Guide To Find the ‘Commitment of Traders’ Report

Introduction

The previous lesson covered what the Commitment of Traders report is. In this lesson, we will focus on how and where you can retrieve the COT report. The COT report is prepared and published every Friday at 3.30 PM ET by the US Commodity Futures Trading Commission. However, you can access the latest report and those from previous issues at the CFTC website.

The CFTC publishes beforehand the release schedule for the COT report. This schedule can be accessed here. The commission also keeps an archive of all past reports. The historical Commitment of Traders reports can be accessed here.

For forex traders, reading through the COT report might seem cumbersome. If you are interested in trading the forex market using the COT report, some economic calendars make available relevant snippets of select speculative net positions from the report. Below is a screenshot from Investing.com showing the latest release of the COT report on September 18, 2020, at 3.30 PM ET.

If you are interested in an in-depth review of the latest Commitment of Traders report, below is a step by step procedure of how to access it.

Step 1: to view the latest COT report, go to the CFTC website.

Step 2: After accessing the CFTC website, the next step is to find the right report for the forex market. The CFTC published multiple Commitment of Traders reports. These reports include markets other than the Chicago Mercantile Exchange that also contain other non-futures derivative contracts.

The COT report that has data on the forex market is the ‘Current Legacy Reports.’ Under the ‘Current Legacy Reports,’ select the formats belonging to the Chicago Mercantile Exchange.  Below is a screengrab of the from the CFTC website.

To access the COT report, select ‘Short Format’ under the ‘Futures Only’ tab.

Alternatively, if you want a more comprehensive report on the future positioning of traders in the financial sector, you should look at the ‘Current Traders in Financial Futures Report.’ Below is a screengrab from the CFTC website showing this section.

Step 3: After opening the ‘ Short Format’ of Chicago Mercantile Exchange section of the COT, the next step is to identify which currency you are interested in.

Although it looks disorganized, searching through the report is relatively easy. Use the ‘search function’ of your browser to bring up the ‘search box.’ Type the currency you want to analyze. In this case, we searched for the CAD. The search results will appear, as shown in the screengrab below.

I hope you found this guide informative. Please let us know if you have any questions in the comments below. Don’t forget to take the below quiz before you go. Cheers!

[wp_quiz id=”89672″]
Categories
Forex Course Forex Daily Topic

176. Introduction To The Commitment of Traders Report (CoT)

Introduction

In the previous lesson, we discussed market sentiment in Forex. Since you already know how the sentiment comes along, in this lesson, we will discuss how the forex market sentiment is measured.

What is the Commitment of Traders Report?

The commitment of traders (COT) report is how you measure forex market sentiment. One of the primary determinants of market sentiment in forex is the demand for a currency. The COT report tracks how commercial and non-commercial traders are positioned in the forex market.

As the name suggests, the COT report gives data about commitments made by big players in the forex market to conduct future trades. The report shows the totality of futures and options contacts in the forex market, which have not yet been settled. Thus, these future transactions can impact the price movement of the currency pairs in the spot market where most retail traders participate.

How does the Commitment of Traders Report work?

The COT report is published by the US Commodity Futures Trading Commission (CFTC). The publication is released every Friday at 3.30 PM ET. This report shows the total outstanding open positions in the forex futures market as of Tuesday of that week. The data in the COT report includes futures of the major currencies and most of the minor currencies.

According to the CFTC, the COT report is a breakdown of the futures and options market positioning of at least 20 traders. These are traders whose futures and options positions in the forex market are above or equal to the reporting levels set by the CFTC. In our subsequent lessons, we will further explain the type of traders included in the COT reports and the reporting levels.

It is worth noting that the majority of the transactions in the interbank forex market are private and are not made public. For this reason, the retail traders do not have a lot of knowledge about the significant transactions that occur daily in the forex market. Therefore, the COT reports play a significant role in publicizing the futures positioning in the forex market.

Conclusion

The forex market portion of the COT report shows the totality of the long and short futures position adopted by traders. These are speculative traders; whose primary objective is to anticipate future price changes and place their bets regarding a currency. Therefore, monitoring how these market players have positioned their future trades might increase your analysis of future trends in the forex market.

[wp_quiz id=”89646″]
Categories
Forex Elliott Wave Forex Market Analysis

NZDUSD Short-Term Wave Analysis

Overview

The NZDUSD pair advances in a sideways corrective formation suggesting the progress in an incomplete short-term flat pattern. The completion of its move could give way to a new bearish movement of the upper degree; however, this incomplete correction could be temporary.

Market Sentiment Overview

The New Zealand Dollar moves slightly bullish this Thursday, 22nd advancing 0.13%, expecting the inflation data released by New Zealand’s Statistics, Stats NZ, in the upcoming overnight session. The data corresponds to the third quarter of 2020, and surveyed analysts expect an increase that could rise to 1.7% (YoY), being 0.2% more than the previous reading published in July.

The New Zealand Dollar futures market sentiment, presented in the following daily chart, unveils the price moving in the extreme bullish sentiment zone. In the chart, we can distinguish  0.6463 as support the level and 0.6797 as the resistance level. A level that corresponds to the 52-week high. 

On the other hand, the chart highlights the price action is moving mainly sideways, consolidating around the weighted moving average of 60 days. This context of price action suggests we can expect a corrective move before continuing its bullish trend.

Concerning the evolution of the Commitment of Traders Report, the previous chart exposes the institutional positioning on the bullish side. In consequence, although the current consolidation calls for a corrective move, the primary trend is bullish.

The next figure unveils that 73% of retail traders currently hold their positions on the bearish side, confirming a contrarian long-term upward bias to this pair.


Elliott Wave Outlook

The NZDUSD short-term outlook under the Elliott Wave perspective unveiled in its 3-hour chart exposes the kiwi’s sideways advance since the oceanic currency topped at 0.67978 on September 18th, where the pair started to develop a corrective structure that remains in progress.

Considering that a corrective structure is subdivided into a three-wave sequence, we can notice in the previous figure that the NZDUAD action progresses in its second wave, identified as wave B of Minor degree, and labeled in green. This segment corresponds to a flat pattern (3-3-5), which currently develops its wave ((c)) of Minute degree identified in black.

At the same time, the internal structure of the wave ((c)) reveals that the price action could be advancing in its wave (v) of the Minuette degree labeled in blue. This market context suggests the possibility of a limited upside before start developing a downward sequence, corresponding to wave C of Minor degree. 

In summary, the short-term outlook for the NZDUSD pair, under the Elliott Wave perspective, foresees a downward move, which corresponds to a wave C of Minor degree. This potential next move may subdivide into a five-wave sequence. Once this corrective formation completes, the Kiwi should begin to develop a new upward impulsive sequence of upper degree coinciding with the long-term institutional bias.

Categories
Forex Elliott Wave Forex Market Analysis

Silver Unveils an Incomplete Corrective Structure

Overview

Silver price advances in an incomplete corrective structure that remains in progress, after the precious metal topped at its highest level since March 2013. The market sentiment continues dominated by the bullish side. Nevertheless, the incomplete Elliott wave structure suggests that the precious metal could see a new low.

Market Sentiment Overview

The Silver price continues fading from the yearly highs that carried the price toward annual highs at $29.85 per ounce in early August. However, the precious metal eases over 19% from the yearly high, Silver advances 35.2% (YTD).

The following daily chart displays the Silver’s 52-week high and low range. The figure highlights the consolidation of Silver below $25.30 per ounce and the price action running below the 60-day weighted moving average. This market context suggests that the precious metal traders downgraded their market sentiment from extremely bullish to bullish.

On the other hand, according to the Commitment of Traders report, it is observed that the big participants’ speculative net positions remain on the bullish side. In this context, the descents developed by precious metal suggest that market participants are involved in a take-profit activity and do not represent a change in the current upward trend.

Therefore, in the long-term overview, the market sentiment remains bullish. Nevertheless, in the short-term, the declines observed represent a taking profit activity. Finally, as long as there is no confirmation of new signs of a new rally, our bias remains on the neutral side.

Elliott Wave Outlook

The next chart illustrates Silver in its log-scale 8-hour timeframe, which reveals the price action is developing the last move of a cycle, which began on March 18th when the precious metal found fresh buyers at $11.61 per ounce. The incorporation of new buyers drove the precious metal to a bullish impulsive structure development completed on August 06th when Silver reached $29.86 per ounce.

Once Silver prices found resistance at $29.86, it completed a five-wave sequence of Minute degree identified in black. Simultaneously, according to the price fractality principle, Silver finished the first wave of Minor degree labeled in green.

According to the Elliott Wave Theory, once completed the five-wave impulsive sequence, the price reacts in the opposite direction developing a three-wave movement. From the previous chart, Silver reveals that its corrective structure is incomplete.

In particular, the precious metal advances in its wave ((c)) of Minute degree identified in black. In turn, the internal structure of the wave ((c)) has pending the bearish movement of the wave (v) of the Minuette degree identified in blue. The last move will likely re-test the descending channel’s base, dropping between $21.35 and $19.44 per ounce.

Once Silver completes the bearish five-wave sequence of wave ((c)), traders may start looking for positioning alternatives on the bullish side. Finally, considering that wave 1 of Minor degree presents an extended wave’s characteristics, wave 3 of the same degree should not be the largest wave of the impulsive sequence of Minor degree.

In short, Silver’s market sentiment remains on the bullish side; however, the price moves in an incomplete corrective structure that could lead to new price lows. Once the short-term bearish sequence is completed, Silver could start producing entry signals on the bullish side, corresponding to the primary trend.

Categories
Forex Market Analysis

US Dollar Index Consolidates Expecting Further Declines

Overview

The U.S. Dollar Index (DXY) develops a mid-term sideways formation inside a long-term bearish trend that looks incomplete. During this year, the Greenback sheds -4.31% (YTD). Although the positive inflation data expanded the price in Tuesday’s trading session, it was not enough to boost the price toward fresh highs.

Market Sentiment Overview

The U.S. Dollar Index (DXY) retreats 0.23% in Wednesday’s trading session by erasing the advance that the Greenback made on Tuesday, driven by inflation data, which exceeded surveyed analysts’ expectations reaching 1.4% (YoY).

Although the data released by the U.S. Bureau of Labor Statistics this Tuesday exceeded the expectations of market participants and Federal Reserve policymakers boosting the price to climb 0.53%, the reading observed would not have a greater impact on the rate decision of the next FOMC broad meeting. Still, it would be more focused on the evolution of the labor market.

The following chart illustrates the U.S. Dollar Index in its 12-hour timeframe. The figure exposes the 90-days high and low range, reflecting that the market participants’ sentiment remains on the extreme bearish side. The price action remains below the 200-period weighted moving average, confirming the bearish sentiment.

On the other hand, the last Commitment of Traders Report unveils institutional traders’ bearish bias, confirming the bearish sentiment exhibited by the U.S. Dollar Index.

Therefore, according to the Federal Reserve policymakers’ expectations, the labor market’s evolution could be a factor contributing to the U.S. Dollar Index volatility increase. On the other hand, as long as the price remains below 94.02 pts and below the 200-period average, the Greenback bias will remain on the extreme bearish side.

Technical Analysis Outlook

The U.S. Dollar Index, in its 4-hour chart, illustrates a sideways movement from a long-term bearish sequence, which seems to be incomplete. The mid-term sideways structure is limited by September 01st low of 91.75 pts, with a top of the sideways range at the level reached on September 25th, located at 94.74 pts.

The above figure shows that the mid-term trading range moves between 91.75 pts and 94.82 pts. This market context suggests that the currencies included in the U.S. Dollar Index basket might continue developing sideways movements in the coming trading sessions.

On the other hand, the Elliott Wave perspective overview reveals that the price developed a three-wave bullish movement from the September 01st low of 91.75 pts, which ended on 94.74 pts.

Currently, the DXY index develops a pause formation in a bearish sequence that could evolve in three waves. This consolidation structure identified as wave ((b)) in black is still in progress.

Accordingly, the U.S. Dollar Index should complete the consolidation movement identified by the short-term sideways channel before continuing with its mid-term bearish trend.

Categories
Forex Market Analysis

NZDJPY Shows Long-Term Bullish Signals

The NZDJPY cross continues its recovery after the massive sell-off that made it lose over 18.6% in the first quarter of the year when it plummeted until 59.49. From this yearly low, NZDJPY raised near to 17.9% to date.

Market Sentiment Overview

The market sentiment of NZDJPY exposed in its weekly chart reveals the market action showing bullish reversal signals after surpass and consolidate above the 26-week moving average. 

At the same time, we observe that, last week, the price closed in the upper zone of its 52-week range. This context leads us to conclude that the market participants might continue pushing the price higher.

The following figure shows the net positioning of the New Zealand Dollar and Japanese Yen futures. In the chart, we observe that institutional participants maintain a bullish pressure on the kiwi. At the same time, big participants on the Japanese currency continue having a net positioning to the long-side under 50% of the 52-week high and low range.

Consequently, considering the market sentiment on both the NZ Dollar and Japanese Yen futures, we could expect more upsides for the NZDJPY cross.

The Elliott Wave Outlook

The long-term Elliott wave perspective of the NZDJPY cross illustrated in the following chart shows a bullish structural series in progress. The upward sequence began on March 18th when the cross found fresh buyers at 59.49, where the price action developed a V-turn bounce movement.

Once the NZDJPY cross started its bounce movement, the price began to develop an impulsive sequence subdivided into five internal segments of the Minuette degree identified in blue. According to the Elliott wave theory, the structural series drawn by the NZDJPY cross corresponds to a leading diagonal formation, which tends to appear in the first wave of an impulsive sequence or corrective structure. This pattern usually follows an internal structure subdivided into 3-3-3-3-3 or 5-3-5-3-5.

After the leading diagonal completion on April 30th, high at 66.103, when the cross ended its wave ((i)) of Minute degree identified in black, the price made a higher low at 63.46 on May 17th corresponding to its wave ((ii)). Once this second wave ended, the NZDJPY cross began to rally on the wave ((iii)), which remains incomplete.

Currently, the NZDJPY cross advances in its wave (iv) of Minuette degree in blue of the incomplete third wave of Minute degree.

Our outlook for the NZDJPY cross, based on the Elliott Wave perspective, anticipates a limited decline into five waves, which could complete the wave (iv) of the Minuette degree in blue. Once this sequence ends, the market action should find fresh buyers expecting to continue pushing the cross higher. This way, the NZDJPY cross should complete the wave ((iii)) of Minute degree.

Considering that the next movement will correspond to wave ((iv)) of Minute degree, we could expect the price moving mostly sideways before starts climbing on its fifth wave of Minute degree.

Finally, considering that the market sentiment reveals an increasing bullish momentum for the New Zealand Dollar, and the Japanese Yen exposes a neutral bias that seems to start turning bearish, long-term, NZDJPY could experience more rallies.

In consequence, our preferred positioning for the NZDJPY cross still remains on the bullish side. Any time the price drops could be an opportunity to join the long side.

Categories
Forex Market Analysis

Silver: Sustained Bullish Pressure

Silver advances over 3.14% this week, increasing its gains by the sixth week in a row. The precious metal could visit the $20 per ounce, the highest level since September 2016.

The Market Sentiment

Silver, in its weekly chart, reveals that institutional participants hold a bullish sentiment. The speculative positioning identified in green, taken from the Commitment of Traders report (CoT) issued each Friday by the CFTC, confirms that institutional traders hold its long positions expecting new higher highs. At the same time, both the COT report as the price action doesn’t reveal signals of a reversal trend.

On the other hand, the strong upward momentum that can be seen on the precious metal is driving it near its 52-week high located at $19.65 per ounce. This market context leads us to expect an increment in volatility on the metal sector, which could hit new highs.

The following daily chart reveals that Silver volume remains above the 250 trading sessions average. The relatively high volume level along with its price advancement confirms that the current uptrend remains intact.

The Elliott Wave Outlook

The Elliott wave perspective sketched in the following 12-hour chart exposes an incomplete bullish five-wave sequence, which could drive prices to exceed the $20 per ounce.

The precious metal started an incomplete bullish sequence last March 18th when the price found fresh buyers at $11.64 per ounce. Once Silver started its recovery, the market participants sent it into an internal five-wave rally to $15.84 per ounce, where it completed wave ((a)) of Minute degree labeled in black.

In the previous chart, we observe a narrow-range corrective sequence developed into a three-wave structural series that failed to achieve a new lower low. This market context warns us about the potential strong upward momentum that could drive Silver toward new higher highs. In fact, the price action reveals an incomplete fifth wave of Minuette degree labeled in blue, which remains in progress.

The RSI oscillator reveals a bearish divergence, which leads us to confirm that Silver currently moves in its fifth wave, possibly belonging to a wave ((c)) of Minute degree. In an alternative count sequence, Silver could be advancing in a wave ((3)) of Minute degree.

Considering the Elliott Wave rule of extensions, the current fifth wave could be the extended wave of the entire upward sequence. On the other hand, the Fibonacci projection suggests that the precious metal could extend its gains in a range from $20.04 to $21.66 per ounce.

Finally, as long as the price action continues advancing above the $18.47, the short-term trend will continue being led by the bull traders.