Novice traders usually prefer to focus on trade ideas and strategies, believing that the path to success is the knowledge about entries and exits. But in a trading environment with leverage, risk management plays a crucial role. This article tries to show why.
Key points
In trading, There are two key points a trader must care and make sure:
- That his strategy is good
- Risk management trough proper position sizing
Good Strategies and Bad strategies
The first thing to consider is the quality of the trading system or strategy. There are risk management ideas that might convert a losing system into a winner if the problem was that stop-loss settings were wrong, But no position sizing can change a losing strategy into a winning one. Therefore, the first thing a trader should care about is for his system to have a positive edge.
In statistical terms, the strategy should have a positive expectation. If not, the trader should analyze it, find the weak points, and modify it for profitability. Once the system is profitable, it can be traded. Finally, depending on its quality, the system will make grow the trading account fast or slow, and, also, its growth can be optimized through position sizing.
Strategy basic Statistical
To analyze a trading strategy, we need to normalize its trades to a basic unit and, then extract its four main statistical parameters:
- Percent winners
- Mean reward-to-risk Ratio
- Mathematical expectation
- Standard Deviation of the expectation.
For example, the system we are going to use as an example in this article shows the following parameters:
STRATEGY STATISTICAL PARAMETERS :
- Nr. of Trades: 143.00
- Percent winners: 58.74%
- Mean Reward Ratio: 1.22
- Mathematical Expectation: 0.0887
- Standard dev: 0.4090
It is not a really good system, but it’s tradeable. The Mathematical expectation says that the system, using a basic unit of risk of one dollar, is able to extract a mean of 8.87 cents per dollar risked on every trade. Therefore, the system has an 8.87 cents edge against the market, which is 8.87%.
Drawdown
You can see that here, we did not show the drawdown as a parameter to consider. That is because drawdown is dependent on position sizing. The parameter we can compute, though, is the losing streak, which is the number of continuous losses we could expect based on the percent of losses. As we know, the percent of losers is 1-percent winners. Therefore, in this case, Percent losers = 41.26%
With that information, we can create a probabilistic curve of a losing streak of size N, such as the one here. But the trade size is what is going to define the drawdown parameter.
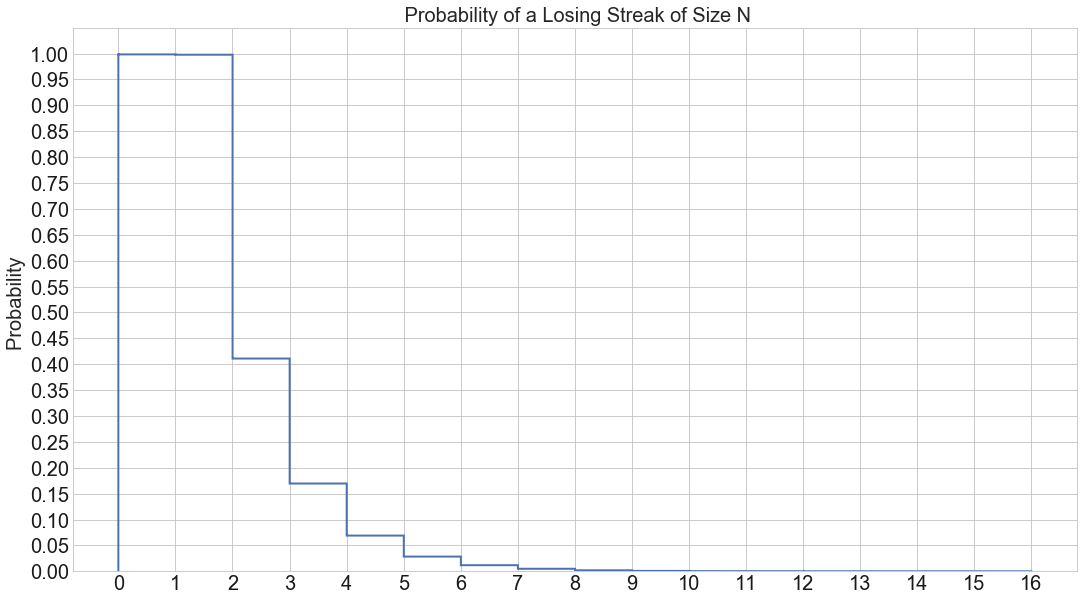
Fig 1 – Losing Streak Probability Curve
Leverage and Drawdown
Forex is a leveraged trading environment, and many brokers offer its customers the ability to go up to 500:1, meaning traders can use up to 500x the size of its trading account to open positions. But is it wise to get that leveraged? Let’s do an experiment using the above-mentioned system.
As said above, the system has been taken from a real trader and is a good, although not brilliant system. But it is a real no-hype system that can be traded what we want to test. For this test, we will always start with a balance of $10,000 and will increase the trade size using the same trade segment.
Leverage = 1
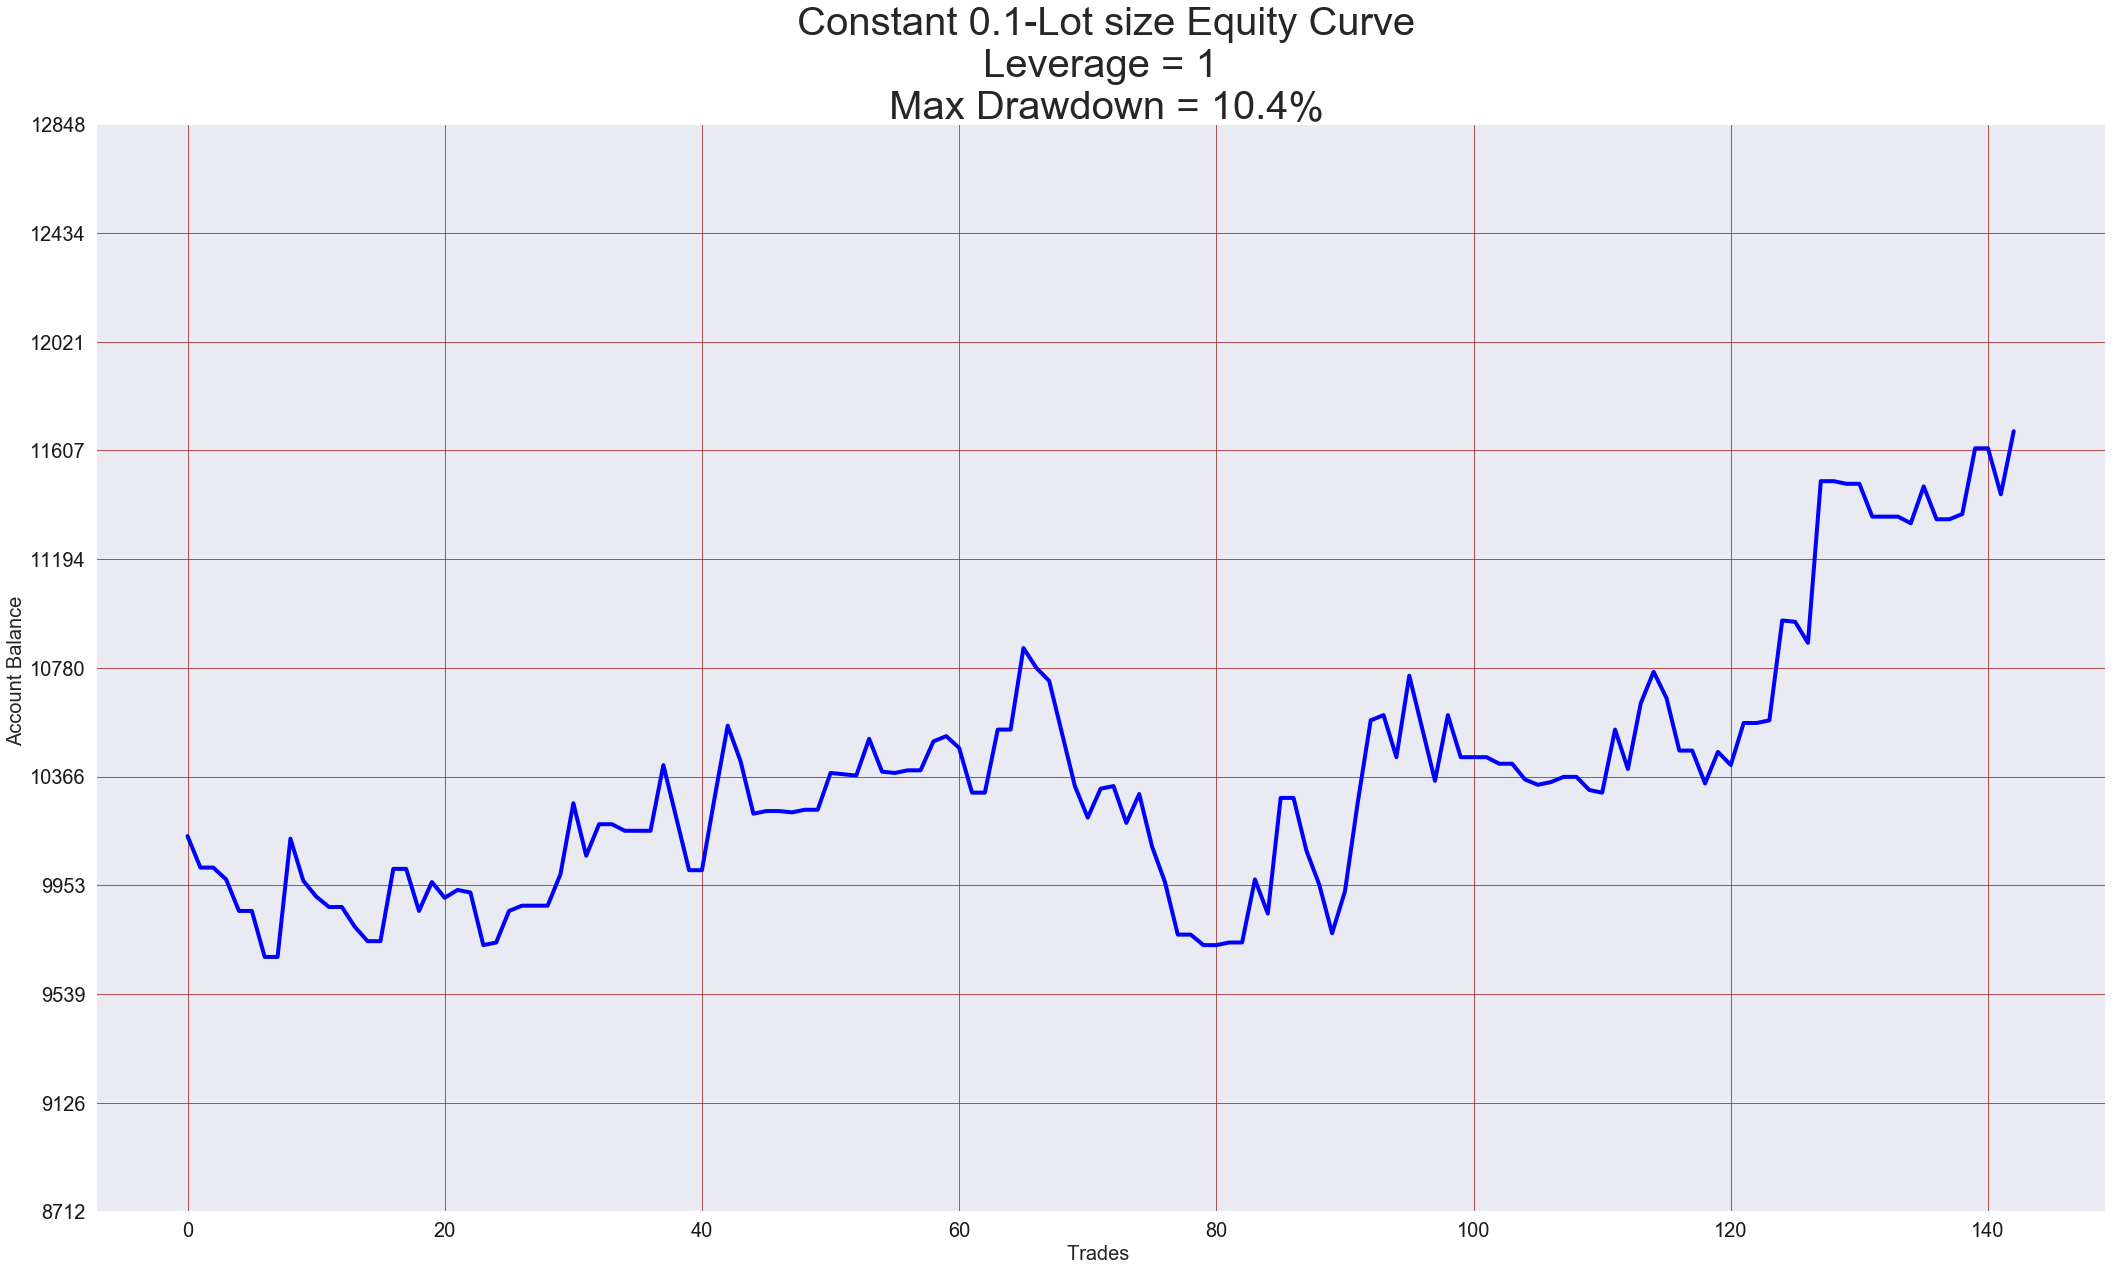 Fig 2 – 0.1 Lots per trade
Using a leverage of one, we see that the system shows a max drawdown of 10.4 percent, and the final equity after 143 trades is a bit more than $11.600, which is 16% growth.
Leverage = 5
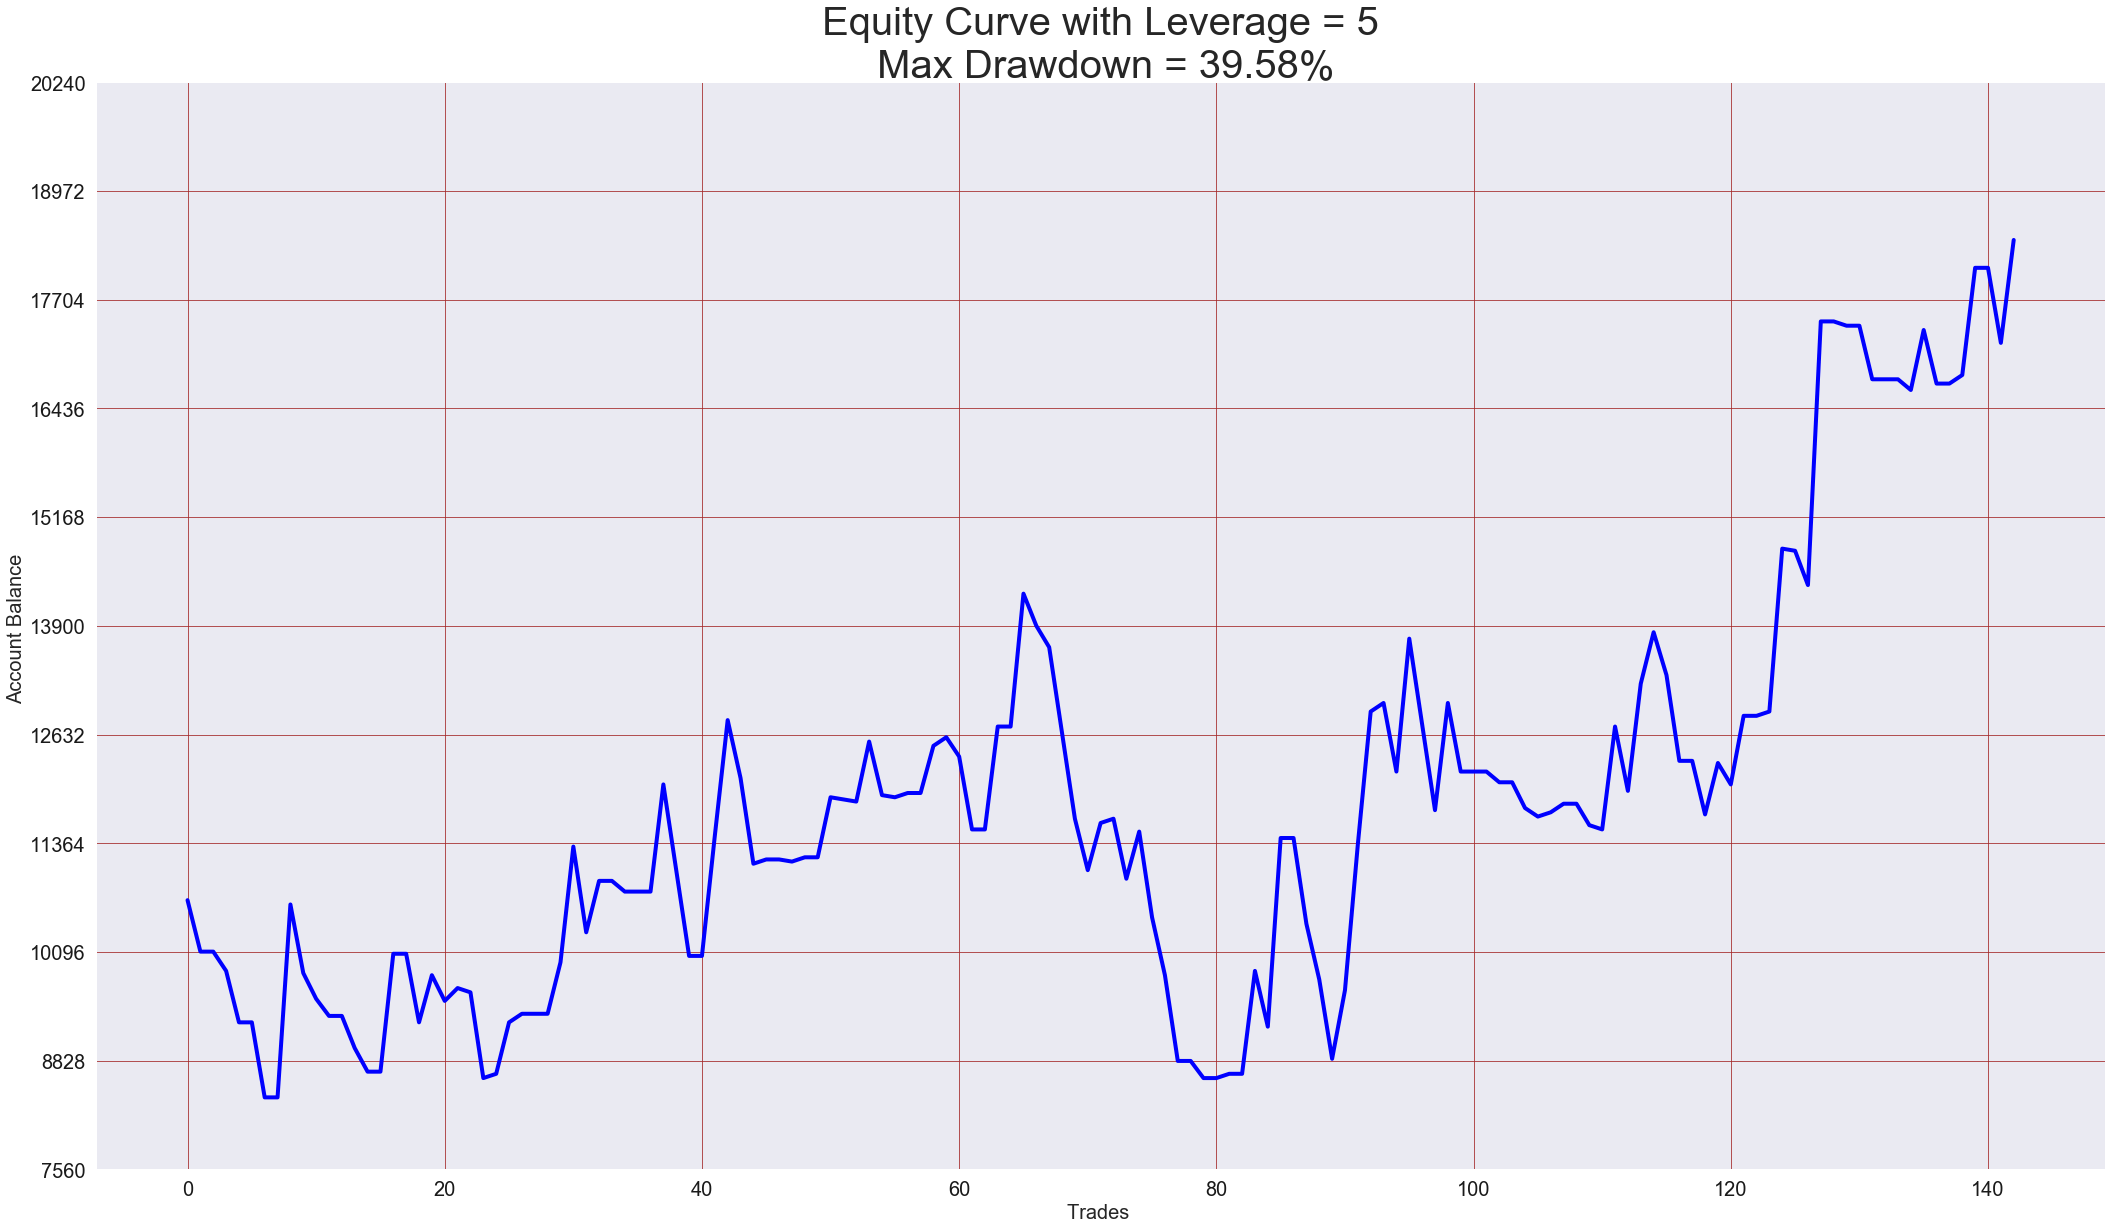
Fig 3 – 5X Leverage
Using 5X leverage, we notice that the Max Drawdown went to 39.58%, and the final equity ended up at $18,400.00 for an 84% profit.
Leverage = 10
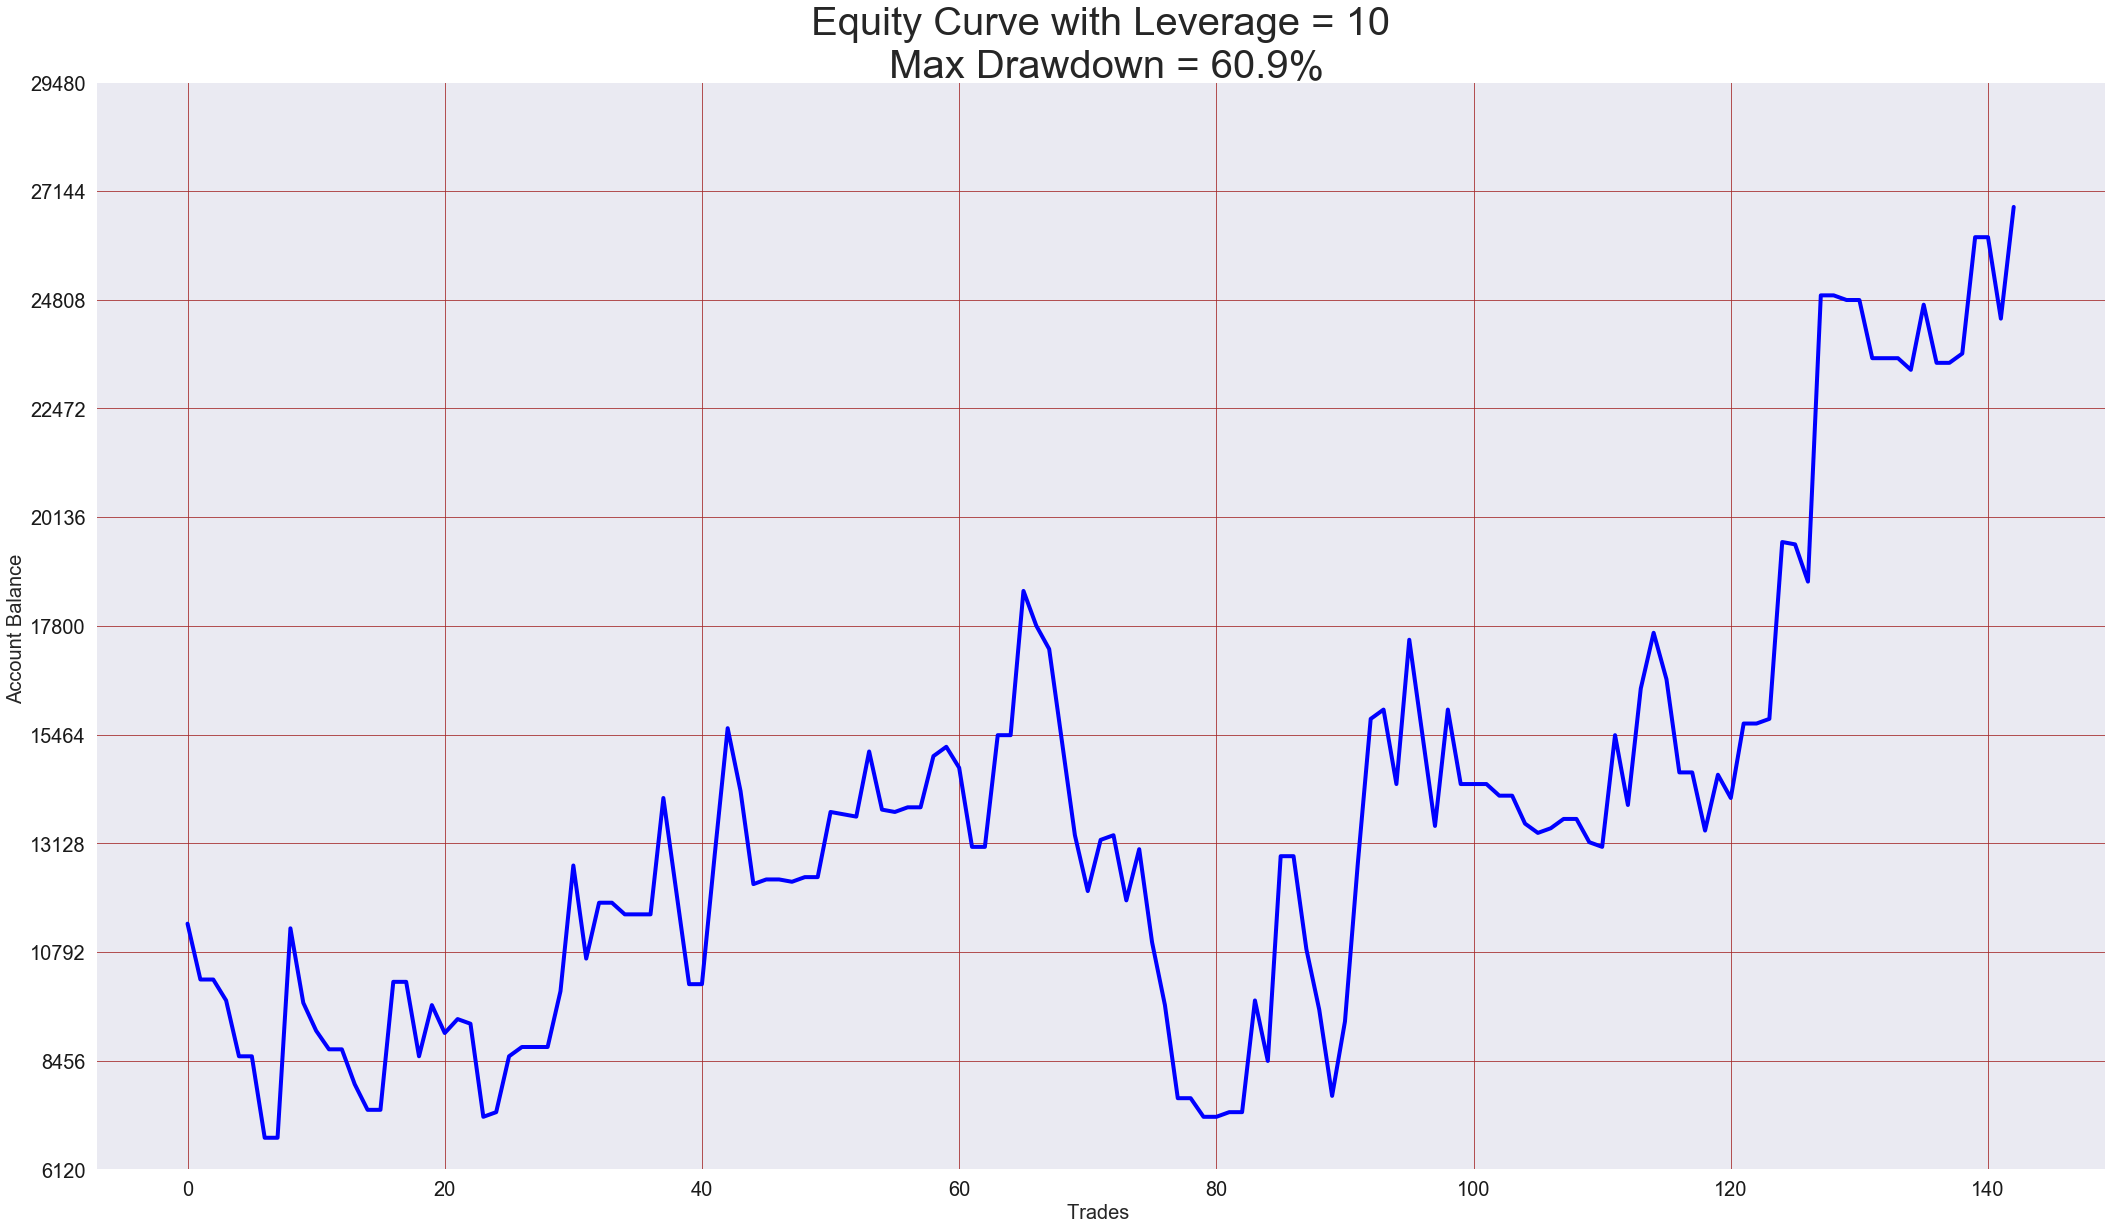
Fig 4 – 10X Leverage
If the trader dares to go to 10X leverage, he must endure close to 61% drawdown for the opportunity to receive 168% profit and a total equity of $26,800 at the end of a 143-trade cycle.
Leverage = 20

Fig 5 – 20X Leverage
Leverage 20X is even wilder. The trader has to withstand up to 83.4% drawdown for a gain of 336.00 % profit. The question is when to stop? Will a 40X leverage be even better for the profit-hungry trader?
Leverage = 40
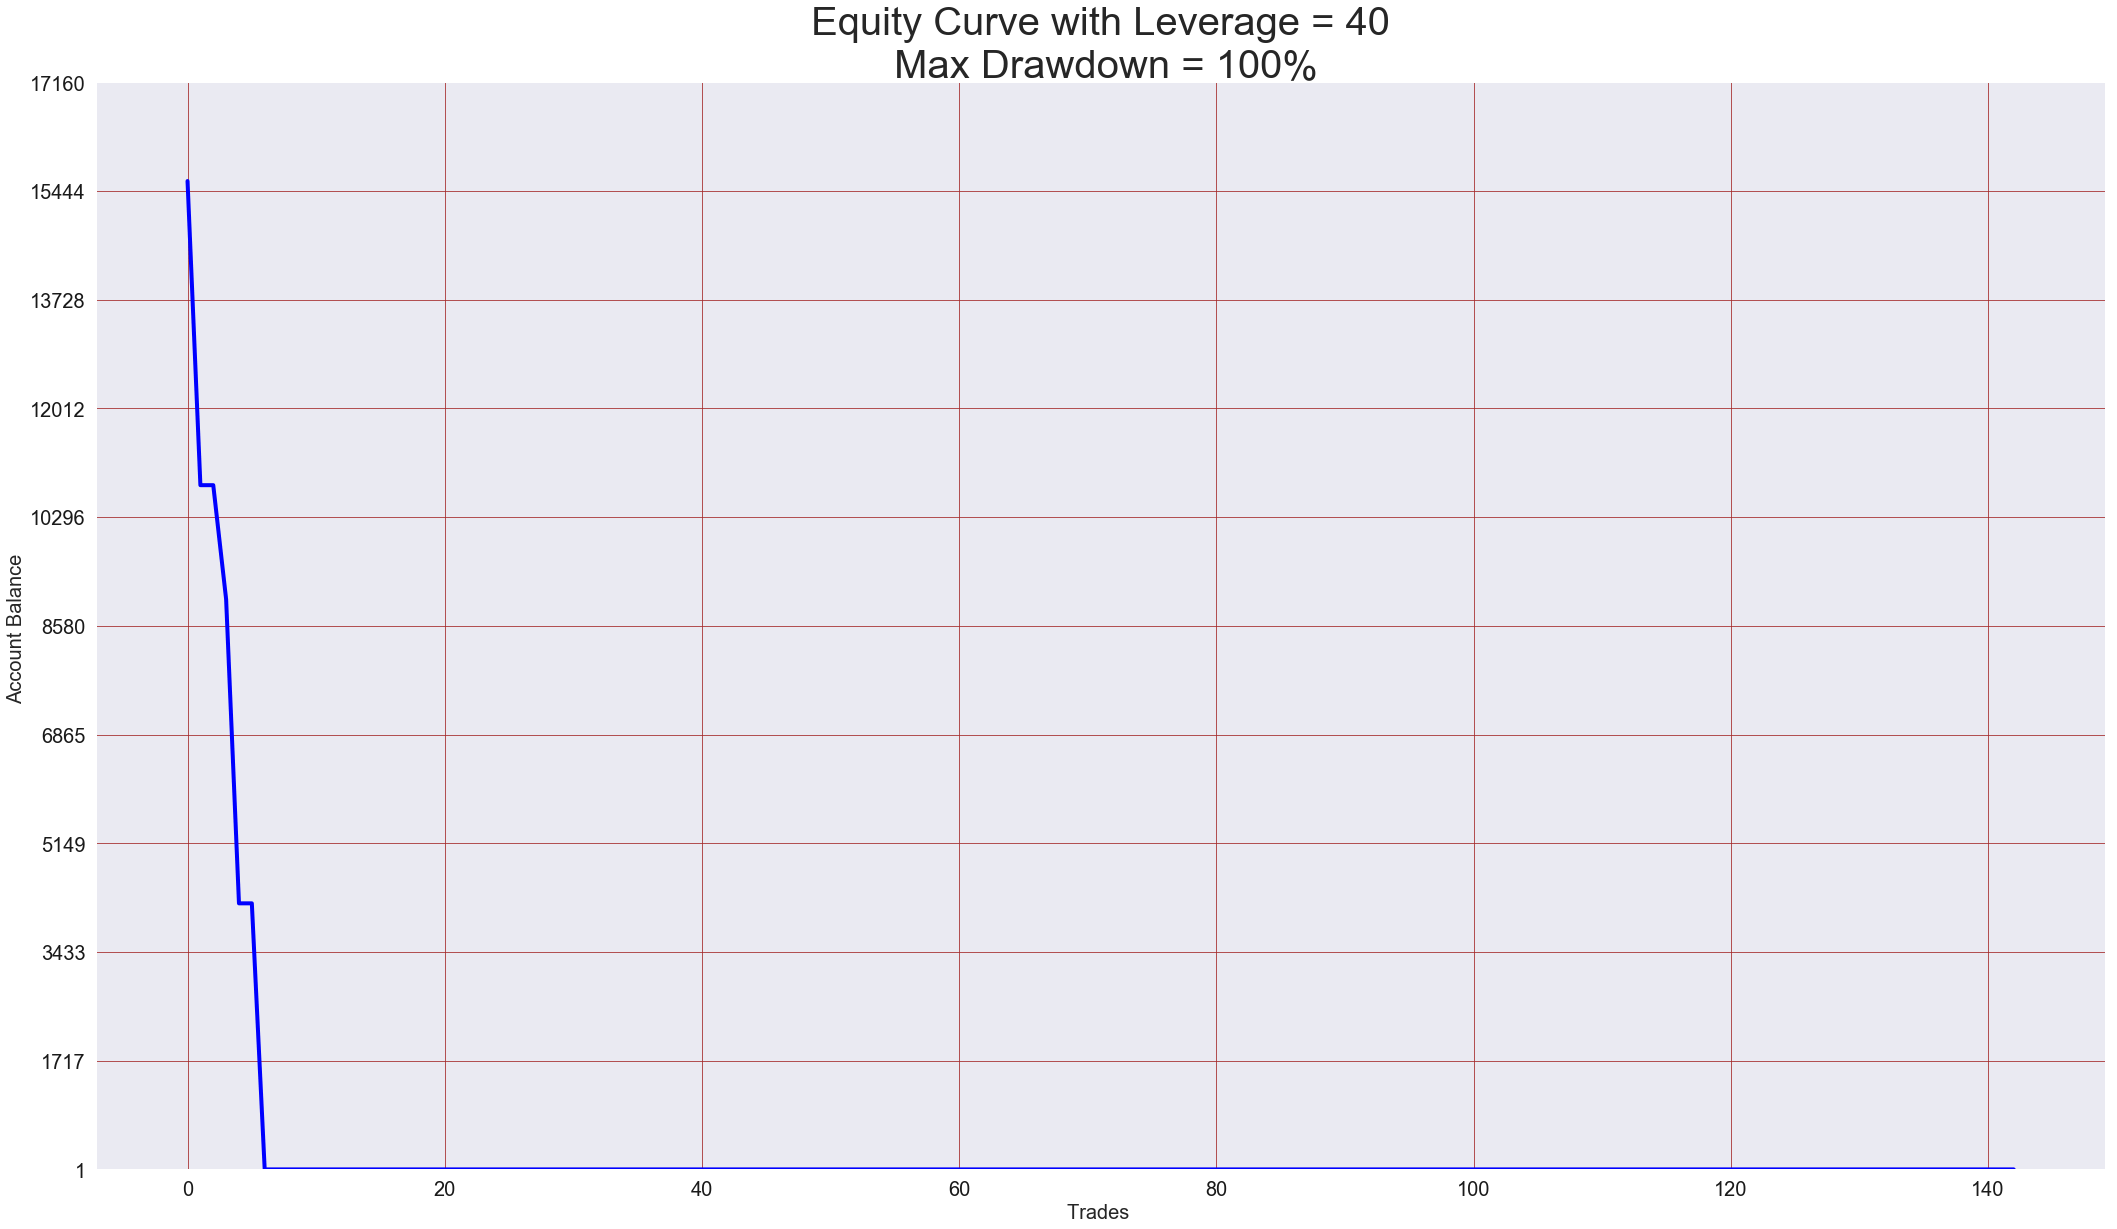
Fig 6 – 40X Leverage
We can see that at some point, the risk is too much, and a profitable system, with the wrong risk and size management, can be converted into a very fast losing system and wipe the entire account.
As we see here, a 40X leverage is wild enough to wipe an entire account using a very profitable trading system. We must understand that up to one point, increasing the leverage will increase risk while decrease profitability.
As a summary, let’s see the plot of several account histories with increasing leverage
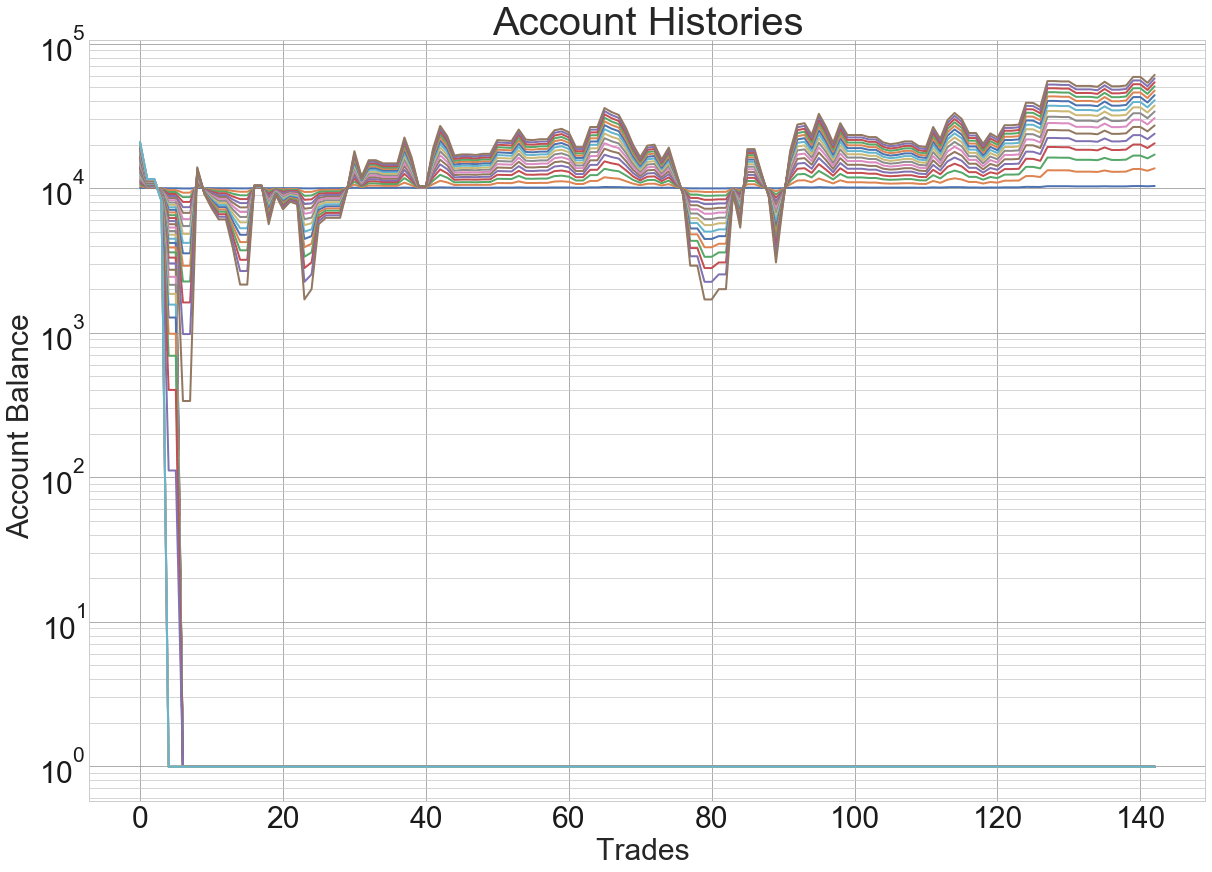
Fig 7 – 40X Leverage
This time we have plotted the histories on a semi-log scale to be aware of the enormous scale of the drawdowns. On the graph, we can see that the most critical moment of the histories happens at about trade Nr. five or six, which crashes all accounts above 30X leverage. But, if we take this event aside, we can see that to reach its destination traders must endure four more events when they lose close to 80% of their initial funds. We must take into account that at the moment of these events happening, there is no way to know when will they stop and start recovering the funds back.
A Propper Attitude Towards Risk
Position sizing and risk management are the tools traders have to accomplish their trading objectives, but it has to be done correctly.
We first need to set the daily, weekly, or monthly profitability of the trading strategy. Let keep using the previous example. We know that the system has a mean of 8.87 cents per dollar risked. Let’s suppose the system has an average of six daily trades. Then, the profitability of this system is $0.53 daily, and $10.64 monthly per dollar risked.
From the losing streak curve, we see that it is wise to be prepared for a max streak of, at least eight losing trades. Then, we define our comfort zone for drawdowns. Let say we are bold and wanted to risk up to 40% of the capital. To accomplish this, we divide the max 40% drawdown by our defined max losing streak of 8, and the result will be the maximum percent risked on every trade. In this case, Risk per trade = 5%. (That is a huge of risk, we do not recommend more than 1%, by the way).
Now, if your current account balance were $10,000, the risk per position should be 5% * 10,000, = $500. With that information, we can see that the system would deliver $5,320 monthly, on average.
If we were to double this amount, we would need to double the account balance or wait roughly two months until the profits reached the $10K mark.
The concept of applying a trade size proportional to the account balance helps traders to apply compounding growth to their accounts, while automatically reducing the trade size while in a losing streak on a dollar basis. More on compound growth will be developed in a future article.