INTRODUCTION
What is the MAE
Maximum Adverse Excursion (MAE) is a method of analysis for automatic or discretionary trading systems that allow us to objectively improve the overall operating result by positioning stops based on the statistical analysis of the development of operations from its inception to its closure.

When we study a trading system, we often find losses. Sometimes these losses are recurrent and lead us to reject a system or some of its rules. Here, the proposal is that instead of doing this, we approach the problem in another way.
As a method of improving results, John Sweeney proposes a statistical system rather than a technical one. We will not rely on indicators or the behavior of complicated logarithms, but on the statistical study differentiated from winning and losing operations. If our entry method is good, the course of price in winning trades is different from the behavior of the price of losing trades. We will not rely on indicators or the behavior of complicated logarithms, but on the statistical study differentiated from winning and losing operations.
Let’s analyze the winning trades and, above all, those that ended in losses. Are there any common features in them? Can we detect any pattern that makes us think we are in front of something usable?
There is a truth that in any trading system we must accept inescapably. At some point, we have to cut our losses. Of the many methods used for this purpose, the most common of all is price action when it distances itself from the meaning of our trade.
THE METHOD
We will track the price path during positive trades and along those that end in losses. The idea is to check the typical route of each of them and in this way, find the best way to place the system stop to achieve a better risk to reward ratio.
We will call “excursion” to the price range traveled by the price from our entrance to its end. We will distinguish the two possible directions:
Maximum Favorable Excursion: (MFE) It is the biggest advance of the price from our entrance to the exit.
Maximum Adverse Excursion: (MAE) It is the maximum retreat of the price from our entrance until the closing.
Steps
- Define our input and output rules.
- Record how much the price has moved from our entry to our departure both for and against the trade.
- Separate the winning trader’s data from losers into a table.
- Order the losers for lost categories.
- Check which patterns follow the price on losing trades and learn to recognize it.
- Set the stop according to the recognized pattern. If it behaves like a loser trade, acknowledge that we have been wrong and assume the losses.
Let’s see an example of how this methodology works.

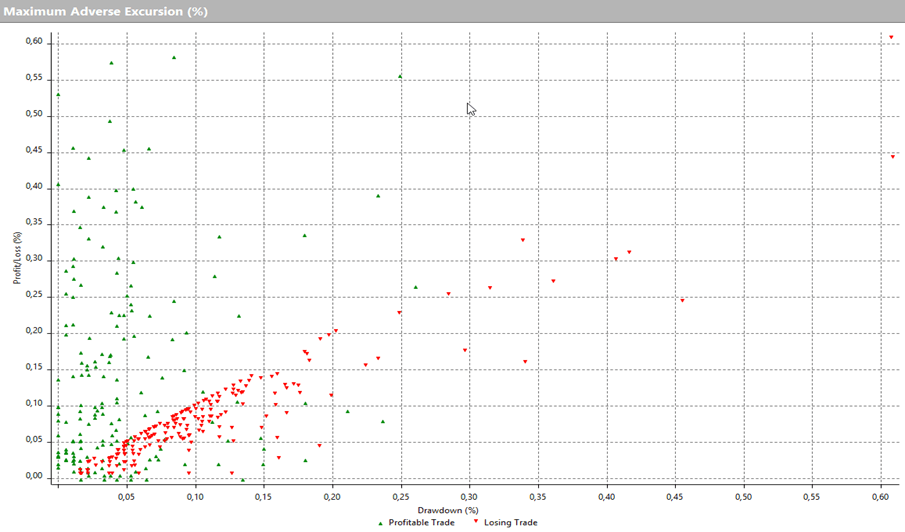
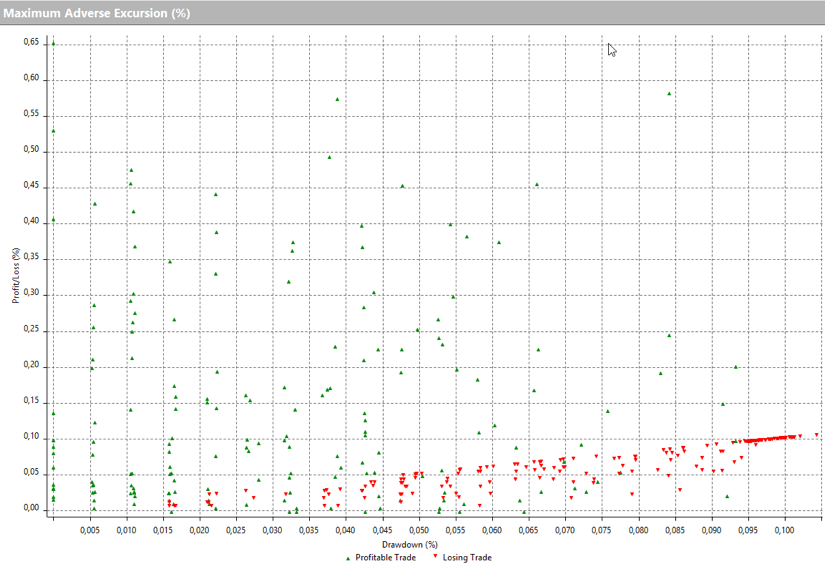
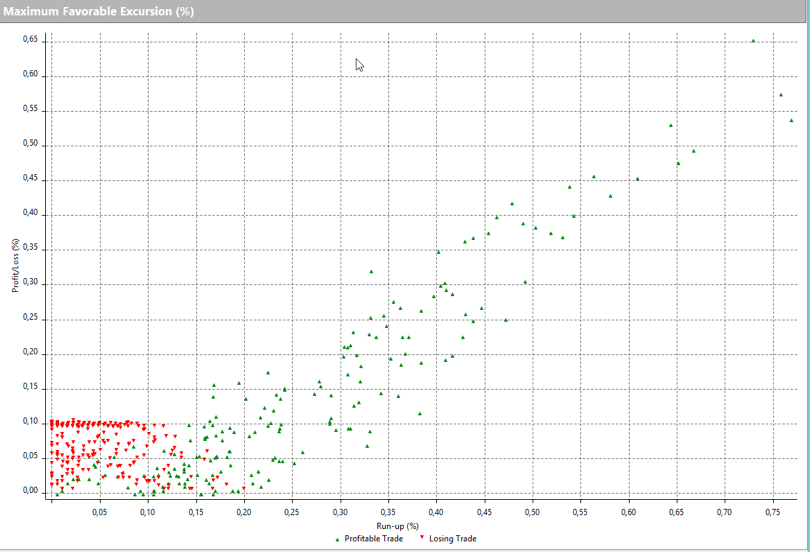
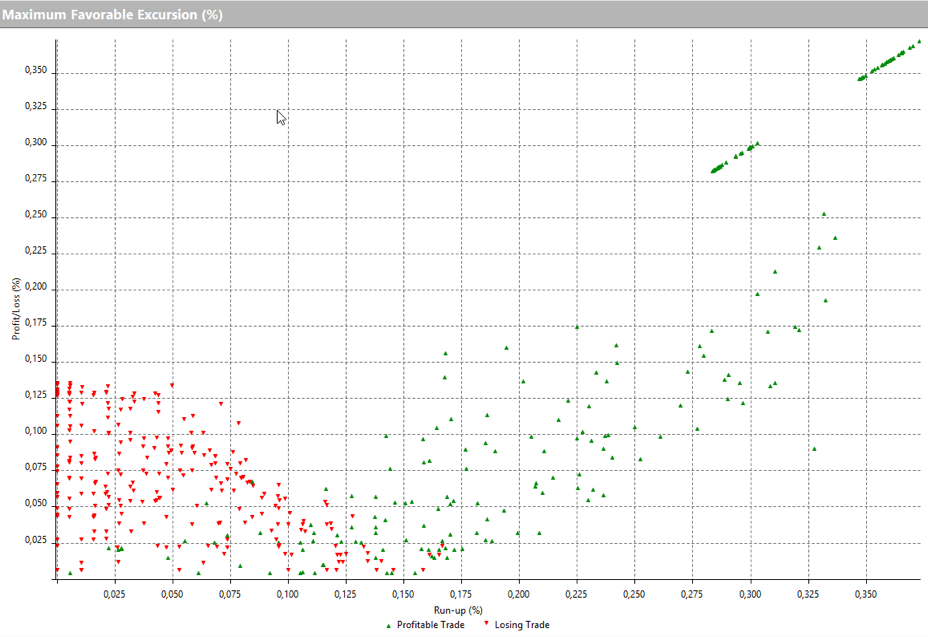
Graph of a system without stops that operates on the DAX
In the vertical axis, we can see the maximum gap of each trade before its closure (MFE). The horizontal displacement represents the maximum adverse excursion (MAE) produced before its closing.
Given the graph, it appears as relevant the level of 0.15% – 0.20% as a limit. This translates into losing trades less than 0.15% -0.20% before ending losses. We can then cut losses at 0.28% (X-axis). It is also appreciated that the vast majority of winning trades retraced less than 0.10%.
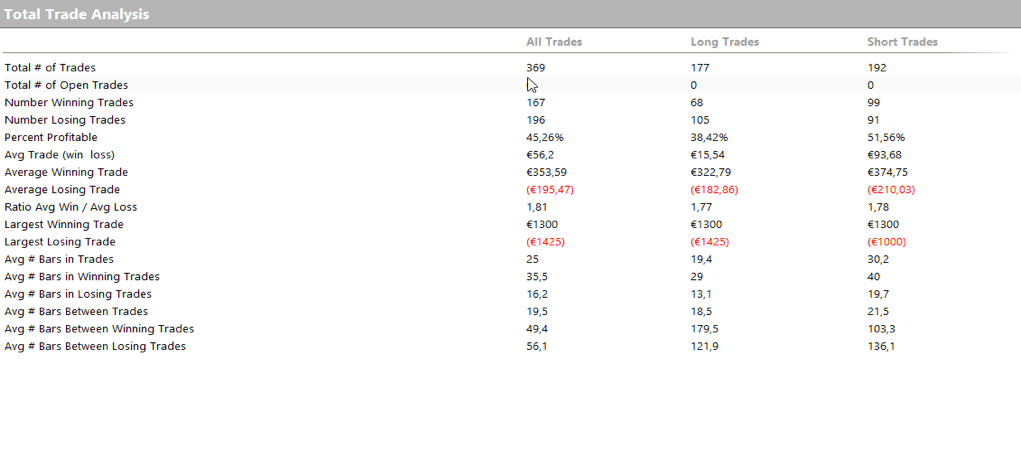
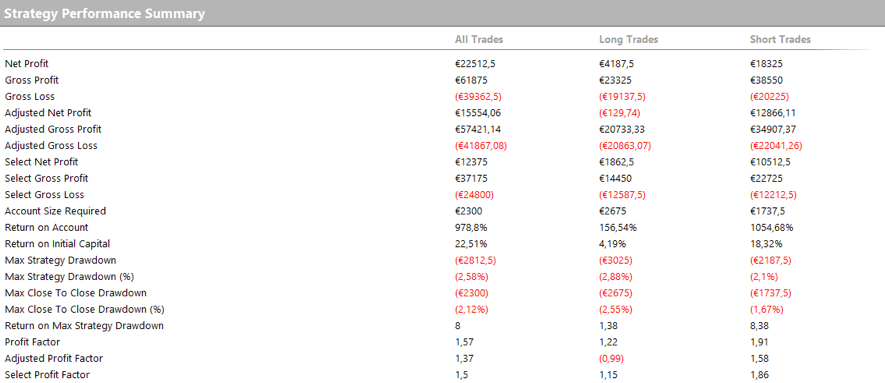
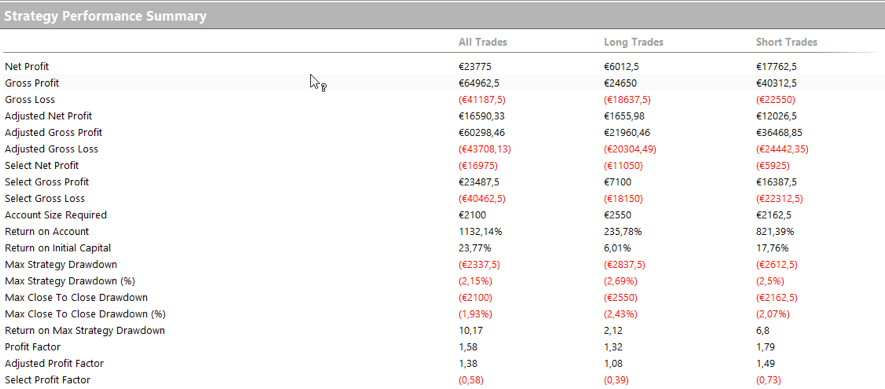
The statistics of this system before making changes are as follows.
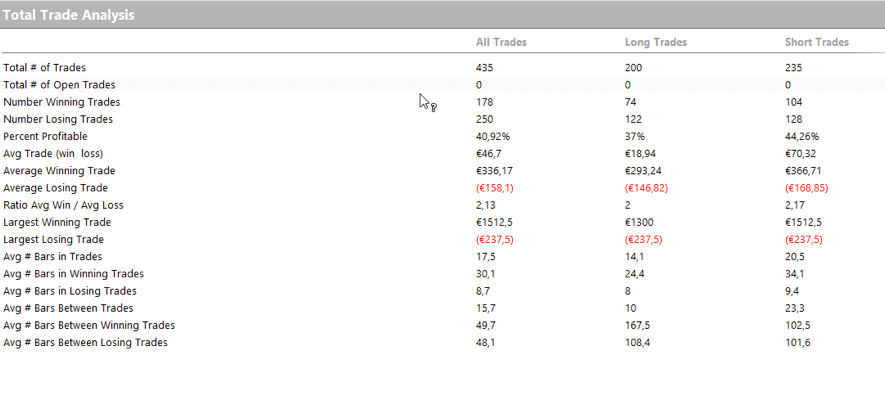
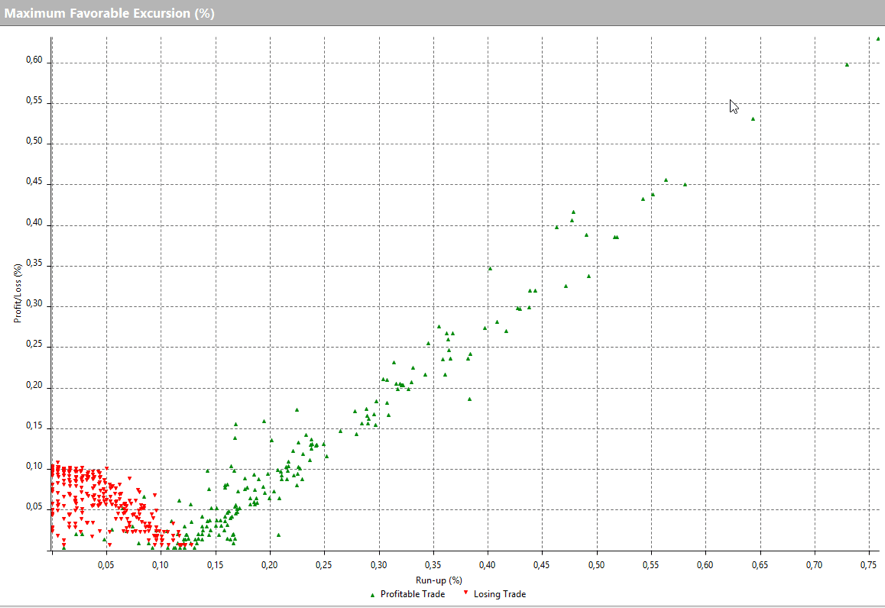
 Based on the above results, we set the stop at 0.105% of retraction, and now it looks like this.
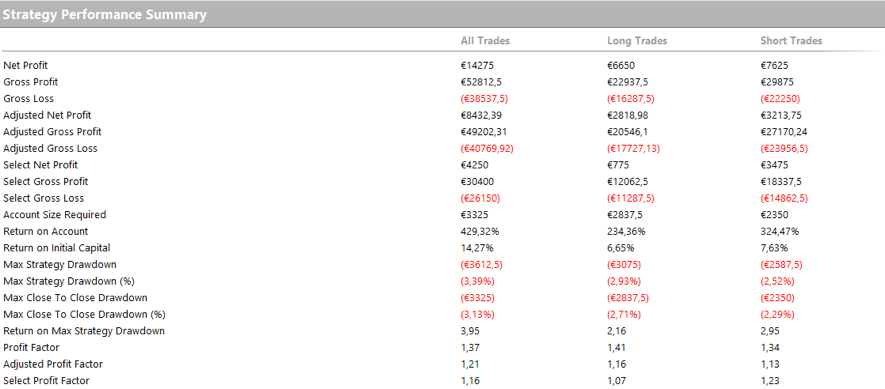
 The statistics are as follows:

Statistics have improved. First, the maximum loss has been reduced from -1425 € to -237 € as well as the average loss from -195.47 to -167.24, and the profit-loss ratio has improved from 1.81 to 2.13.
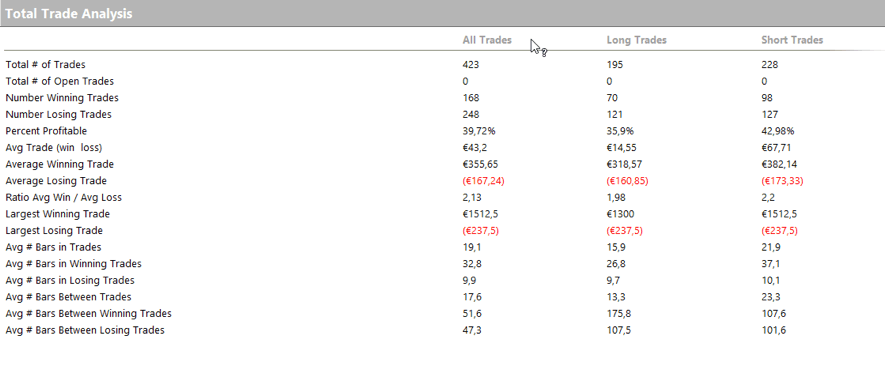
By applying a trailing stop to the system, we can improve some statistical data that will help in the general computation. The use of this type of stop is delicate because it is very easy to be touched by a momentary price retreat. However, its use at a sufficiently loose distance can prevent a trade that is very advanced from becoming lost. In our case, the average loss on the losing trades improve from 167 to 158, and the percentage of winning trades increases slightly in both the long and short sides. It would read as follows:
 Now to advance the robustness of the system, let’s look at the Maximum Favorable Excursion (MFE) by looking at the following graph.

We see the effect of the Trailing Stop. The trades advance far beyond the point at which they finally close. This is normal using this type of stop. Adjusting them further usually leads to a worsening of the final result of the set.
In the following chart, we see the effect of setting the Trailing Stop 50% closer.

Although it seems better, the total gain is worse, and the drawdown increases.
You can then compare the two options statistics, which leave no doubt.
Statistics with optimal Trailing stop:

Statistics with Trailing stop a 50% more adjusted

Maximum Favorable Excursion
The MFE is found by monitoring the maximum reached during positive operations. Often, we find that our trades end very far from this point. Obviously, our goal must be to get them to stop as close as possible to the MFE. In each particular case, we cannot expect to always close at the absolute maximum. In this case, the methods of traditional technical analysis based on indicators often betray us by getting us out of the market ahead of time or, on the contrary, keeping us while the point of maximum profit goes away.
By searching the MFE, we can detect the most likely area that the winning trades will reach. In this way, we should place our profit target at a point that’s the most probable, statistically speaking. This won’t make our system jump to an absolute possible maximum profit. However, it simplifies the system and makes it more robust by shortening the exposure time to the market.
Finally, a sample of the effect of adding a profit target, taking as reference the MFE. In this case, we separate the behavior of the MFE in the bearish bullish trades since, in the case of indexes and stocks, the market does not usually show symmetry. Experience tells us that there are different characteristics between bull markets and bear markets, although there are authors who question it.
We put a TP (Take Profit) of 27 on bullish and 33 points for the bearish.


What you see is a performance improvement. Although the improvement in net profit does not seem too important, the maximum streak of losses decreases a lot. This procedure reduces the capital necessary for its implementation, and therefore, there is a substantial improvement in percentage profitability. It also increases the net profit and especially the Profit Factor.
Minimum Favorable Excursion
Another concept to evaluate is the Minimum Favorable Excursion. It is to detect the minimum point of advance from which it is unlikely that the price returns on our entrance. This will allow us to move our stops to break even, upon reaching this area and prevent it from ending up in losses.
Conclusion
The statistical method proposed by the MAE and MFE study is revealed as a fully valid system for the study and improvement of any trading system. The use of Maximum Favorable Excursion charts gives us a way to distinguish winning trades from losing trades since they behave differently.
We can see very quickly if there are exploitable behaviors. The behavior of losing trades has its own patterns. It just advances a tiny amount in favor of the entry and then moves against it, and this allows to act consequently by cutting the losses at the right spot where statistically winning trades didn’t reach.
On the other hand, the traditional use of pivots as a reference to locate stops usually leads to losses, since it is the first place where the market seeks liquidity as it minimally weakens a trend.
Finally, the MFE allows us to put the trade into break-even at the right time or even add positions in a favorable environment. It also facilitates the tracking of profit targets. In any case, it is a highly recommended study method to improve automatic or manual systems.