Categories
Forex Daily Topic Forex Stop-loss & argets

Masteting Stop-Loss setting: How about using Kase Dev-Stops?

The stop-loss setting is a crucial component to the long-term success of a forex and crypto trader. The market forces cannot be adapted to the wishes of traders. Successful traders must accept that fact instead of fighting it for the sake of being right. “What cannot be cannot be, and, furthermore, it is impossible,” said some time ago, a well-known politician in a phrase that did not pretend to be comical. But it states a clear fact: Fight against the markets is like Don Quixote fighting Windmills.

In previous articles, we explained John Sweeney’s MAE method, and also average true range-based stop-loss settings. In this article, we are going to talk about Cynthia Kase’s Dev-Stops.

Cynthia Kase is a well-known and successful futures trader, speaker, and author of several books on trading and technical analysis. She conceded high importance to stop settings. Cynthia says something undeniable to most of us, Technical literature has mostly focused on entries, and almost nothing on entries besides some words on stop-loss or trailing stops. She says that this is like teaching how to drive a car but without explaining where the brake pedal and how to press it.

In her book “Trading with the Odds,” she explains that this situation is mostly due to greed and fear. Traders don’t like to lose, and most of them don’t know when to get out of a trade. Also, she explains that fear of losing causes people to hang on their losses in the hope the market will turn and recover them. Another explanation for this situation is that the beginning of technical analysis was on the stock market, and no company wants its stock downgraded from buy to hold or, worse, to sell. As opposed to Forex, only a handful of people make money shorting stocks, so exits are much less critical on the stock market.

Stops based on fear and greed

Most traders want to squeeze out the most of a trade. Therefore, they decided to use the highest possible leverage. To reduce the dollar risk, they desire to put it as close as possible to the entry-level. But, as said earlier, using obvious levels of support/resistance and set the stop order just two or three pips below is absurd. Better send your money directly to the charity, since they will make much better use of it than the institution that is going to collect your hard-earned money for free.

Risk is imposed by the market

The critical point is not to impose our conditions on the market, but read what the market is telling us in terms of Risk. In trading, Risk is proportional to volatility. Your dollar risk is the amount the price can move against you in a given interval, times your position size.

Volatility is measured using the Range and also by the standard deviation of prices on an annualized basis. One standard deviation of the price holds 68$ of all the potential price movement if we assume prices are dispersed in a gaussian distribution. That means that a price that goes against a trade by one standard deviation it will encompass 34% of the observations (the other 34% would go in the direction of your trade). The problem with using volatility is that a yearly measurement of the price variations does not help with sudden short-term volatility changes. That’s the reason for using ATR instead.

The concept of the threshold of Uncertainty

A trade is a bet on a market trend. We think a particular trend is in place. Ideally, the direction is a straight line between one initial level and a final level. If we think of the short-term price wiggles as random noise, we adapt our trade by placing our stops far enough away from the trend mean to include noise. The magnitude of the noise means we don’t want to exit at the minimum turn against the trade. The trader needs to devise a way to follow the trend while getting out when it ends. 

 The Kase Dev Stops

Using a fixed multiplier for the True Range is an initial approximation. In our article of true range, we used a fixed 2X multiplier to set our stop order away from the market noise. Kase’s Dev Stop uses what she calls the skew of the volatility, the measure at which a range can spike in the opposite direction as a multiplier of the range measure. That makes the Dev-stop an adaptative trailing stop. Dev Stops is a well-known indicator in TradingView. Also, it is available for downloading at the MQL5.com site for your Metatrader workstation. 

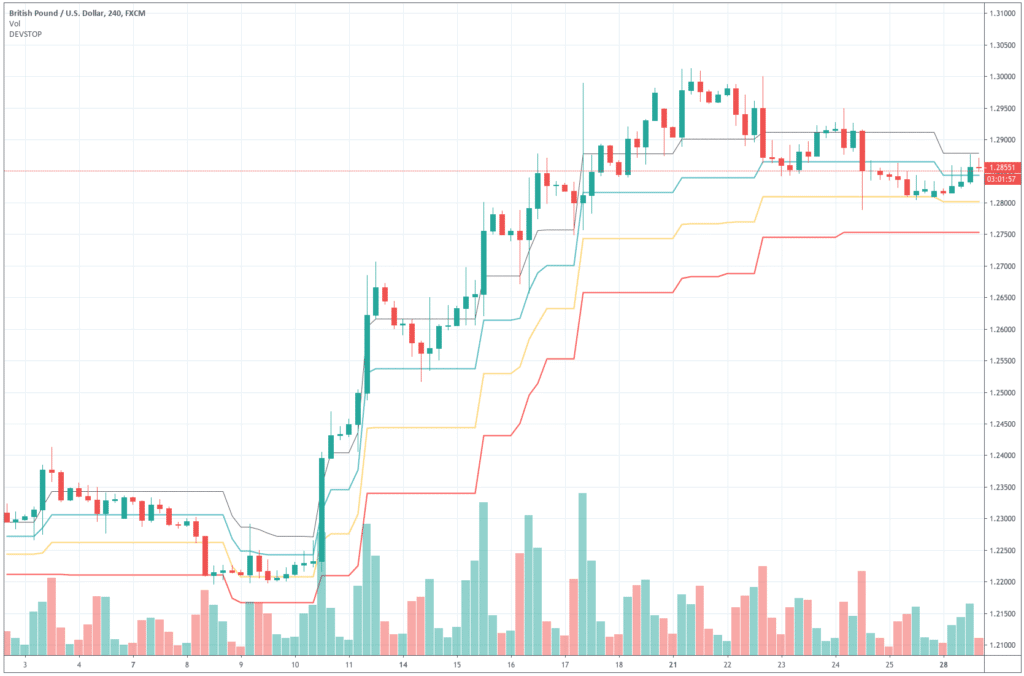
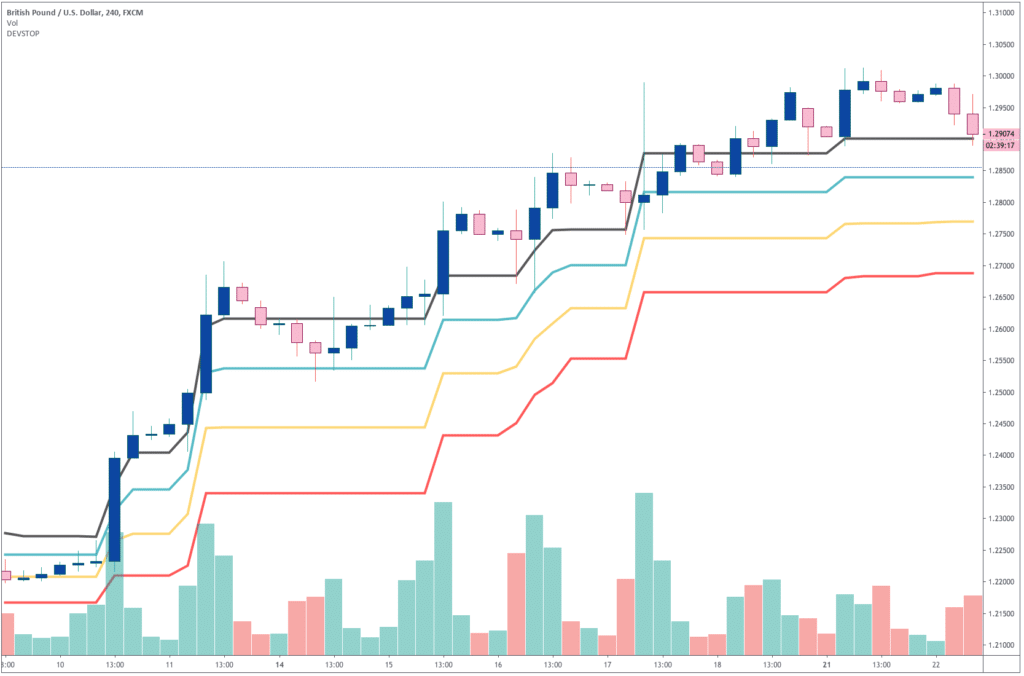
Chart 1 – Kase Dev-Stops in a GBPUSD 4H chart.

We can see in Chart 1 that four lines follow the price action. The first one is the mean line and the 1, 2, and 3 standard deviation (SD) lines of a two-bar reversal. As we can see, the 3rd standard deviation is seldom touched, being the 2-SD the conservative method, and the 1-SD the preferred aggressive method. In the case of using 1SD, it is advisable for a reentry plan, or create mental stops that would trigger if the close happens below the 1SD Dev-stop line.

As it should be the norm when learning a new method, it is strongly advisable to backtest it first to assess which SD line works better with your particular asset and objectives. Also, after backtesting your optimal solution, it is prudent to trade it using a demo account. There we could also assess the costs and benefits of the method by adding the brokerage costs.


Reference: Trading with the Odds, Cynthia A. Kase. 1996, The McGraw-Hill Companies Inc.


Categories
Forex Educational Library

Designing a Trading System (V) – Testing Exits and Stops

The importance of exits

It’s not possible to create a system based only on almost perfect entries and using random exits and stops. As we could observe in the entry testing example, the percent profitability of an entry signal is very close to 50%; a coin flip would reach that score. The real money is made directing our efforts into proper risk control, money management, and adequate exits.

Test methods for exits and stops

Testing exits independently are much more difficult than testing entries. Sometimes the entry and the exit is mingled together in a way that’s difficult to separate, for example, when trading support-resistance levels. If that’s the case, the best way is to test the entire system at once.

When it’s possible to evaluate exits by themselves Kevin J. Davey proposes two approaches:

  • Test with one or several similar entries
  • Random entry

The ideas by LeBeau and Lucas move near the same path: Their method of testing exits is to create a very generic entry signal to feed the exit method. If each exit method is tested using identical entries, it should be possible to make valid conclusions about their relative value. Not all exits work equally well with different entries, but if the entry is generic enough, we may get some feeling for the relative effectiveness of a set of exits.

Their method of testing exits is a general approach that encompasses both ways enumerated by Kevin J, Davey.  Nothing is more generic than a random entry, and a non-random entry is improved if we make it close to the type of entry we intended for our system.

Test with similar entries

The fundamental idea behind testing exits, is, of course, to see if it has an edge over a random exit or a benchmark exit. A reliable exit should make a wrong or random entry into a profitable system, and for sure, it should not make an entry system worse.

To create a generic entry signal similar to the one we have in mind for a new system, we need to classify that system. Usually, new systems fall into two categories: Trend following and return to the mean, or counter-trend.

For trend-following systems, Kevin uses an N-bar breakout entry, while for counter-trend systems he uses a relative strength index entry. An exit strategy that works well in similar entry types should work equally well with the intended entry.

Random Entry

The Idea of a random entry is to see if the exit shows an edge by itself. The way to do that is to use a random entry as the optimising parameter with more than 100 runs while keeping the exit fixed and observe what percent of the optimisations are profitable. A very successful exit might have a high percentage of successful series. That is, in my opinion, the best criteria to know if an idea for an exit is valid and has an edge.

Fig. 1 shows the EasyLanguage code for a random entry. This code is a modified version of the one that Bill Brower has explained in his book EasyLanguage Learning-by-Example Workbook. This piece of code can easily be transposed to MQL or another language.

  • Fakecount is used to iterate the optimiser to get several random entry results
  • Initbars is the minimum number of bars the system wait till a new entry signal can be triggered.
  • Randvar is the maximum of bars a random generator can deliver, and it’s added to initbars.
  • BuySell is used to test long and short positions separately 1 for longs -1 for shorts

Fig. 2 shows the 3D graph of a trail-stop exit. We observe that around 0.15%, there is the sweet spot in all random iterations (50 in this example).

In this case, at 0.15% trail stop, the number of profitable iterations were more than 30 out of 50, that is, 60% were positive.

Evaluation criteria

Besides profitability, it’s good to assess the quality of an exit signal based on Maximum Favourable Excursion (MFE) and Maximum Adverse Excursion (MAE) standards.

Those two concepts, developed by John Sweeney, define the maximum adverse excursion (MAE) that a sound signal reaches before it proceeds to run in our favour.

Fig. 3 Show a trading system without stops. We observe that there is a drawdown level beyond which there is almost no winner and mostly are losers. That level defines the MAE optimal stop.

The maximum favourable excursion is the profit level that maximises the result on average of a trading system before it starts to fade and lose profits. MFE is the complementary concept to MAE, but it is a bit harder to visualise.

In Fig. 4 we observe that for the trade in the circle the actual run-up was 0.54% while the real close was 0.3%, the difference is a substantive profit left on the table. The goal of the exit is, on average, to make that distance as short as possible. That means the trading points should be, on average, closer to the upper line, as Fig. 4 shows.

Those two concepts applied to exits mean that the exit must avoid levels beyond MAE, and it should not give back too many profits and get close to the maximum possible excursion.

Total testing

Once we have assessed the goodness of an entry system and have a collection of useful exits to compliment it, we need to test them together and see how entries and exits interact.

The main rule at this point is getting profitability in the majority of combinations of entry and exit signals. For example, if we have ten parameter values on entries and ten on the exits, we would like positive results on more than fifty. Also, I love to see smoothness on the 3D surface. Too many peaks and valleys are a sign of randomness, and it’s not good for the future behaviour of the system, as in Fig. 5


Then, we choose a point on the hill that’s surrounded by a convex and smooth surface with similar profitability. That way we are trying to prevent a change in the character of the market which would spoil the system too soon.

Fig. 6  and 7 shows the equity curve and drawdown of a mean-reverting system, and its summary report after having passed the different stages up to the final testing and selection.

With that final assessment, we have achieved the limited testing stage. Therefore, this strategy has passed the test and is a candidate to further forward analyses and optimisations.


Further readings from this series:

Forex Designing a Trading System (I) – Introduction to Systematic Trading

Designing a Trading System (II) – The Toolbox Part 1

Designing a Trading System (III) – The Toolbox Part 2

Designing a Trading System (IV) – Testing Entries


References:

Building Winning Algorithmic Trading Systems, Kevin J. Davey

Campaign Trading, John Sweeney

Computer Analysis of the Futures Markets, Charles LeBeau, George Lucas

Images were taken with permission from Multicharts 11, trading platform.

 ©Forex.Academy
Categories
Forex Educational Library

Maximum Adverse Excursion

INTRODUCTION

What is the MAE

Maximum Adverse Excursion (MAE) is a method of analysis for automatic or discretionary trading systems that allow us to objectively improve the overall operating result by positioning stops based on the statistical analysis of the development of operations from its inception to its closure.

When we study a trading system, we often find losses. Sometimes these losses are recurrent and lead us to reject a system or some of its rules. Here, the proposal is that instead of doing this, we approach the problem in another way.

As a method of improving results, John Sweeney proposes a statistical system rather than a technical one. We will not rely on indicators or the behavior of complicated logarithms, but on the statistical study differentiated from winning and losing operations. If our entry method is good, the course of price in winning trades is different from the behavior of the price of losing trades. We will not rely on indicators or the behavior of complicated logarithms, but on the statistical study differentiated from winning and losing operations.

Let’s analyze the winning trades and, above all, those that ended in losses. Are there any common features in them? Can we detect any pattern that makes us think we are in front of something usable?

There is a truth that in any trading system we must accept inescapably. At some point, we have to cut our losses. Of the many methods used for this purpose, the most common of all is price action when it distances itself from the meaning of our trade.

THE METHOD

We will track the price path during positive trades and along those that end in losses. The idea is to check the typical route of each of them and in this way, find the best way to place the system stop to achieve a better risk to reward ratio.

We will call “excursion” to the price range traveled by the price from our entrance to its end. We will distinguish the two possible directions:

Maximum Favorable Excursion: (MFE) It is the biggest advance of the price from our entrance to the exit.

Maximum Adverse Excursion: (MAE) It is the maximum retreat of the price from our entrance until the closing.

Steps

  1. Define our input and output rules.
  2. Record how much the price has moved from our entry to our departure both for and against the trade.
  3. Separate the winning trader’s data from losers into a table.
  4. Order the losers for lost categories.
  5. Check which patterns follow the price on losing trades and learn to recognize it.
  6. Set the stop according to the recognized pattern. If it behaves like a loser trade, acknowledge that we have been wrong and assume the losses.

Let’s see an example of how this methodology works.

Graph of a system without stops that operates on the DAX

In the vertical axis, we can see the maximum gap of each trade before its closure (MFE). The horizontal displacement represents the maximum adverse excursion (MAE) produced before its closing.

Given the graph, it appears as relevant the level of 0.15% – 0.20% as a limit. This translates into losing trades less than 0.15% -0.20% before ending losses. We can then cut losses at 0.28% (X-axis). It is also appreciated that the vast majority of winning trades retraced less than 0.10%.

The statistics of this system before making changes are as follows.

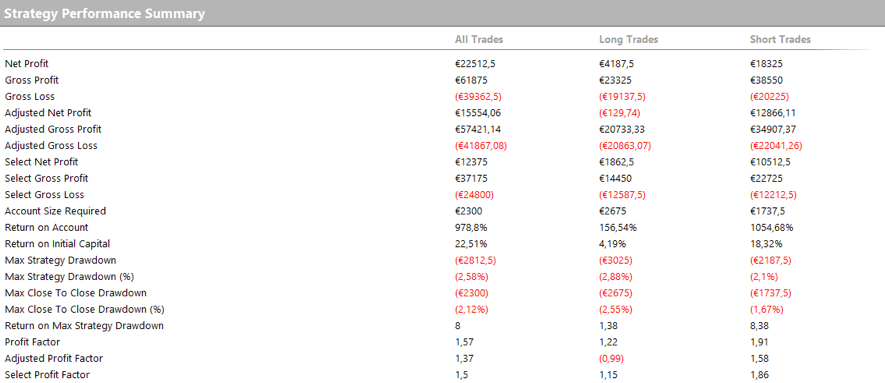
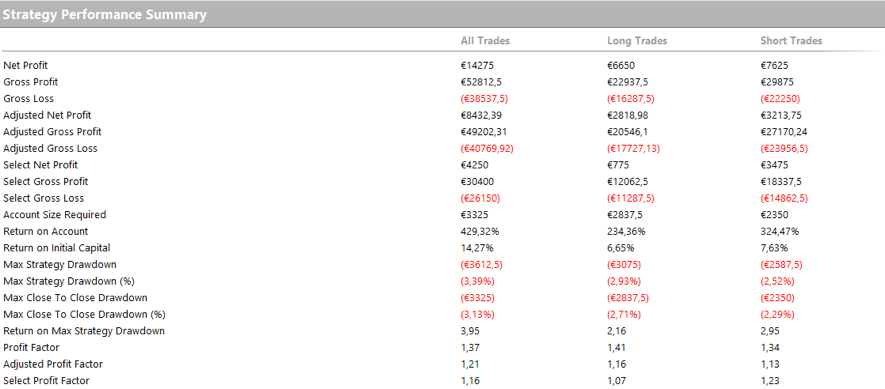
Based on the above results, we set the stop at 0.105% of retraction, and now it looks like this.

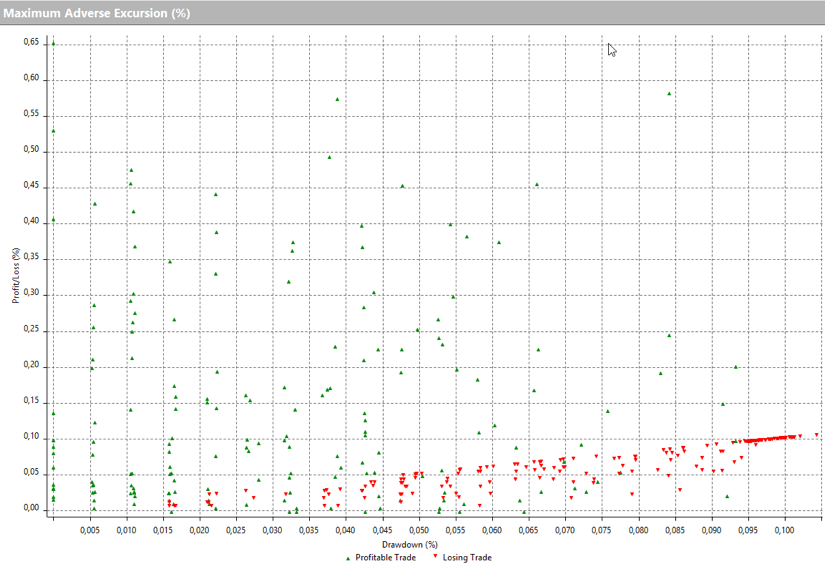
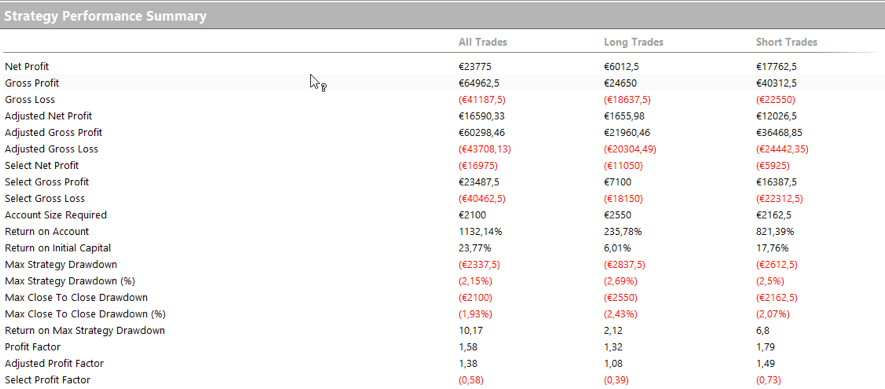
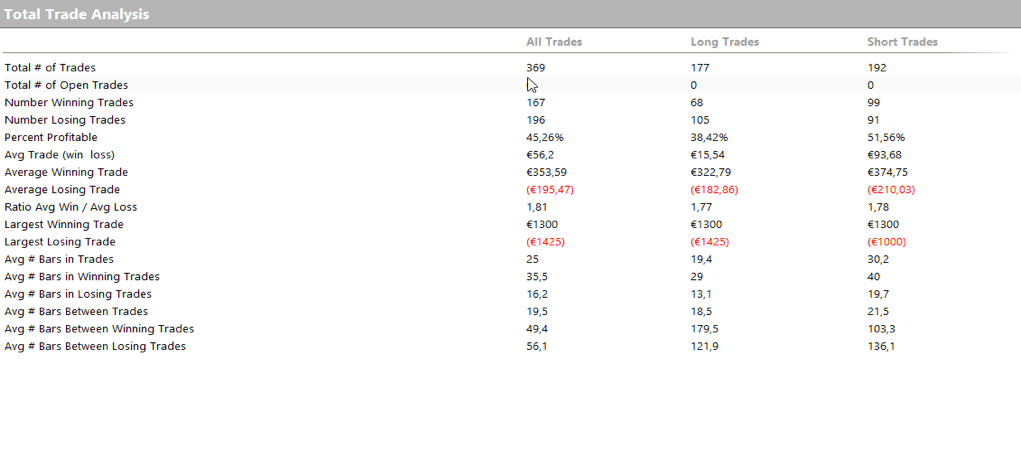
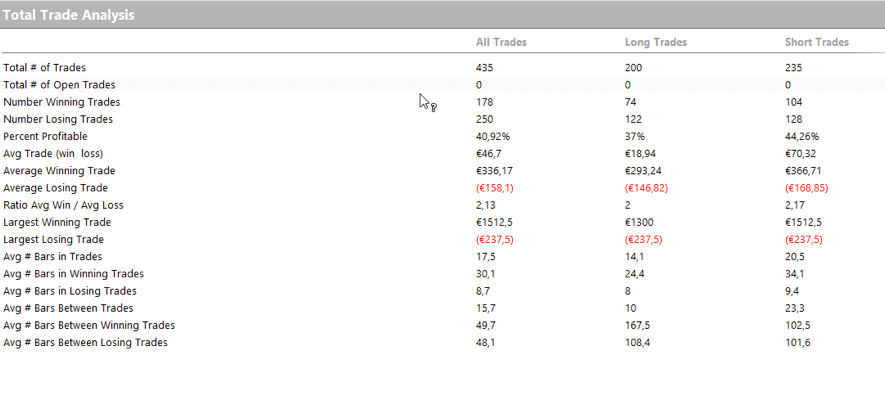
The statistics are as follows:

Statistics have improved. First, the maximum loss has been reduced from -1425 € to -237 € as well as the average loss from -195.47 to -167.24, and the profit-loss ratio has improved from 1.81 to 2.13.

By applying a trailing stop to the system, we can improve some statistical data that will help in the general computation. The use of this type of stop is delicate because it is very easy to be touched by a momentary price retreat. However, its use at a sufficiently loose distance can prevent a trade that is very advanced from becoming lost. In our case, the average loss on the losing trades improve from 167 to 158, and the percentage of winning trades increases slightly in both the long and short sides. It would read as follows:

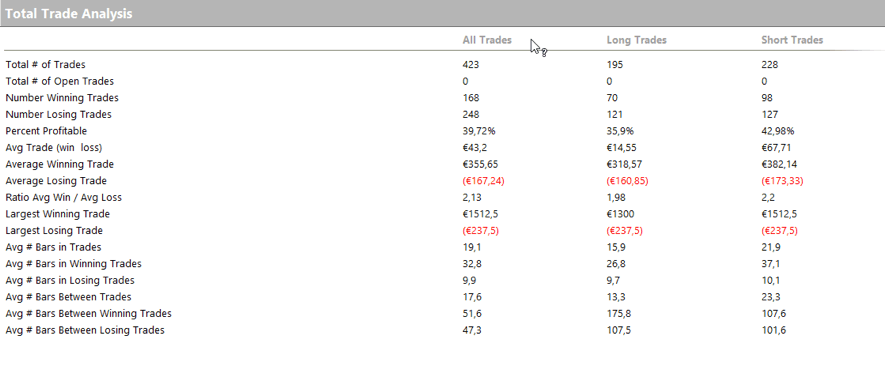
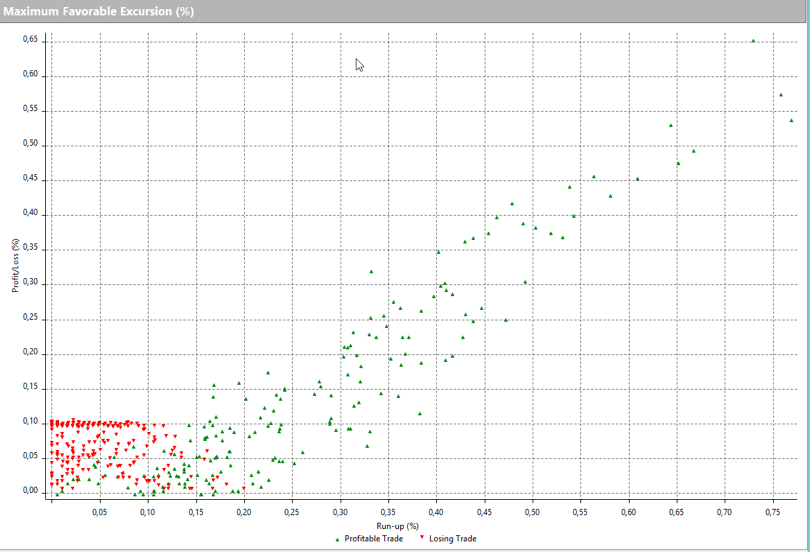
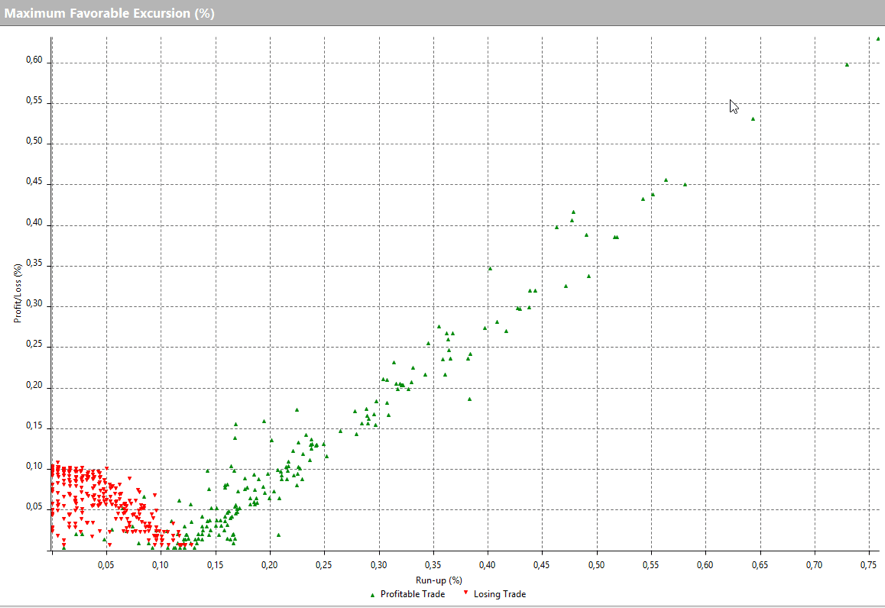
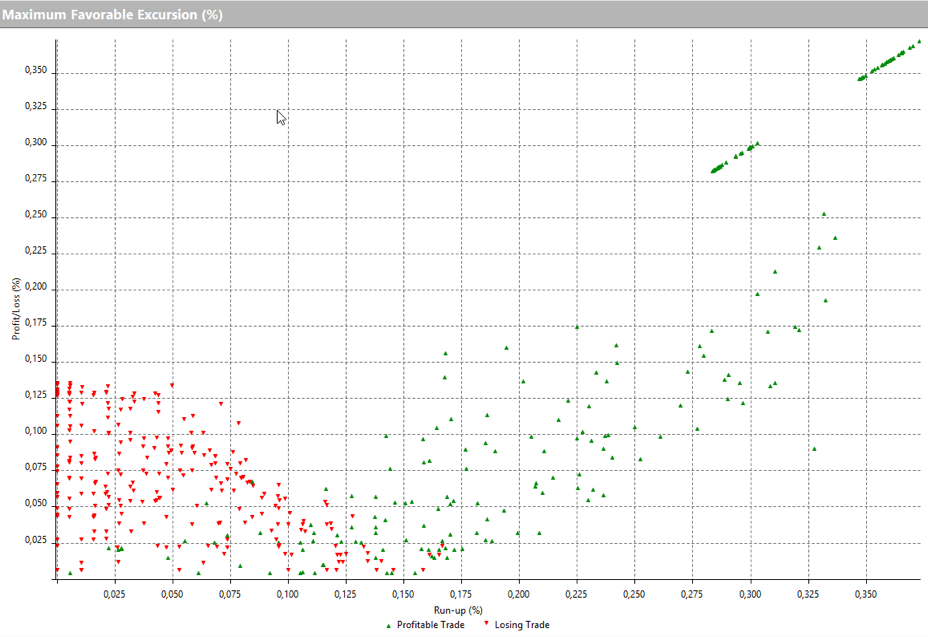
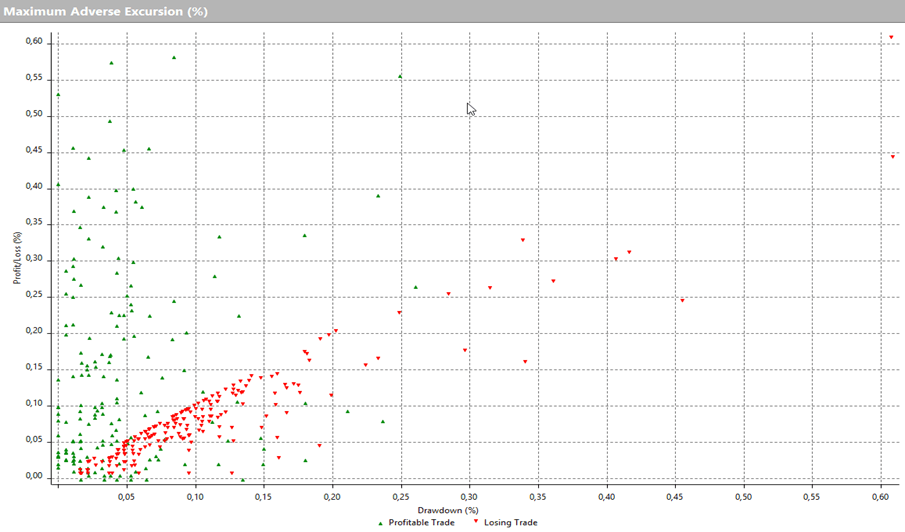
Now to advance the robustness of the system, let’s look at the Maximum Favorable Excursion (MFE) by looking at the following graph.

We see the effect of the Trailing Stop. The trades advance far beyond the point at which they finally close. This is normal using this type of stop. Adjusting them further usually leads to a worsening of the final result of the set.

In the following chart, we see the effect of setting the Trailing Stop 50% closer.

Although it seems better, the total gain is worse, and the drawdown increases.

You can then compare the two options statistics, which leave no doubt.

Statistics with optimal Trailing stop:

Statistics with Trailing stop a 50% more adjusted

Maximum Favorable Excursion

The MFE is found by monitoring the maximum reached during positive operations. Often, we find that our trades end very far from this point. Obviously, our goal must be to get them to stop as close as possible to the MFE. In each particular case, we cannot expect to always close at the absolute maximum. In this case, the methods of traditional technical analysis based on indicators often betray us by getting us out of the market ahead of time or, on the contrary, keeping us while the point of maximum profit goes away.

By searching the MFE, we can detect the most likely area that the winning trades will reach. In this way, we should place our profit target at a point that’s the most probable, statistically speaking. This won’t make our system jump to an absolute possible maximum profit. However, it simplifies the system and makes it more robust by shortening the exposure time to the market.

Finally, a sample of the effect of adding a profit target, taking as reference the MFE. In this case, we separate the behavior of the MFE in the bearish bullish trades since, in the case of indexes and stocks, the market does not usually show symmetry. Experience tells us that there are different characteristics between bull markets and bear markets, although there are authors who question it.

We put a TP (Take Profit) of 27 on bullish and 33 points for the bearish.

What you see is a performance improvement. Although the improvement in net profit does not seem too important, the maximum streak of losses decreases a lot. This procedure reduces the capital necessary for its implementation, and therefore, there is a substantial improvement in percentage profitability. It also increases the net profit and especially the Profit Factor.

Minimum Favorable Excursion

Another concept to evaluate is the Minimum Favorable Excursion. It is to detect the minimum point of advance from which it is unlikely that the price returns on our entrance. This will allow us to move our stops to break even, upon reaching this area and prevent it from ending up in losses.

Conclusion

The statistical method proposed by the MAE and MFE study is revealed as a fully valid system for the study and improvement of any trading system. The use of Maximum Favorable Excursion charts gives us a way to distinguish winning trades from losing trades since they behave differently.

We can see very quickly if there are exploitable behaviors. The behavior of losing trades has its own patterns. It just advances a tiny amount in favor of the entry and then moves against it, and this allows to act consequently by cutting the losses at the right spot where statistically winning trades didn’t reach.

On the other hand, the traditional use of pivots as a reference to locate stops usually leads to losses, since it is the first place where the market seeks liquidity as it minimally weakens a trend.

Finally, the MFE allows us to put the trade into break-even at the right time or even add positions in a favorable environment. It also facilitates the tracking of profit targets. In any case, it is a highly recommended study method to improve automatic or manual systems.

 ©Forex.Academy