Categories
Forex Daily Topic Forex System Design

Trading System design -Creating Your Strategy with Tradingview’s Pine Script – Part 2

In part 1 of this article series, we have created the Stochastic RSI indicator as part of our idea for a scalping strategy. Now that we have it functional, we will make the bull/bear phases and visually inspect whether it captures the turning market’s turning points.

Possible ways to create bull/bear slices

Our Stochastic RSI consists of two lines, k and d, and two trigger lines, ob and os. Therefore we can use multiple variants that may allow the creation of bull/bear price legs. Let’s consider the following 3

Variant 1 – The transition occurs at the SRSI entrance of the oversold or overbought regions.

Bull: The d-line crosses under the ob-line, which indicates it is into the overbought area
Bear: The d-line crosses over the os-line, indicating d‘s entry into the oversold area.

Code:
if crossunder (d, os)
    SRSI_Long := true
    SRSI_Short := false
else if crossover (d, ob)
    SRSI_Long := false
    SRSI_Short := true 
else
    SRSI_Long := SRSI_Long[1]
    SRSI_Short := SRSI_Short[1]

This code creates a condition SRSI_Long at the cross of d under os, which holds until d crosses over ob and reverses it, creating an SRSI_Short state. This condition is only modified by d crossing under os.
The else statement ensures the condition does not change from the previous bar.

Once we have defined the bull and bear segments, we can color-shade them to visualize them in the chart. To do it, we will use the bgcolor() function.

bgcolor(SRSI_Long ? color.green: na)
bgcolor(SRSI_Short ? color.red: na)

The first statement asks the condition of SRI-Long ( the ? sign). If true, the background color changes to green. Otherwise, no change (an). The second statement behaves similarly for SRSI_Short.

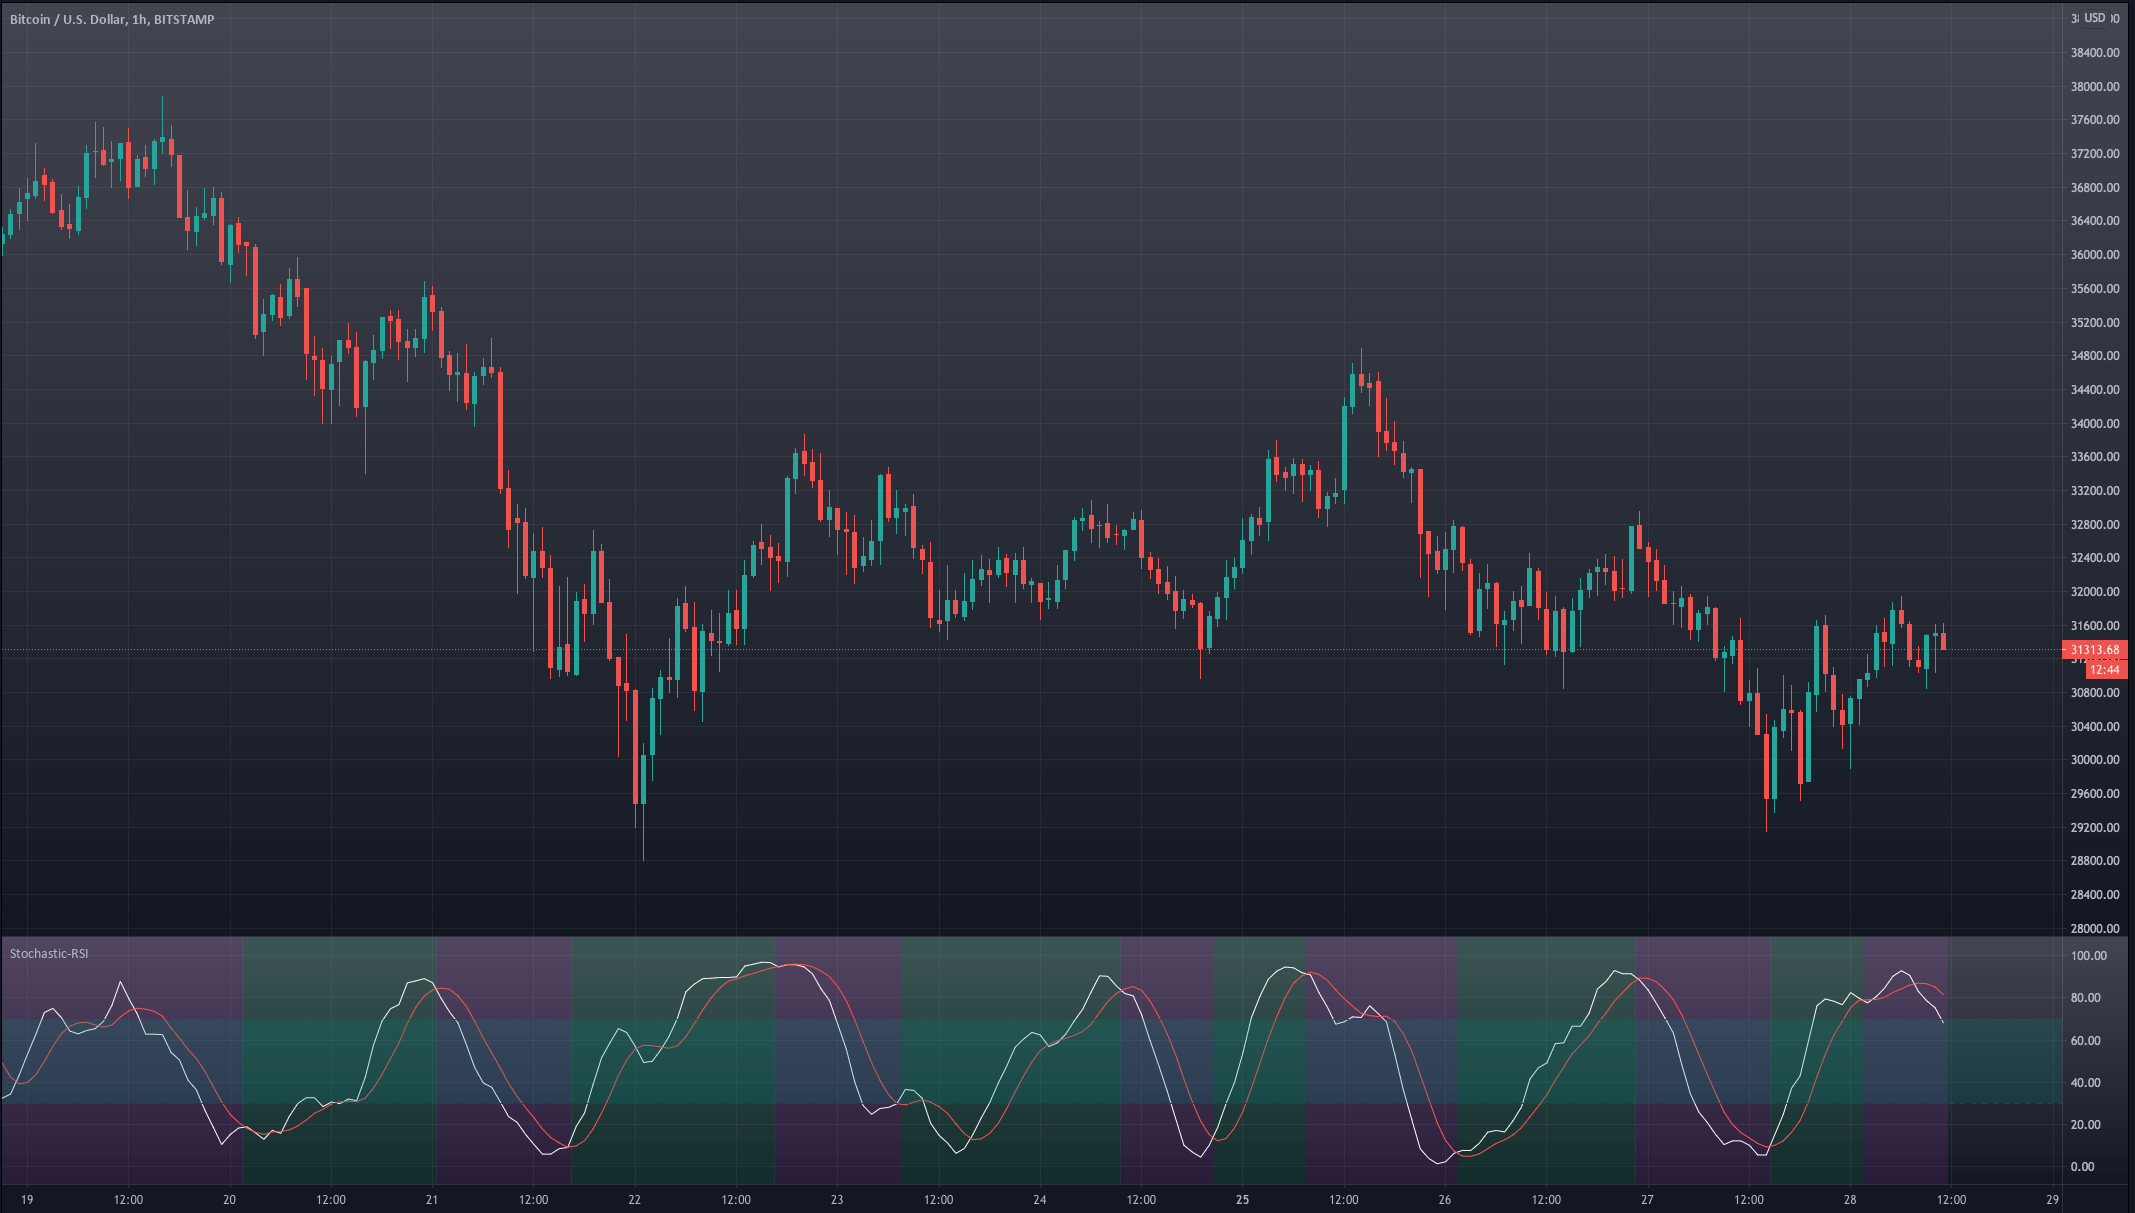
Let’s see how this piece of code behaves in the BTCUSD chart.
Variant 1 triggers the transitions too early. We see that on many occasions when the stochastic RSI enters the overbought or oversold region, it is more a signal of trend strength than a turning point.


Variant 2 – The transition occurs at D and K’s crossovers if in the overbought/oversold regions.

Bull: the k-line crosses over the d-line, if below os ( inside the oversold region. We ignore crosses in the mid-area)
Bear: the k-line crosses under the d-line, if above ob ( in the overbought area. We ignore crosses in the mid-area)

Code:

// creating the long and short conditions for case 2

if crossover(k,d) and d < os
     SRSI_Long := true
     SRSI_Short := false

else if crossunder(k,d) and d > ob
     SRSI_Long := false
     SRSI_Short := true
else
     SRSI_Long := SRSI_Long[1]
     SRSI_Short := SRSI_Short[1]
// bacground color change
bgcolor(SRSI_Long ? color.green: na) 
bgcolor(SRSI_Short ? color.red: na)

The last section for the background change is similar to Variant 1.

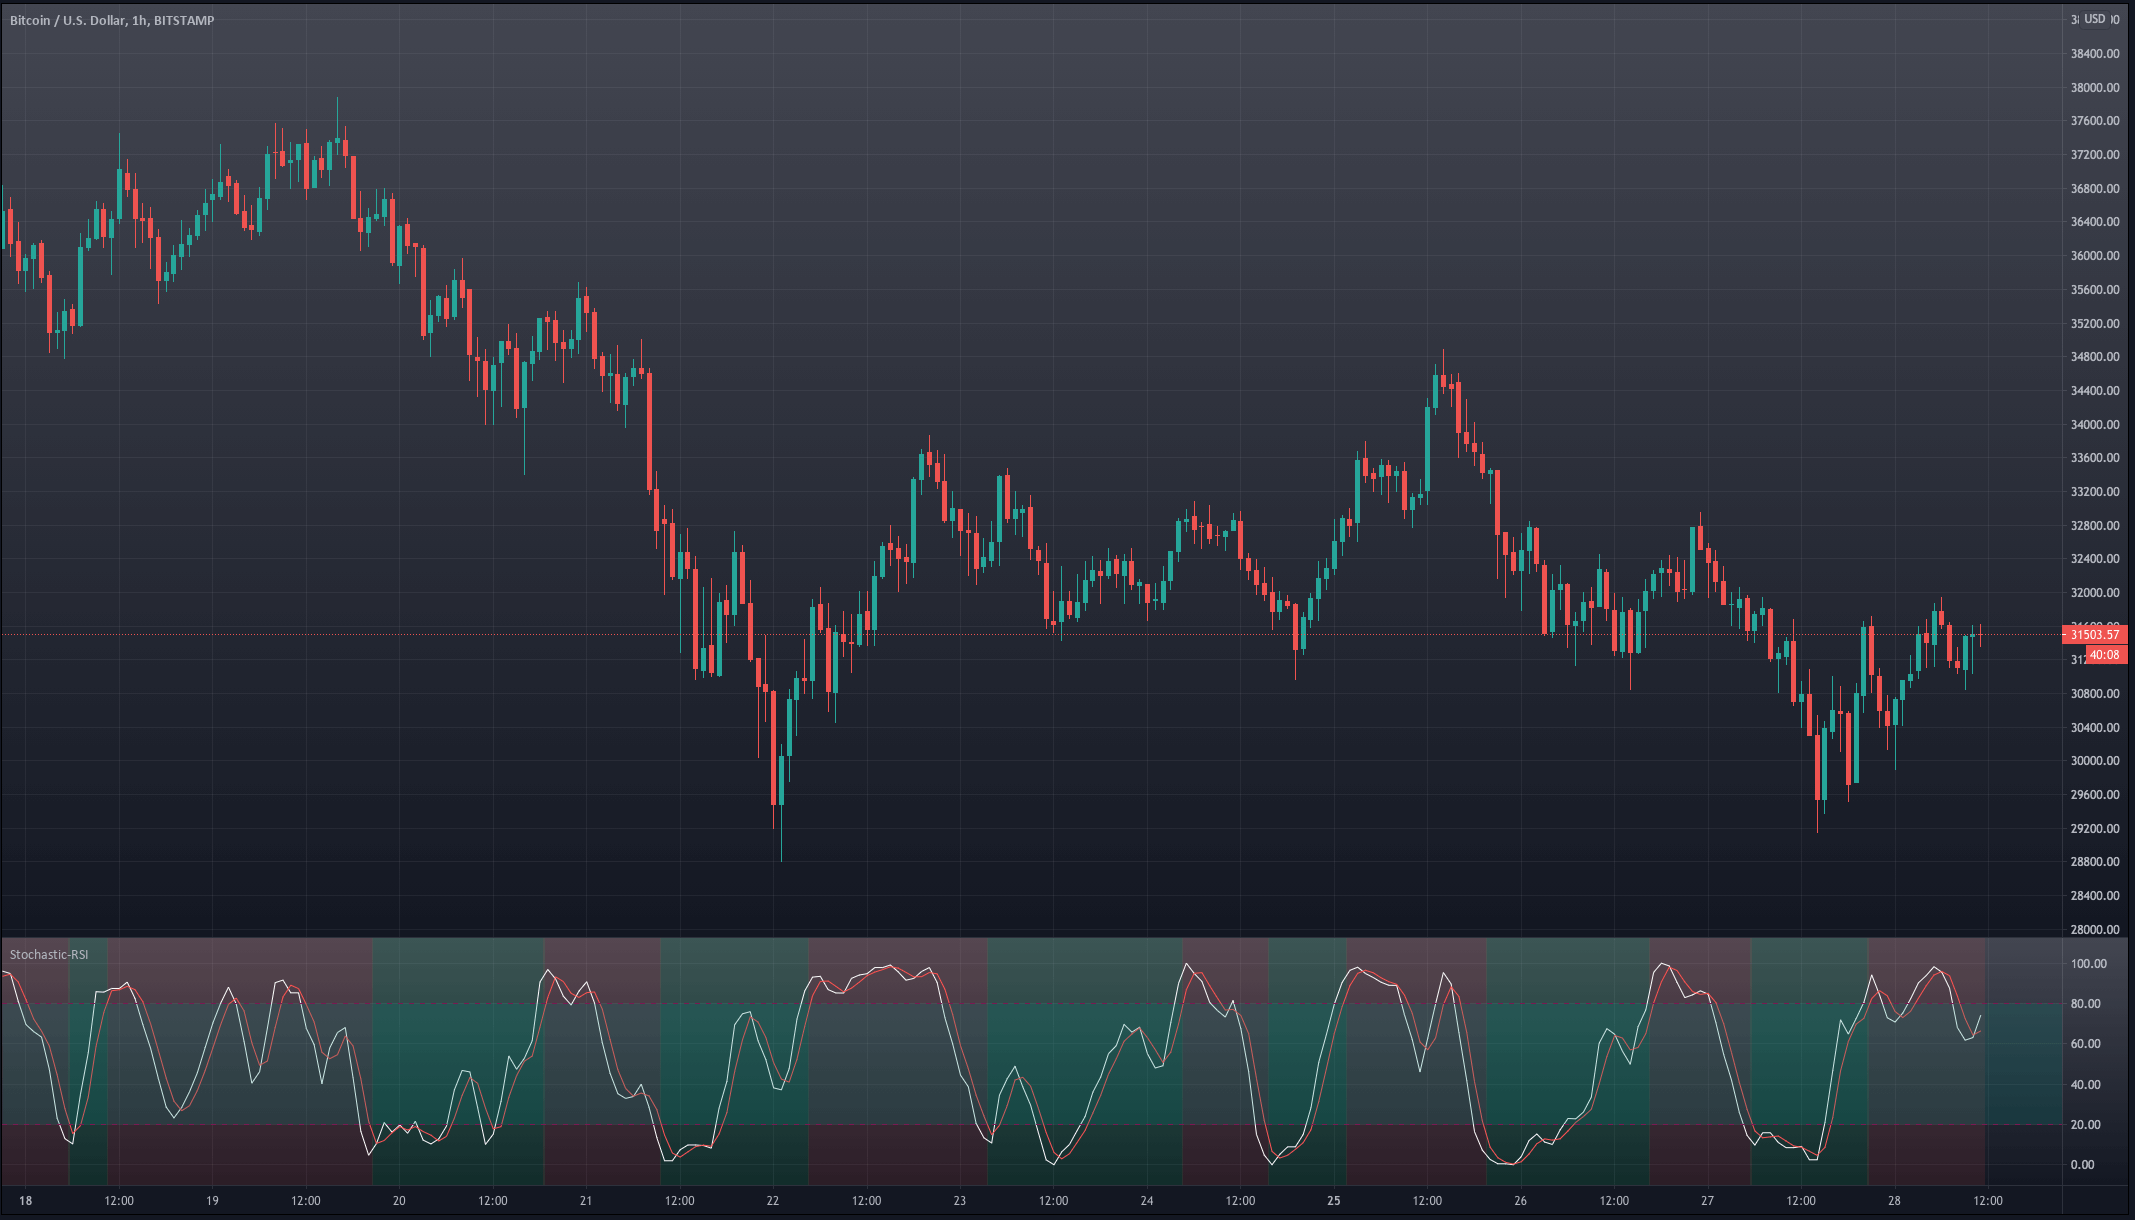
Let’s see how it behaves in the chart.

Variant 2 is an improvement. We see that the bull and bear phases match the actual movements of the market, although entries are still a bit early, and in some cases, it missed the right direction. It can be useful as a trigger signal, provided we can filter out the faulty signals.


Variant 3 – the transition occurs when d moved to the overbought or oversold region and, later, crosses to the mid-area.

Bull: the d-line crosses over the os-line
Bear: the d-line crosses under the ob-line.

if crossover (d, os)
    SRSI_Long := true
    SRSI_Short := false
else if crossunder (d, ob)
    SRSI_Long := false
    SRSI_Short := true 
else
    SRSI_Long := SRSI_Long[1]
    SRSI_Short := SRSI_Short[1]
// bacground color change
bgcolor(SRSI_Long ? color.green: na) 
bgcolor(SRSI_Short ? color.red: na)


And this is how it behaves in the chart.
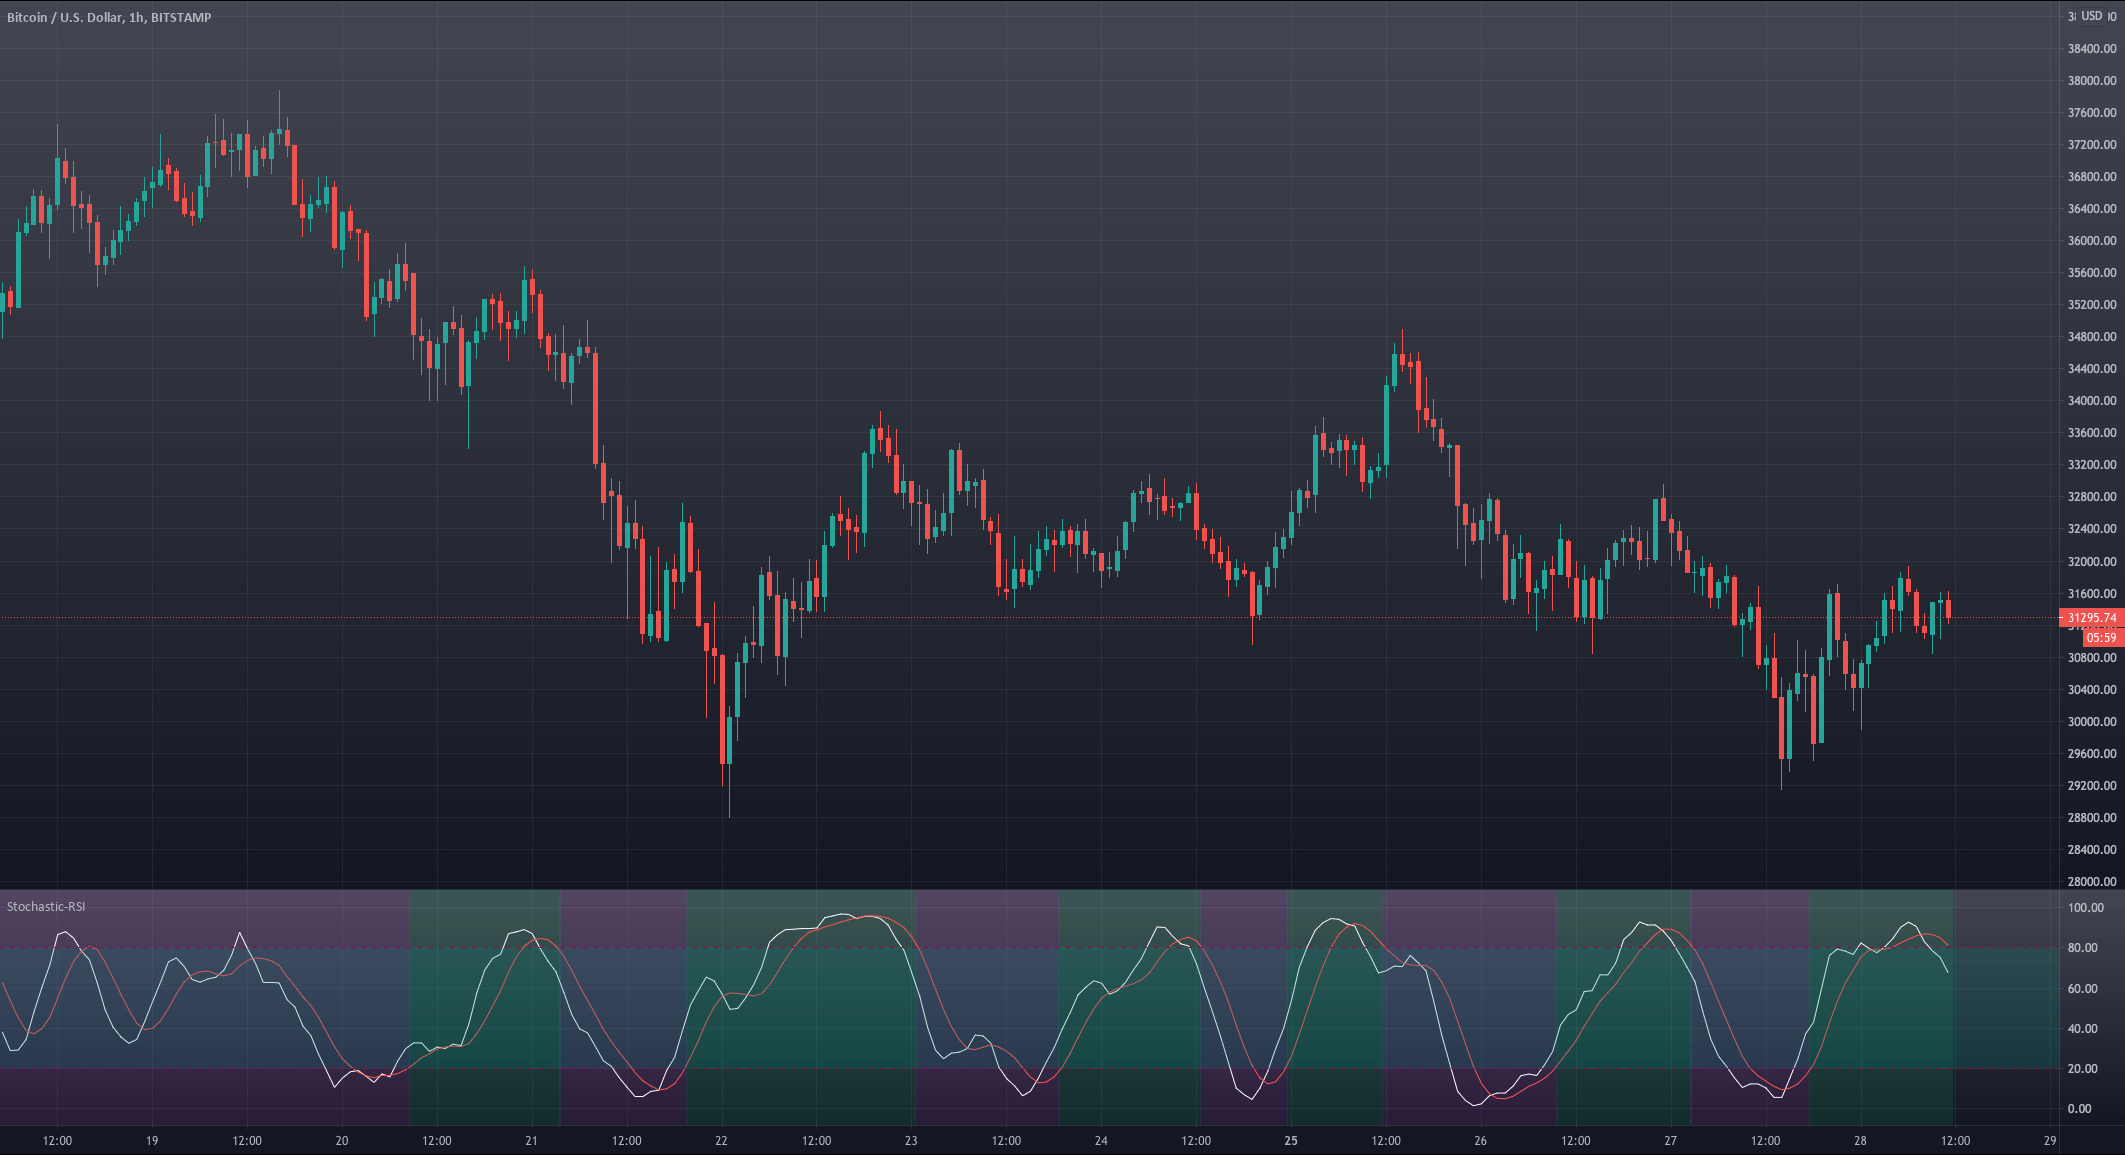

Variant 3 lags the turning points slightly, but this quality makes it more robust, as, on most occasions, it’s right about the market direction. This signal, combined with the right take-profit, may create a high-probability trade strategy.

Let’s try this one. But this will be resolved in our next and last article of this series.

Stay tuned!

Categories
Forex Educational Library

Designing a Trading System (V) – Testing Exits and Stops

The importance of exits

It’s not possible to create a system based only on almost perfect entries and using random exits and stops. As we could observe in the entry testing example, the percent profitability of an entry signal is very close to 50%; a coin flip would reach that score. The real money is made directing our efforts into proper risk control, money management, and adequate exits.

Test methods for exits and stops

Testing exits independently are much more difficult than testing entries. Sometimes the entry and the exit is mingled together in a way that’s difficult to separate, for example, when trading support-resistance levels. If that’s the case, the best way is to test the entire system at once.

When it’s possible to evaluate exits by themselves Kevin J. Davey proposes two approaches:

  • Test with one or several similar entries
  • Random entry

The ideas by LeBeau and Lucas move near the same path: Their method of testing exits is to create a very generic entry signal to feed the exit method. If each exit method is tested using identical entries, it should be possible to make valid conclusions about their relative value. Not all exits work equally well with different entries, but if the entry is generic enough, we may get some feeling for the relative effectiveness of a set of exits.

Their method of testing exits is a general approach that encompasses both ways enumerated by Kevin J, Davey.  Nothing is more generic than a random entry, and a non-random entry is improved if we make it close to the type of entry we intended for our system.

Test with similar entries

The fundamental idea behind testing exits, is, of course, to see if it has an edge over a random exit or a benchmark exit. A reliable exit should make a wrong or random entry into a profitable system, and for sure, it should not make an entry system worse.

To create a generic entry signal similar to the one we have in mind for a new system, we need to classify that system. Usually, new systems fall into two categories: Trend following and return to the mean, or counter-trend.

For trend-following systems, Kevin uses an N-bar breakout entry, while for counter-trend systems he uses a relative strength index entry. An exit strategy that works well in similar entry types should work equally well with the intended entry.

Random Entry

The Idea of a random entry is to see if the exit shows an edge by itself. The way to do that is to use a random entry as the optimising parameter with more than 100 runs while keeping the exit fixed and observe what percent of the optimisations are profitable. A very successful exit might have a high percentage of successful series. That is, in my opinion, the best criteria to know if an idea for an exit is valid and has an edge.

Fig. 1 shows the EasyLanguage code for a random entry. This code is a modified version of the one that Bill Brower has explained in his book EasyLanguage Learning-by-Example Workbook. This piece of code can easily be transposed to MQL or another language.

  • Fakecount is used to iterate the optimiser to get several random entry results
  • Initbars is the minimum number of bars the system wait till a new entry signal can be triggered.
  • Randvar is the maximum of bars a random generator can deliver, and it’s added to initbars.
  • BuySell is used to test long and short positions separately 1 for longs -1 for shorts

Fig. 2 shows the 3D graph of a trail-stop exit. We observe that around 0.15%, there is the sweet spot in all random iterations (50 in this example).

In this case, at 0.15% trail stop, the number of profitable iterations were more than 30 out of 50, that is, 60% were positive.

Evaluation criteria

Besides profitability, it’s good to assess the quality of an exit signal based on Maximum Favourable Excursion (MFE) and Maximum Adverse Excursion (MAE) standards.

Those two concepts, developed by John Sweeney, define the maximum adverse excursion (MAE) that a sound signal reaches before it proceeds to run in our favour.

Fig. 3 Show a trading system without stops. We observe that there is a drawdown level beyond which there is almost no winner and mostly are losers. That level defines the MAE optimal stop.

The maximum favourable excursion is the profit level that maximises the result on average of a trading system before it starts to fade and lose profits. MFE is the complementary concept to MAE, but it is a bit harder to visualise.

In Fig. 4 we observe that for the trade in the circle the actual run-up was 0.54% while the real close was 0.3%, the difference is a substantive profit left on the table. The goal of the exit is, on average, to make that distance as short as possible. That means the trading points should be, on average, closer to the upper line, as Fig. 4 shows.

Those two concepts applied to exits mean that the exit must avoid levels beyond MAE, and it should not give back too many profits and get close to the maximum possible excursion.

Total testing

Once we have assessed the goodness of an entry system and have a collection of useful exits to compliment it, we need to test them together and see how entries and exits interact.

The main rule at this point is getting profitability in the majority of combinations of entry and exit signals. For example, if we have ten parameter values on entries and ten on the exits, we would like positive results on more than fifty. Also, I love to see smoothness on the 3D surface. Too many peaks and valleys are a sign of randomness, and it’s not good for the future behaviour of the system, as in Fig. 5


Then, we choose a point on the hill that’s surrounded by a convex and smooth surface with similar profitability. That way we are trying to prevent a change in the character of the market which would spoil the system too soon.

Fig. 6  and 7 shows the equity curve and drawdown of a mean-reverting system, and its summary report after having passed the different stages up to the final testing and selection.

With that final assessment, we have achieved the limited testing stage. Therefore, this strategy has passed the test and is a candidate to further forward analyses and optimisations.


Further readings from this series:

Forex Designing a Trading System (I) – Introduction to Systematic Trading

Designing a Trading System (II) – The Toolbox Part 1

Designing a Trading System (III) – The Toolbox Part 2

Designing a Trading System (IV) – Testing Entries


References:

Building Winning Algorithmic Trading Systems, Kevin J. Davey

Campaign Trading, John Sweeney

Computer Analysis of the Futures Markets, Charles LeBeau, George Lucas

Images were taken with permission from Multicharts 11, trading platform.

 ©Forex.Academy