Most traders are taught to use stop-losses based on critical levels. The basic idea is to spot invalidation levels based on previous low or high. The assumption is that by putting the stop a few pips below or above a support/resistance level will be enough to ensure the right trade will not be stopped out and just bad trades will be taken away.

The problem with that is that all participants in the market, including institutional traders, can see these levels. Institutional traders have lots of cash to play with, so they can push the price down to take all the buy-stop (or sell-stop) orders they see in their price book.
Key-level-based Stops
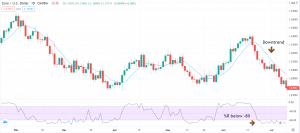
In the following example, we see the EUR(USD making a breakout after failing to break the previous high, on high volume. A perfect setup for a short trade. We then see the price moving down and then retracing and heading up to our stop-loss. We have been cautious and set it above the last top made on the 6th of November.
Nevertheless, the price kept moving inexorably up until the stop was taken. This is market manipulation at the highest level by institutions. Institutions have advanced tools to observe the depth of the order book, so they know the place and amount of the stops. Also, they have the liquidity necessary to move up the market, take all the liquidity at excellent prices, then continue south. 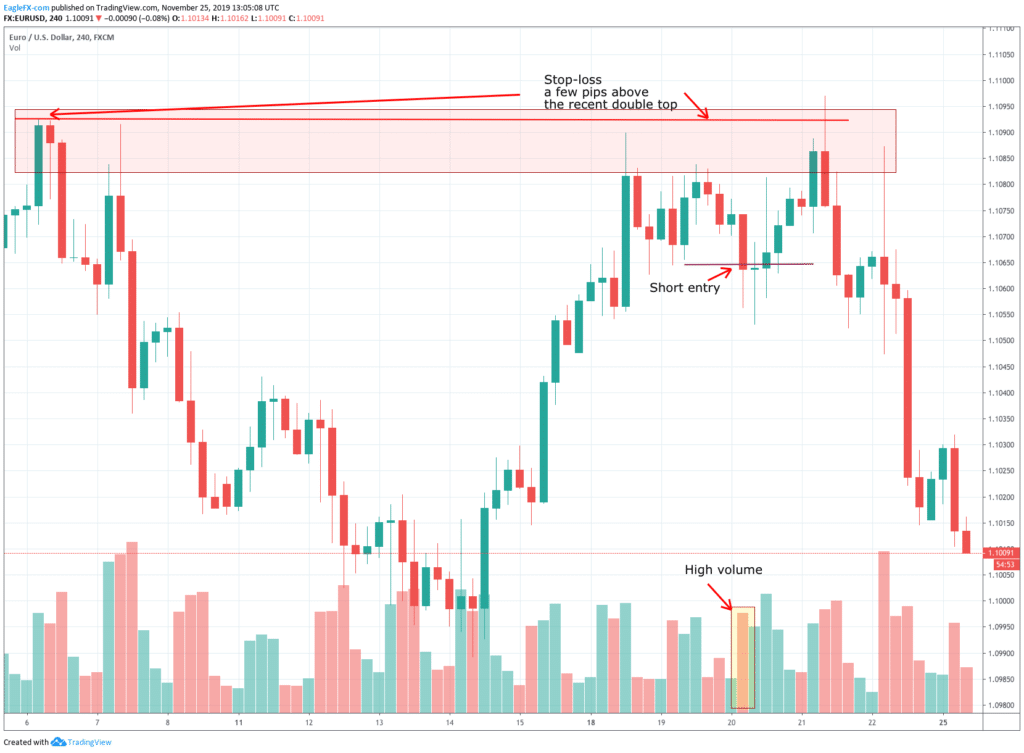
Chart 1 – EURUSD Key-level-Based Stop-loss placement
ATR-Based stops
If we look at the next chart, we see the same asset with the Average True Range indicator added. For this kind of stop-setting strategy, we need to detect the short term range. Therefore, we use a period of five for the ATR indicator. Next, we look at the peak set by the latest impulsive candlestick, which happened ten bars ago, 0.00168, which is about 17 pips. This figure gives us the expected 4-hour price movement for the current market volatility. The usual is to protect us against two times this figure, at least. In this case, we would need to move the stop-loss level 34 pips away from the entry point.
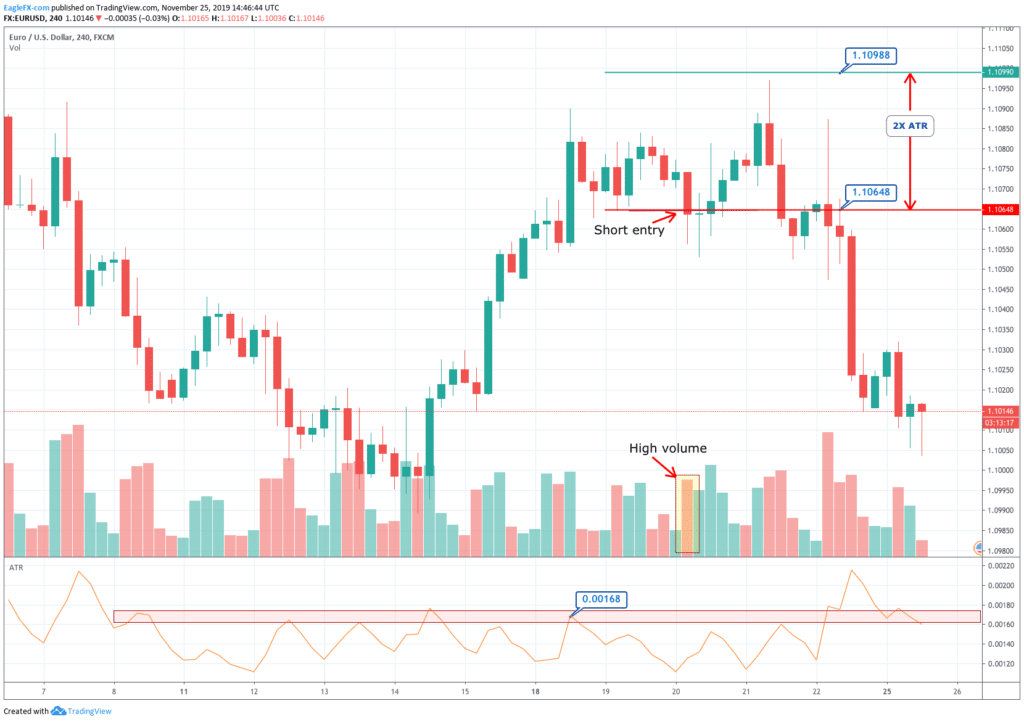
Chart 1 – EURUSD ATR-Based Stop-loss placement
It is wise to keep statistics of the ideal ATR multiplier, because as the number increases, it cuts our position size for the same dollar-risk amount, and also it reduces our Reward-to-risk ratio.
John Sweeney developed the general method of stop-loss placement. He called it the Maximum Adverse Execution method. The theory of it has been already described in our article Maximum Adverse Excursion, so we are not going to repeat ourselves here. Using MAE delivers statistical-significant and tamper-proof stops, but it is a bit cumbersome. The use of ATR Stops is a simpler and second-best option instead of the foreseeable key-level-based stops.