Categories
Forex System Design

Designing a Trading Strategy – Part 4

Introduction

In our previous article, we presented diverse types of filters, which work as additional rules. We also showed how to incorporate these filters into a trading strategy so that they can help improve its performance. 

In this educational article, the fourth section of the series dedicated to developing a trading strategy, we will discuss the profit management.

Profit Management

Profit management is an aspect of risk management that characterizes by its high level of complexity. The difficulty lies in that profit management seeks to preserve the profits obtained during the trade and also to prevent a premature exit from a market that still moves in a trend not over yet.

There are two available methods with which the trading strategist may manage the profits realized in an opened position. These are the trailing stop and the profit target order.

Trailing Stop

This type of order is dynamic. It moves only in the same direction of the position as it moves in the direction of the trend. In other words, a trailing stop will move upward in a buy positioning and downward in a sell trade. 

Another characteristic of the trailing stop is that it steadily advances during the life of the trade. It will never retrace when the price develops a movement against the trade’s direction.

The trailing stop has two components, which are detailed as follows:

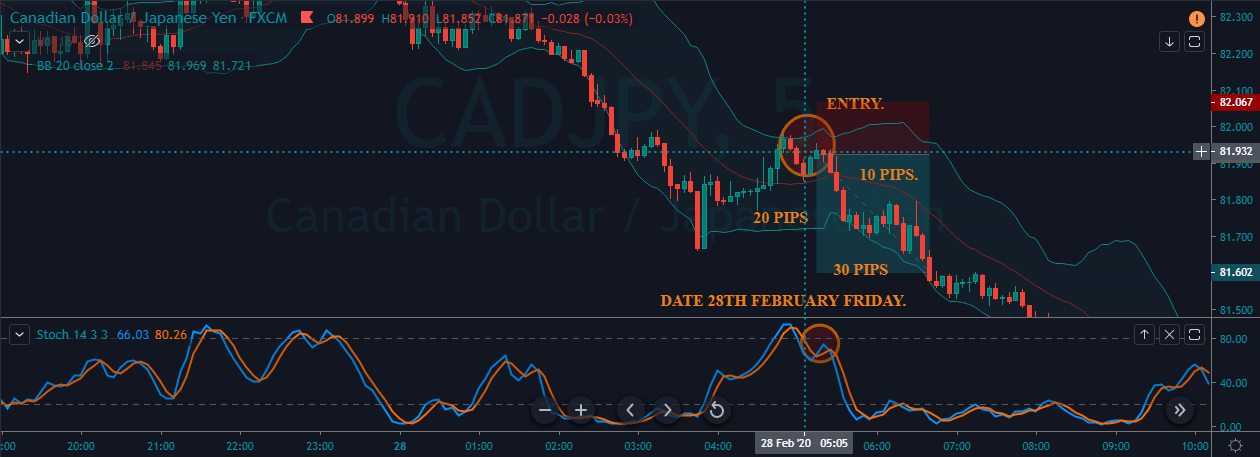
  • Trailing stop: corresponds to the number of pips in which the stop loss order will move once the price moves in the trade direction. For example, if an order has set a 40-pip stop-loss, and the price advances 30 pips in favor of the trend, the new stop-loss will shift to 10 pips below the opening price. In general, there are several ways to establish a trailing stop: by fixed pip variation and by volatility using the Average True Range (ATR) indicator, or using SAR (Stop and reverse) stops. 
  • Step: this corresponds to the variation in pips that the dynamic stop will move behind the price when it has been activated.

Profit Target Order

The second mechanism to manage profits is by using a profit target order. This type of order is conditioned to the prince advance to a predetermined level. Likewise, compared with the trailing stop case, this order is not affected by the price decrease. However, its activation is subjected to the price reaching a specific level.

 A profit target order can be set using a specific number of pips, by a multiple of the Average True Range (ATR), a percentage of price increase ( or decrease), specific levels of resistance or support, or a specific dollar gain.

Using the Trailing Stop in a Trading Strategy

This example illustrates the impact of using a trailing stop with a two moving averages crossover strategy, corresponding to LWMA(5) and SMA(55) periods using the EURUSD pair.

 We have evaluated the performance of a 40-pip trailing stop with a variable step from 1 to 15 pips. The results are as follows.

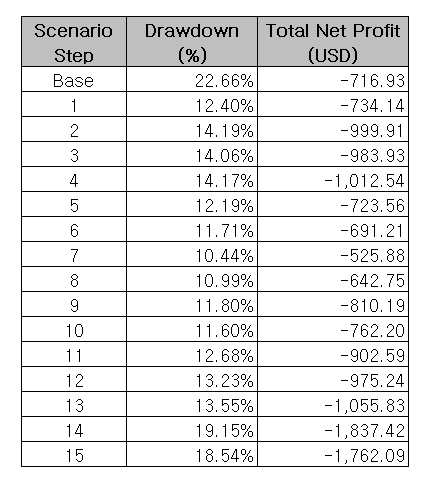
In the table above, we distinguish the impact on drawdown reduction with respect to the base scenario, after the incorporation of a trailing stop rule to the MA crossover strategy. The base case, on which the exit rule is the MA cross in the opposite direction to the opening of the position, exhibits a 22.66% drawdown. However, the addition of trailing stops led to a reduced 10.44% drawdown and a net profit of -525.88 (USD).

Each trailing stop step variation scenario, including the base exit scenario of the trading strategy, is shown in the following figure.

Finally, we observe that a 7-pip step provides the lowest losses. We also highlight that as the step increases, the drawdown also increases, confirming the growing losses.

Conclusions

The application of Profit Management represents a significant challenge for the developer of the trading strategy. This complexity arises due to a wide variety of combinations that can be used to ensure the strategy’s gains as each trade moves in the trend direction.

In this context, as we have seen, the parameter setting to be considered, the trailing stop, profit target orders, or its combination, should be carefully evaluated before applying them to the trading strategy, to ensure the optimal settings.

In the next educational article, we will present the fifth and last part of the series dedicated to developing trading strategies that will explain the position sizing process.

Suggested Readings

  • Jaekle, U., Tomasini, E.; Trading Systems: A New Approach to System Development and Portfolio Optimisation; Harriman House Ltd.; 1st Edition (2009).
  • Pardo, R.; The Evaluation and Optimization of Trading Strategies; John Wiley & Sons; 2nd Edition (2008).
Categories
Forex Basic Strategies

Making Consistent Profits with ’10 Pips A Day’ Forex Strategy

Introduction

There is a lot of buzz in the Forex industry about the ten-pip a day strategy. We have seen both experienced and novice traders getting excited about this strategy. So we decided to talk in detail about this topic in today’s article. Some expert traders believe that it’s not possible to make ten-pip consistently in the market, while many others say it is possible.

In reality, it entirely depends on the person’s trading skills, mindset, and experience. Traders need to adapt themselves to the market situations to be successful. Making ten-pip a day is a great way to accumulate wealth in the Forex market, and it is easily possible. All we need is to master our skills to the point where we exactly know when to take a trade and when not to.

Statistics say that it’s not easy to make consistent money in the Forex market, and the losses are a part of the game. This is true to an extent, but if we practice this strategy enough on a simulator, we can easily make ten pips a day no matter what. In this article, let’s understand how to make ten pips per day in the Forex market by using five different buy and sell examples of five trading days in a week.

Trading Strategy For Making 10 Pips A Day

’10 Pips A Day’ – The idea behind this term is to stop trading for the day right after making ten pips that day. Also, it is up to you to follow this idea or not. You can stop trading after making ten pips, or you can ignore that and go for 20, 30, or even 100 pips a day according to the market situation.

But only go ahead if you are 100% confident about the markets. In case of any tiny bit of uncertainty, make sure to exit right after you make ten pips. One critical aspect of this strategy is selecting the currency pairs. One must be professional enough to understand the market situations and pick the pairs where there is a minimum potential of making ten pip profits.

Pairing The Bollinger Bands With The Stochastic Indicator

Rules For Going Long
  1. The market must be in a strong uptrend.
  2. Wait for the price action to slowdown at the lower Bollinger Band.
  3. Let the Stochastic Indicator reverse at the oversold area.
  4. Only go long if the above two rules are satisfied. Also, consider the momentum of the price.
  5. Place the stop-loss just below the lower Bollinger Bands.

Now, to understand how this works, we have taken five different trades for five trading days in the last week of Feb 2020 and have generated 10, 20, and 30 pips in the market successfully. According to this strategy, conservative traders must stop trading after making ten pips for that trading day. But, if you are an aggressive trader, go ahead for bigger targets. Let’s get into the examples.

Monday Trade

The below chart represents a buy trade in EUR/CAD Forex pair. When all the rules mentioned above are met, we took a long position in the New York Session on 24th Feb 2020. Our stop-loss is placed right below the lower Bollinger Band.

We have gone for three different targets according to the market situations and predominant S&R levels. As mentioned, exit the trade as soon as you make ten pips if you are a conservative trader.

Tuesday Trade

For the second day, we have picked the EUR/AUD Forex pair as we identified some potential market moves. We have gone long on this pair in the New York session on 25TH Feb 2020. We can clearly see both the indicators indicating a clear buy signal.

Here, we have gone for the third target and exited the trade as soon as we made 30 pips.

Wednesday Trade

Our third trade was in the EUR/CAD Forex currency pair in the Asian session on 26th Feb 2020. When prices hit the lower Bollinger bands, and the Stochastic indicated the oversold market conditions, we went long on this currency pair.

We would have exited the trade at ten pips, but the market started printing continuous bullish candles, which made us wait for the prices to hit the third target.

Thursday Trade

On the 4th day (27th Feb 2020), we took a long position in the AUD/NZD Forex pair. The entry was at the point where the prices touched the lower Bollinger Band, and the stop-loss is placed just below the recent low.

Since the higher highs were getting continuously printed, we went for the third target and exited the trade as soon as we made 30 pips.

Friday Trade

For the Friday trade, we chose the AUD/NZD Forex pair. We went long in the Asian session on 28th Feb 2020. When both the indicators lined up in one direction, it is a clear indication that the sellers have given up, and now it’s time for buyers to lead the market.

We had exited at the third target even when the market was moving up north.

 Rules For Going Short
  1. The market must be in a strong downtrend.
  2. Wait for the price action to slowdown at the upper Bollinger Band.
  3. Let the Stochastic Indicator reverse at the overbought area.
  4. Only go short if the above two rules are satisfied. Also, consider the momentum of the price.
  5. Place the stop-loss just above the upper Bollinger Band.

Monday Trade

The below chart represents the first sell trade we took in the NZD/JPY Forex pair on the 24th Feb 2020. We went short when the price action hit the upper Bollinger band, and the Stochastic indicated the overbought conditions.

The stop-loss is placed just above the upper Bollinger Band. We have gone for the third target, and the market printed a brand new lower low.

Tuesday Trade

The below image represents the USD/CHF Forex pair. This pair was in an overall downtrend, and on 25th Feb 2020, we have activated the sell trade right after our sell criteria is met.

We can see the market reaching all of our targets in just a couple of hours.

Wednesday Trade

For the third day, we have chosen the USD/CHF Forex pair to identify the sell opportunities on 26th Feb 2020. The entry was at the point where the price action touched the upper Bollinger band, and the stop-loss was just above the upper band.

The reason we place the stop-loss there is because of the bands of the indicator act as a dynamic support resistance level to the price action.

Thursday Trade

The 4th trade belongs to the CAD/JPY Forex pair, and we have activated our sell trades on 27th Feb 2020. We took sell when both of the indicators lined up in one direction, and we booked profit at the third target.

Friday Trade

For the last sell trade, we chose CAD/JPY currency pair. Sell trade was activated on Friday, 28th Feb, in the Asian session. When the Stochastic reached the overbought area and gave a sharp reversal, we saw the price action hitting the upper Bollinger band. This essentially means that the market is ready to go down.

Bottom Line

In almost all of the cases, we have gone for the third target only and make 30 pips profits. The reason behind this is to show you how reliable is the Bollinger Band and Stochastic combination. We are saying this time, and again, please stop trading after making ten pips per day if you are a conservative novice trader. But if you are experienced enough to predict the market, milk as much as you can depending on the market conditions. All the best.