Categories
Forex Basic Strategies

Trading the Double Top and Double Bottom Patterns Using the Accelerator Indicator

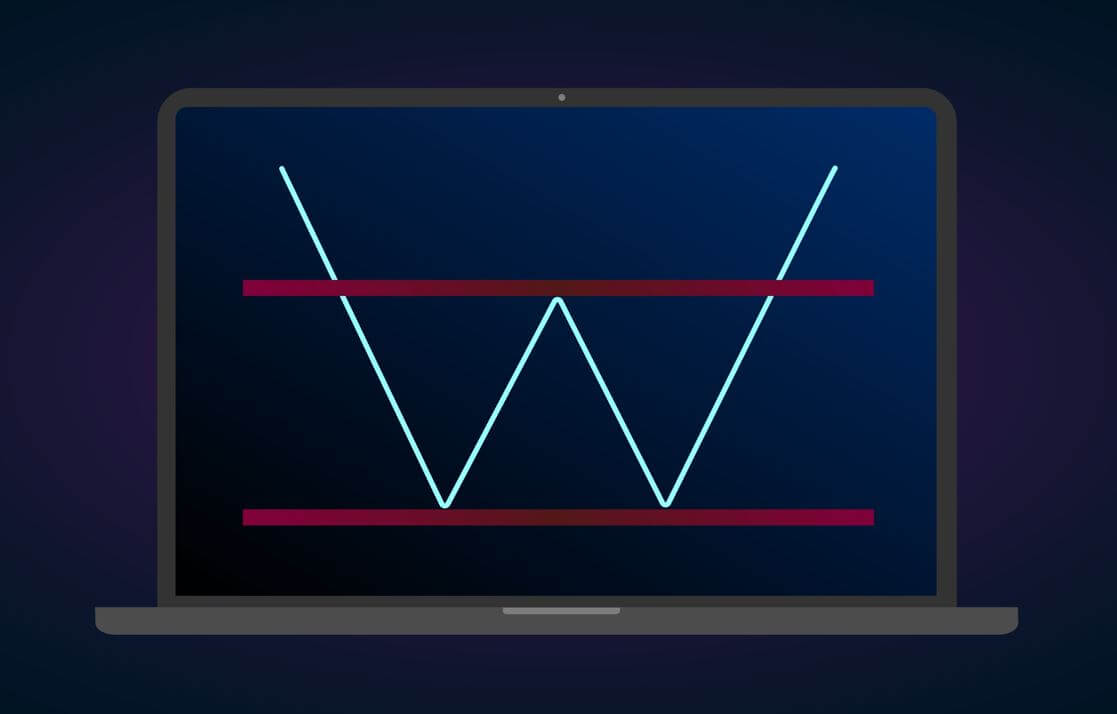
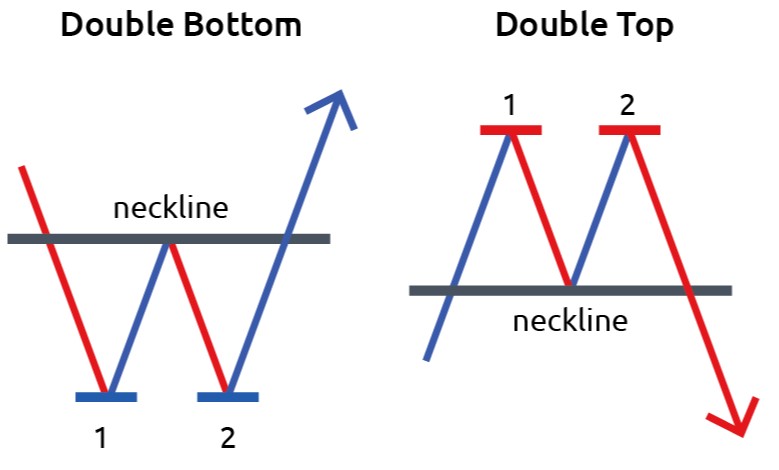
Double top and Double Bottom is a reversal pattern that occurs when the underlying asset moves in a similar pattern of ‘M’ { Double Top } and letter ‘W’ { Double Bottom } This pattern are useful to find out the possible reversal areas to milk the upcoming trend.

DOUBLE TOP PATTERN

The Double Top pattern is an extremely bearish pattern which typically found on the candlestick, line, and bar chart. The double pattern prints the two consecutive peaks that are roughly the equal size within the market which indicates the strong selling market. In an underlying asset the market should be in an ongoing trend, and let the price for printing the first peak, most of the time you will notice the first peak near the major price levels or near to the resistance area. Most of the time, the momentum of the second peak is slower than the first one, and you can confirm this by checking the declining volume. The slower momentum is a good sign that the buyers are not much interested now and the sellers can easily take over the show. After the completion of the pattern, we still need to confirm the pattern by letting it to break below the higher low.

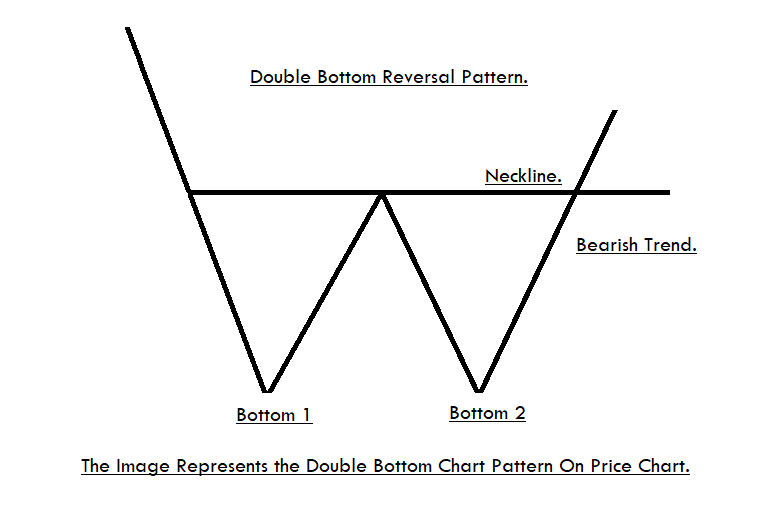
DOUBLE BOTTOM PATTERN

The double bottom pattern is a technical analysis chart pattern that describes the change in momentum and the trend of the ongoing trend. This pattern is opposite to the Double Top pattern; it prints the two consecutive bottoms that are roughly the equal size within the market, indicating the change in direction and momentum. The first trough marks the lowest point on the ongoing trend around any major level, and after the trough, the advance takes place that typically ranges from 10% to 20%. Volume is the essential tool in this pattern, the rising volume of buyers is an indication that the sellers are struggling now and soon expect the major rise in price action. The break above the lower high is an indication to go long.

ACCELERATOR INDICATOR

The Accelerator Oscillator is developed by the well-known analyst Bill Williams. According to Williams, the direction of the momentum always changes before the direction of the market. So in order to time the market, it is important to understand the momentum of the asset, this is the reason Bill William develop the Accelerator Indicator. The pattern consists of the centre line and the green and red bars. When the prices are above the zero line, it means the buyers are strong and the big the green bar is the stronger the momentum.

Conversely, when the prices are below the zero line, it means the sellers are in the game and the lower the selling bar stronger the momentum. The indicator is very useful to trade the market reversals. When the market is in a buying trend, and the indicator is above the zero keep printing the green bars, at that stage of the game if you witness the red bar it means the sellers are stepping and soon expect the downtrend.

TRADING STRATEGIES

FOR BUYING

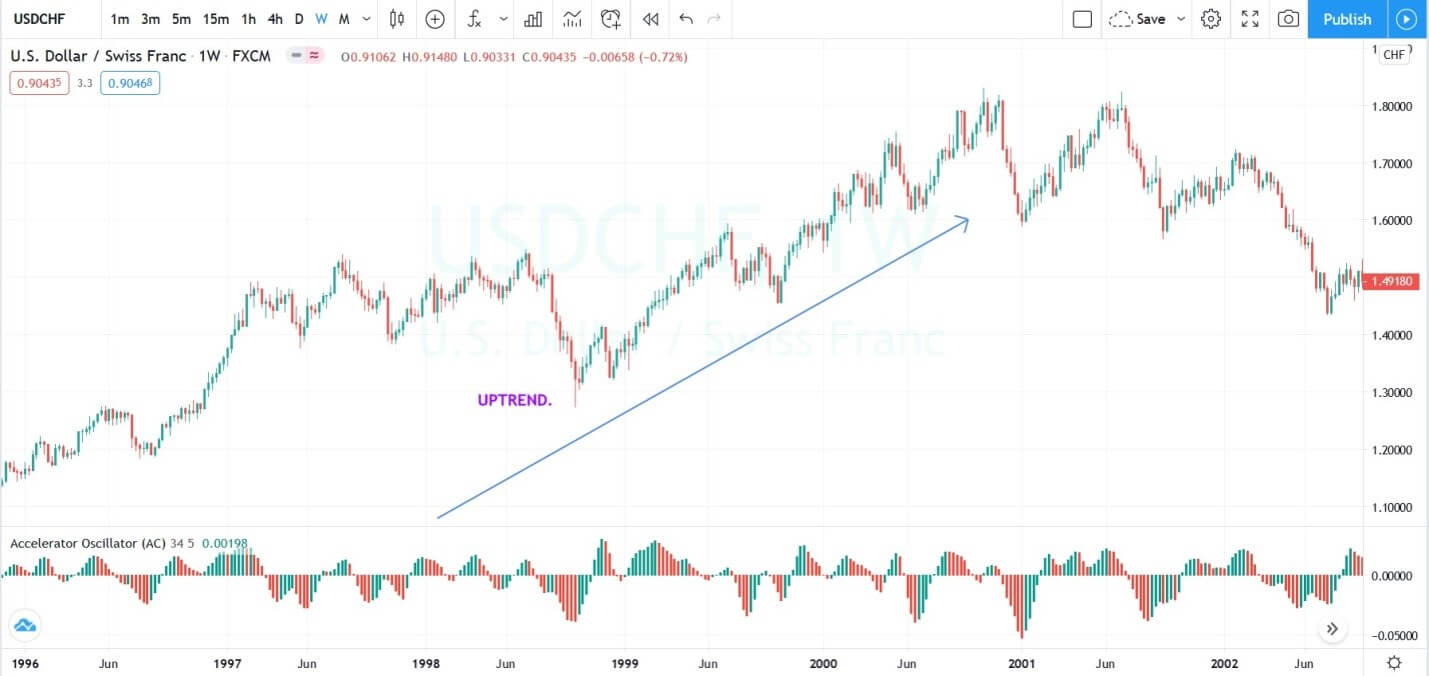
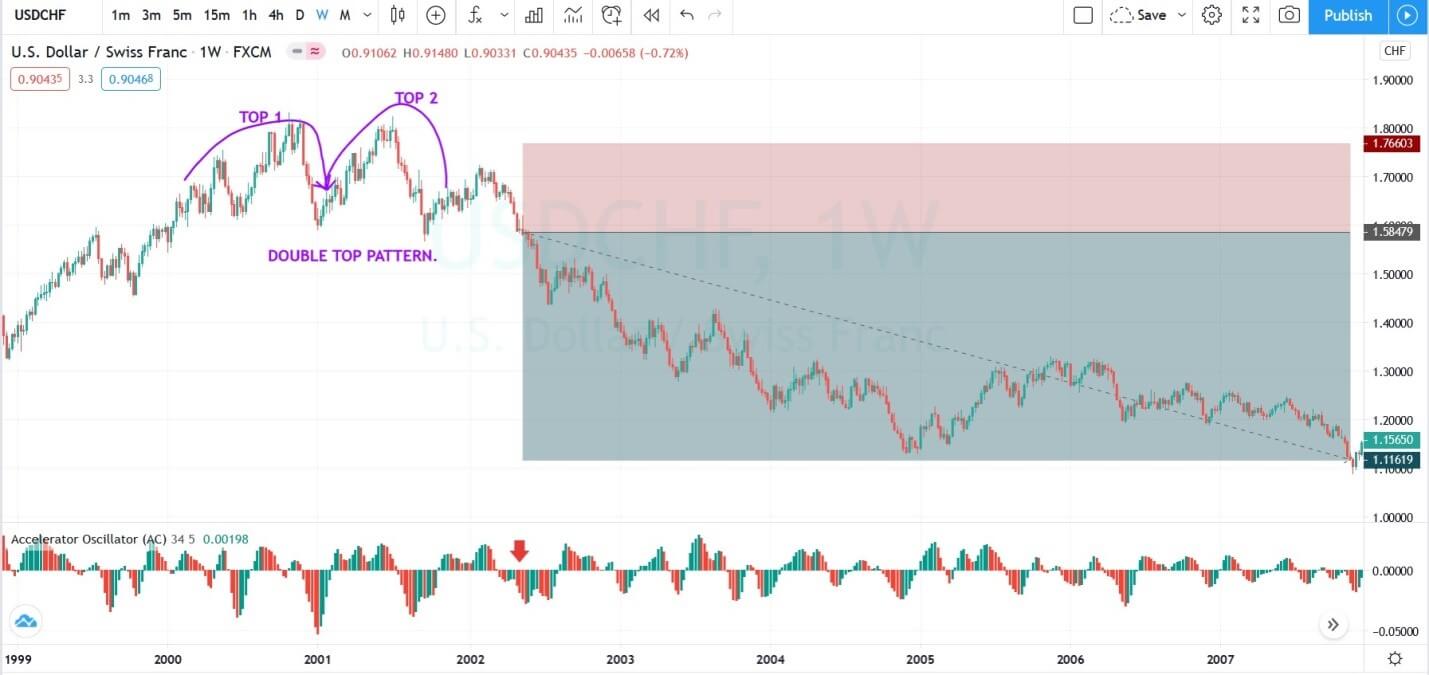
The image below represents the uptrend in the USDCHF forex pair.

The image below represents our entry, exit, and stop loss in the USDCHF forex pair. As you can see, the pair was in an uptrend, and after the completion of the double top pattern, we choose to go short around the most recent lower high. After our entry price action smoothly goes down, and we witnessed the brand new lower low.

FOR SELLING

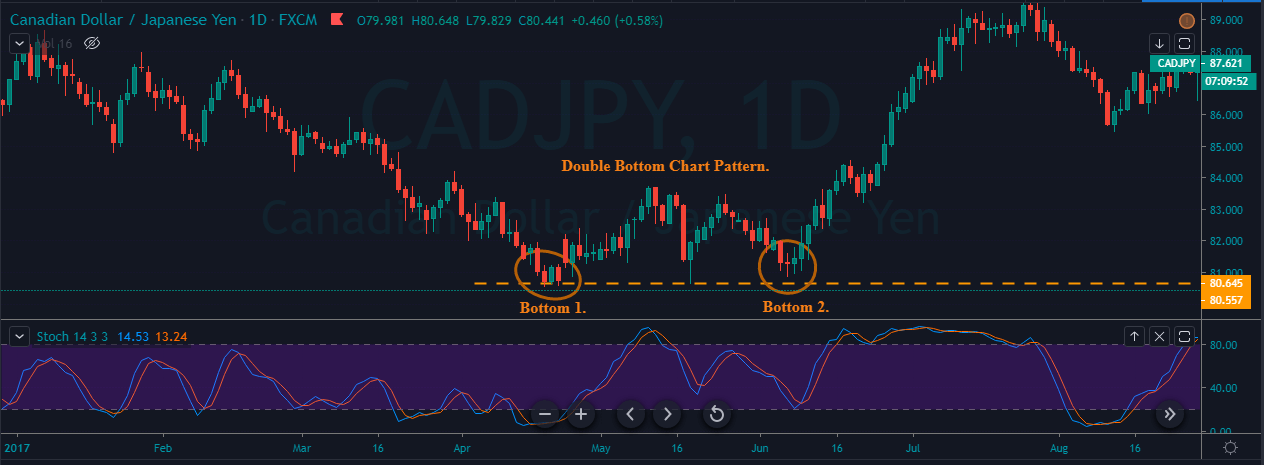
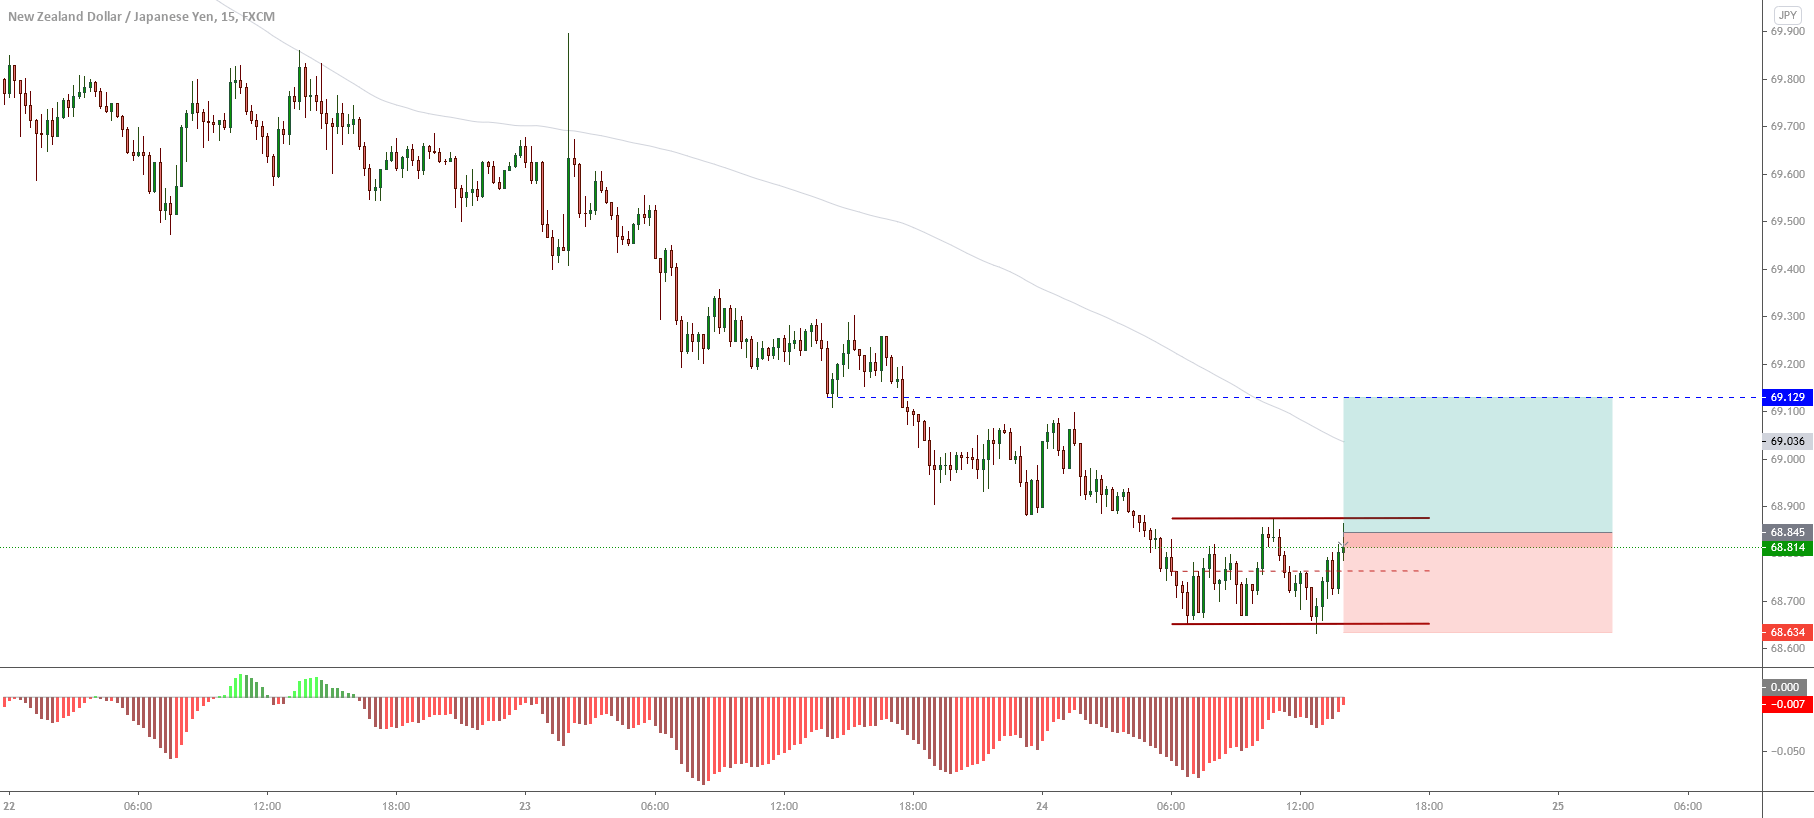
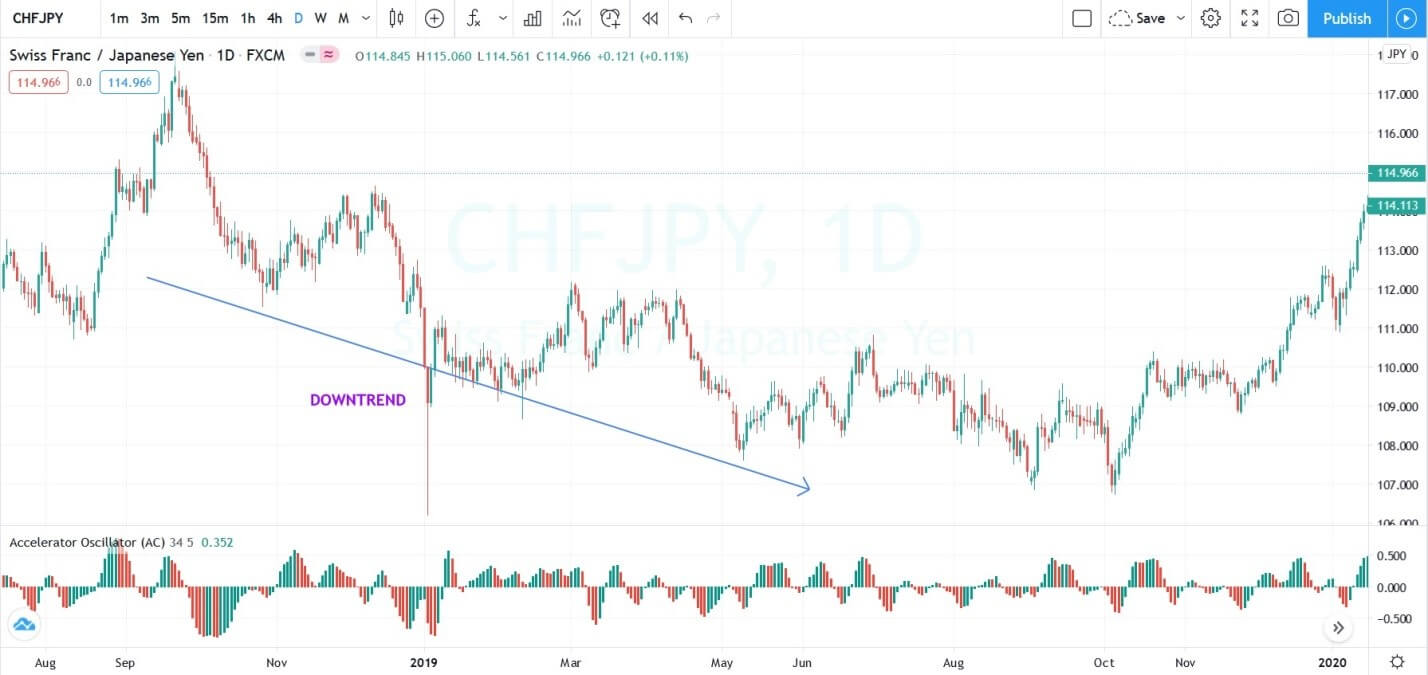
The image below represents the downtrend in the CHFJPY forex pair.

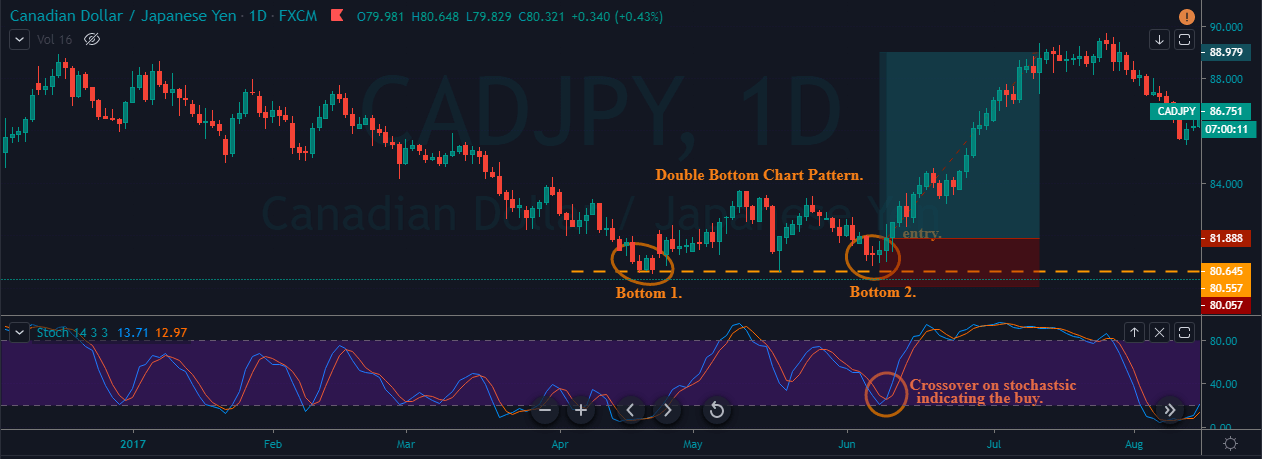
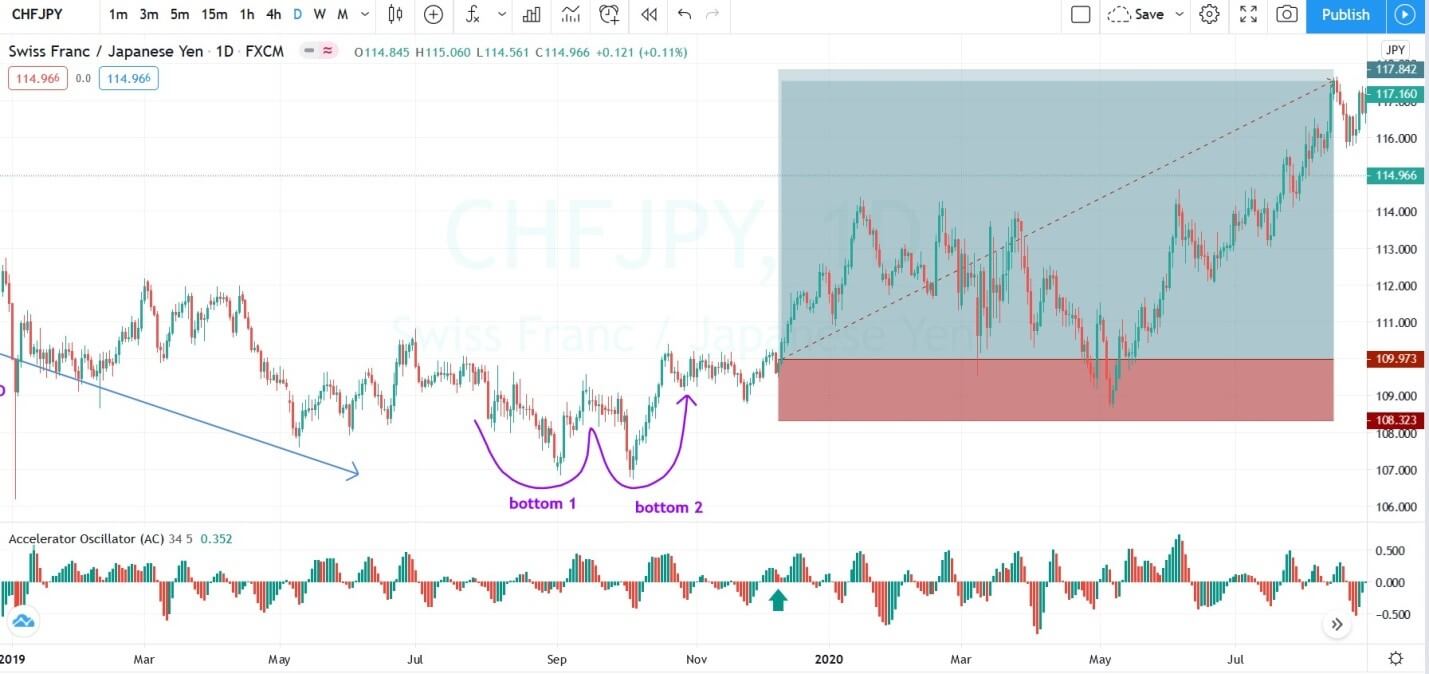
The image below represents the double bottom pattern on the CHFJPY forex pair. As you can see the currency was in a downtrend and when it prints the double bottom pattern as well the Accelerator indicator was also printing the longer green, it was a sign to go long in this currency.

TRADING THE PATTERN BEFORE THE COMPLETION

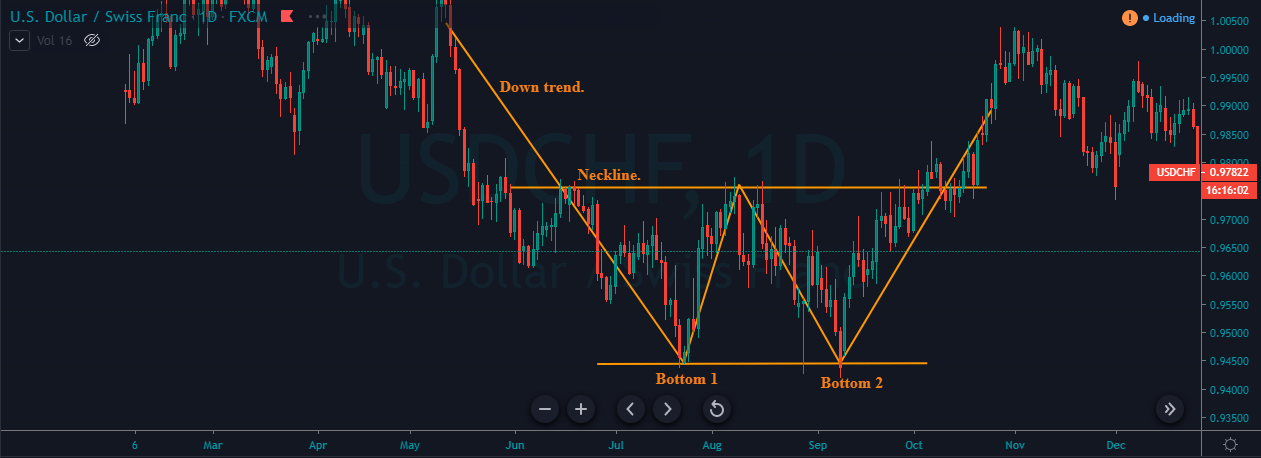
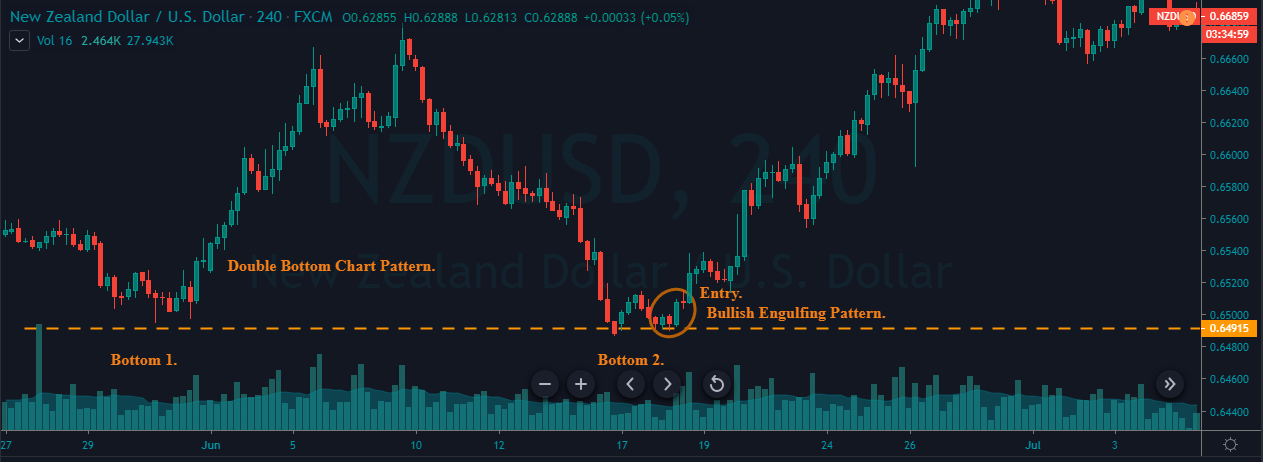
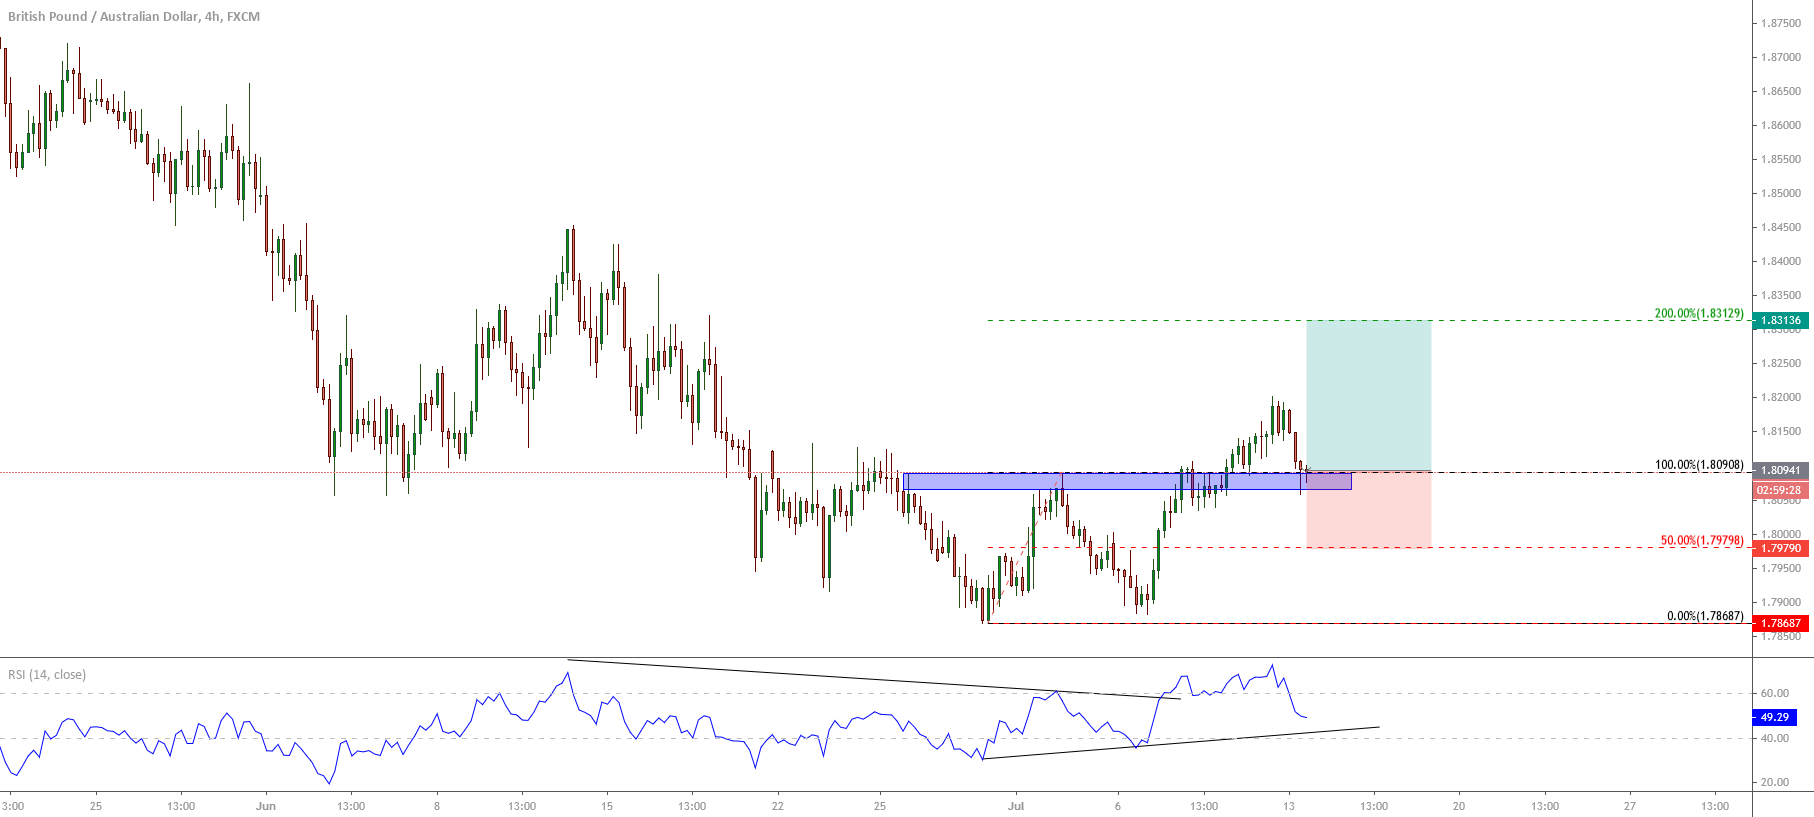
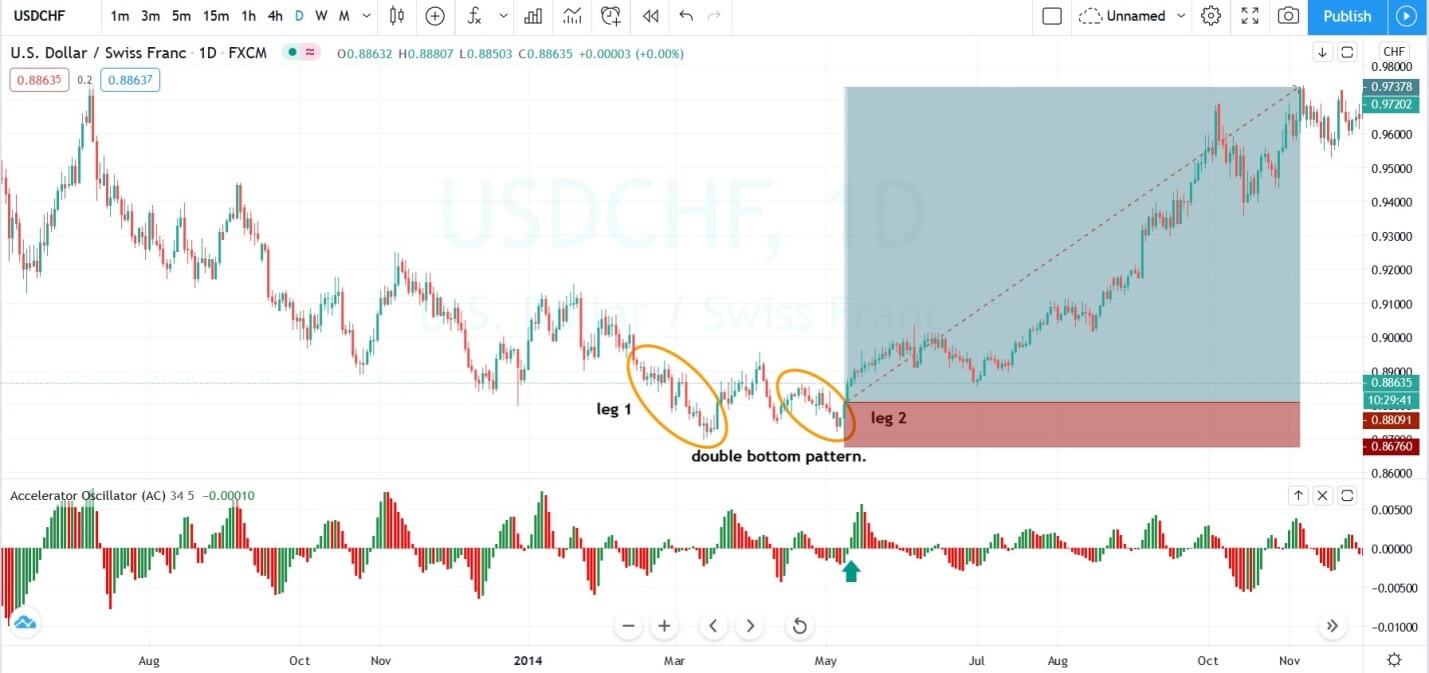
The image below represents the double bottom pattern in the USDCHF forex pair.

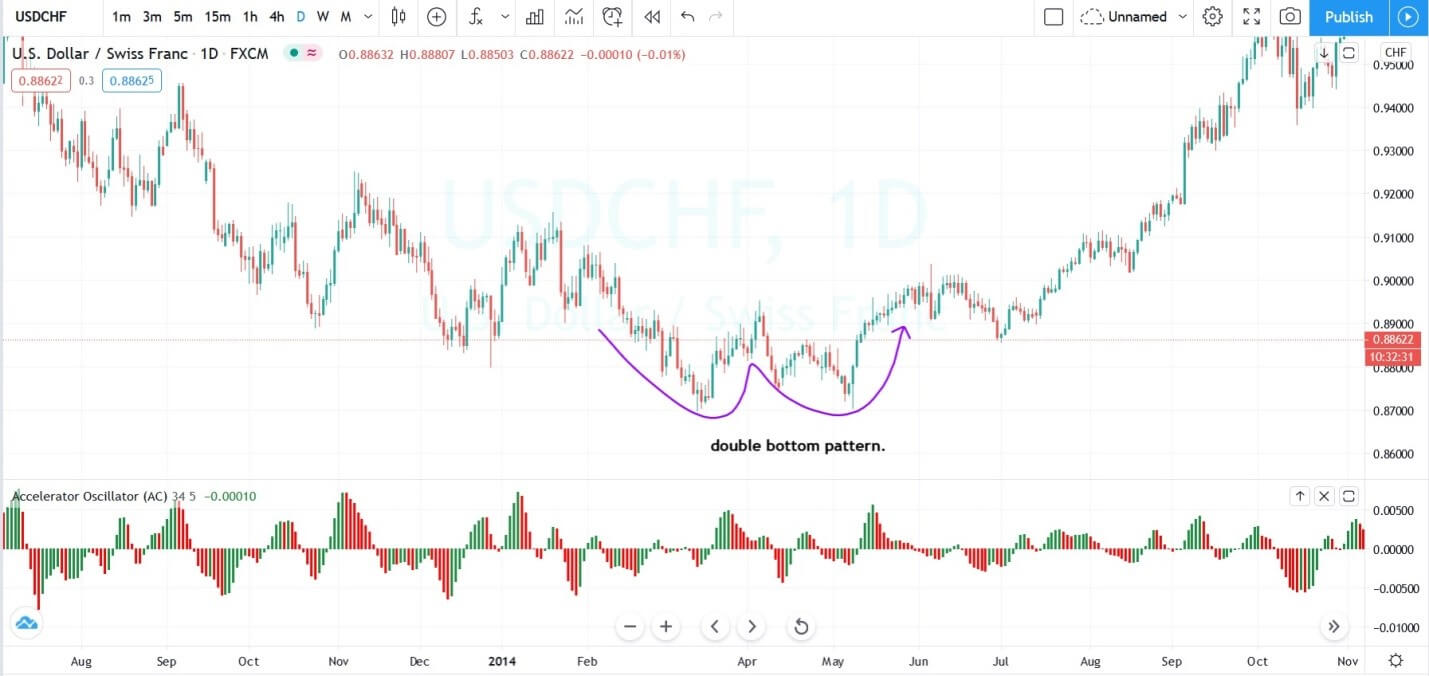
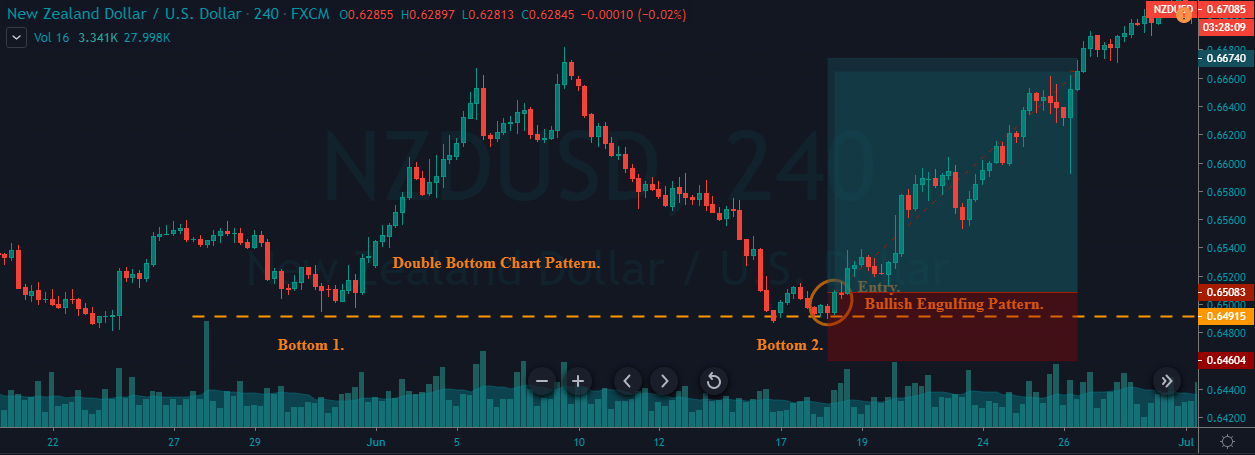
The image below represents the entry, exit, and stop-loss in the USDCHF forex pair. In this pair, we choose to take entry at the second bottom. For trading the pattern even before the completion, you need to do a deep analysis of the pattern. First of all, the trend must be down, and if the downtrend is way weaker then it is even a greater sign. In the image below, buyers and sellers both were holding equal power, which indicates the buyers have more chance to perform.

Furthermore, always compare the first sellers’ leg with the second sellers’ leg, and if the second leg is weaker as compared to the first, then it means we can take the buying entry. In the below image, the leg one sellers were strong, and then the buyers approached when the sellers tried they were way weaker than the buyers which means this would be a second bottom in the market. The Accelerator oscillator goes above the zero line, and the strong buying candle at the double bottom was a sign to go long in this pair.

CONCLUSION

Double top and the double bottom is a leading pattern in the industry which indicates the upcoming reversal in the market. It is very popular in the trading community, and all the type of trades uses this pattern to make consistent money. Pairing it with the accelerator oscillator gave the extra edge to the traders to trade the pattern, In the first strategy we shared how to time the pattern by using the indicator and how to filter out all the low probability pattern formations, and in the above trading strategy, we showed how to trade the second bottom even before the formation of the pattern, so that the traders can easily get the good risk to reward trades. By using these two trading strategies, anyone can master the pattern completely, and end up making a handsome amount of cash.

Categories
Forex Basic Strategies

Pairing Stochastic With The ‘Double Bottom’ Forex Chart Pattern

The double Bottom is a technical chart pattern, which helps to identify the change in the direction of the selling trend. The pattern looks like W in shape and it is quite a popular pattern among technical traders. In other words, double Bottom is a bullish reversal pattern. Most of the time double bottom reversals usually mark the long-term trend change in an instrument. In an ongoing downtrend, the price action drops to a floor, a significant support level before beginning the new uptrend. The pattern forms by two consecutive rounding bottoms with approx. Same heights. Most of the time, the momentum of the second Bottom is quite weak, which indicates that the weak selling momentum. Both of the round bottoms retrace until it finds the major resistance area that we call the Neckline. Overall, the pattern indicates that the professional traders, market movers booking the profits, and now the market are ready to print brand new higher high.

The image above represents the Double Bottom Chart Pattern on Price Chart.

Psychology Behind This Pattern

As by now you know that the double Bottom pattern occurs at the major support area, the pattern suggests that when the price action reaches the major support area, it means that the sellers are now afraid of the major support zone so they are booking their profits and as a result, the momentum of the market keeps dying. When price action prints the first Bottom, it indicates that some buyers try to buy; as a result, price action approaches the Neckline, and now at the Neckline, some sellers again try to hit the sell in order to print a brand new lower low. When price action reaches the major support area again, they failed to print a new lower low, and as a result, they booked the profit. Now the markets are entirely under the control of the buyers, and they are ready to print the brand new higher high.

Trading Strategies Using Double Bottom Pattern

Double Bottom Pattern + Bullish Candlestick Patterns

There are several bullish candlestick patterns that are widely used by technical traders in the market. You can use any bullish candlestick pattern to trade the market, some of the popular bullish candlestick patterns are Bullish Engulfing, Morning star, Gravestone Doji, Dragonfly Doji, Three white soldiers. These are widely used, and the most common candlestick patterns exist in the market.

The idea is to find out any bullish candlestick pattern at the second Bottom, when you find out any bullish pattern at the bottom area go long, put the stop loss below the support line, and the first take profit must be at the Neckline, second one should be double than the size of the pattern.

The below Image represents the double bottom pattern on the NZDUSD Forex pair.

As you can see in the below Image, the market prints the Double Bottom chart pattern, which indicates that the buying trade in this pair. Initially, when the price action approached the support area, at that time, the momentum of the downtrend was really weak, but after the first retracement to the Neckline, the sellers try hard to print brand new lower, but they failed to do it. When price action hits the Bottom second time, the market prints the bullish engulfing pattern, which indicates the buying trade in this pair.

The below Image represents our entry and exits in this forex pair. We took long when the market prints the bullish engulfing pattern, and the take profit was below the second Bottom, the major support line below acts as dynamic support to the price action. You can even go with a smaller stop loss because the line below is so strong that it stops the strong selling trend and even reverse it completely. So you can imagine how strong this line is. The take profit was at the Neckline, you can close your position at the Neckline, or you can hold it for the further target. It is advisable to book half of the profit at the Neckline.

Double Bottom Chart Pattern + Stochastic Indicator

In this strategy, we paired the Double Bottom pattern with the stochastic indicator to identify the trading signals. Stochastic is a quite popular oscillator that is developed by George C. Lane in the 1950s. Most of the traders think that just like other indicators, stochastic also follow the price and volume, but it is not true. In fact, stochastic follows the momentum and speed of price action. The stochastic indicator is used to identify the oversold and overbought buying conditions, and traders use overbought/oversold conditions to trade the market. The indicator also identifies the divergence, which helps the traders to identify the major market reversals.

The below Image represents the Double Bottom chart pattern on the Daily chart of the CADJPY forex pair.

The below Image represents our entry in this pair by using the stochastic indicator and double Bottom chart pattern.  As you can see that we took a long position when prices failed to go below the major support line. Most of the traders what they do is activate the buy trades when the price action hits the support line the second time. This is the wrong approach. Instead, let the price action holds and then activate your trade. As you can see, when prices hit the second Bottom at that time, crossover happened on the stochastic indicator, which indicates that the market is oversold and it is time to go long.

The below Image represents our entry and exits in this pair. We took long when the price action hits the second Bottom, also when the crossover happened on the stochastic indicator. Stop below the recent low, and the take profit was at the higher timeframe major resistance area.

Conclusion

The double Bottom is an extremely powerful chart pattern when it is interpreted correctly. If you interpret it incorrectly then it can damage your trading account. You can activate your trades when price action hits the second Bottom, or you can activate trades when price action crosses the Neckline and retests as support. It doesn’t matter where you activate your trade; both of the locations provide a good risk to reward ratio.

Categories
Forex Signals

NZDJPY Advances Boosted by Risk-On Sentiment

Description

The NZDJPY cross advances on Thursday trading session driven by the risk-on sentiment confirmed during the U.S. session opening, where the tech sector boosted the leading stocks indices. This bullish sentiment increases the possibility of a bounce in the commodity currencies.

The price of NZDJPY, exposed in its 15-minute chart, reveals the rejection of the bearish continuation once the price rebounded mainly bullish once it attempted to penetrate under the previous low of the current trading session located at 68,652.

On the other hand, from the sideways channel, we distinguish the possibility of activation of a double bottom pattern, leading to the price to strike the psychological barrier of 69.00, where the NZDJPY cross could start to find resistance.

Our bullish scenario foresees an escalation toward the level of 69.14, where the price could find intraday resistance. On the other hand, our upward scenario’s invalidation level locates below the baseline of the sideways channel at 68.59.

Chart

Trading Plan Summary


Check out the latest trading signals on the Forex Academy App for your mobile phone from the Android and iOS App Store.

Categories
Forex Signals

GBPAUD Activates a Double Bottom Pattern

Description

The GBPAUD cross in its 4-hour chart illustrates the double bottom pattern’s throwback, which activated once the price action surpassed the 1.8090 level.

The chartist formation characterized by having two valleys and one peak found its first valley at 1.7868 on June 30th, where developed a bounce that carried it until 1.8090 on July 02nd. The following valley that found support at 1.7882 created a bearish failure, from where the price action started to develop a bullish move. This intraday rally drove GBPAUD to reach a new short-term higher high, reflecting its movement on the RSI oscillator, which surpassed the level-70, giving an additional signal of potential recovery.

The current retracement, which corresponds to a throwback, lead us to conclude that the price action could develop a new rally with a potential profit target located at 1.8345. 

Our invalidation level locates at 1.7981, which corresponds to 50% of the bottom formation range. 

Chart

Trading Plan Summary

  • Entry Level: 1.8096
  • Protective Stop: 1.7981
  • Profit Target: 1.8345
  • Risk/Reward Ratio: 1.9
  • Position Size: 0.01 lot per $1,000 in trading account.

Check out the latest trading signals on the Forex Academy App for your mobile phone from the Android and iOS App Store.