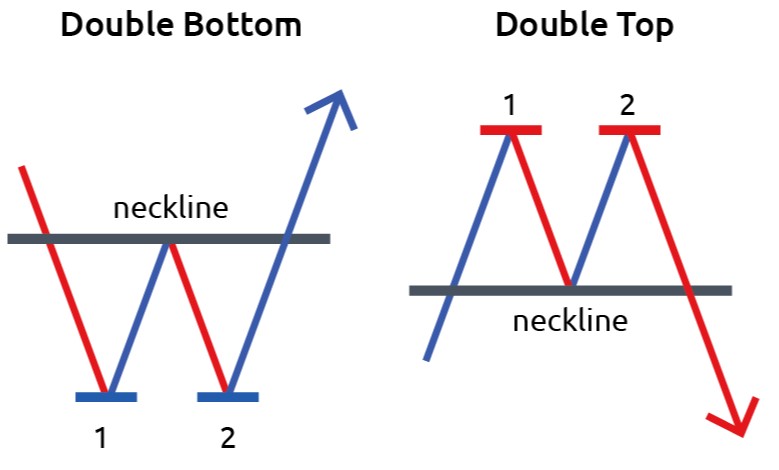
Double top and Double Bottom is a reversal pattern that occurs when the underlying asset moves in a similar pattern of ‘M’ { Double Top } and letter ‘W’ { Double Bottom } This pattern are useful to find out the possible reversal areas to milk the upcoming trend.
DOUBLE TOP PATTERN
The Double Top pattern is an extremely bearish pattern which typically found on the candlestick, line, and bar chart. The double pattern prints the two consecutive peaks that are roughly the equal size within the market which indicates the strong selling market. In an underlying asset the market should be in an ongoing trend, and let the price for printing the first peak, most of the time you will notice the first peak near the major price levels or near to the resistance area. Most of the time, the momentum of the second peak is slower than the first one, and you can confirm this by checking the declining volume. The slower momentum is a good sign that the buyers are not much interested now and the sellers can easily take over the show. After the completion of the pattern, we still need to confirm the pattern by letting it to break below the higher low.
DOUBLE BOTTOM PATTERN
The double bottom pattern is a technical analysis chart pattern that describes the change in momentum and the trend of the ongoing trend. This pattern is opposite to the Double Top pattern; it prints the two consecutive bottoms that are roughly the equal size within the market, indicating the change in direction and momentum. The first trough marks the lowest point on the ongoing trend around any major level, and after the trough, the advance takes place that typically ranges from 10% to 20%. Volume is the essential tool in this pattern, the rising volume of buyers is an indication that the sellers are struggling now and soon expect the major rise in price action. The break above the lower high is an indication to go long.
ACCELERATOR INDICATOR
The Accelerator Oscillator is developed by the well-known analyst Bill Williams. According to Williams, the direction of the momentum always changes before the direction of the market. So in order to time the market, it is important to understand the momentum of the asset, this is the reason Bill William develop the Accelerator Indicator. The pattern consists of the centre line and the green and red bars. When the prices are above the zero line, it means the buyers are strong and the big the green bar is the stronger the momentum.
Conversely, when the prices are below the zero line, it means the sellers are in the game and the lower the selling bar stronger the momentum. The indicator is very useful to trade the market reversals. When the market is in a buying trend, and the indicator is above the zero keep printing the green bars, at that stage of the game if you witness the red bar it means the sellers are stepping and soon expect the downtrend.
TRADING STRATEGIES
FOR BUYING
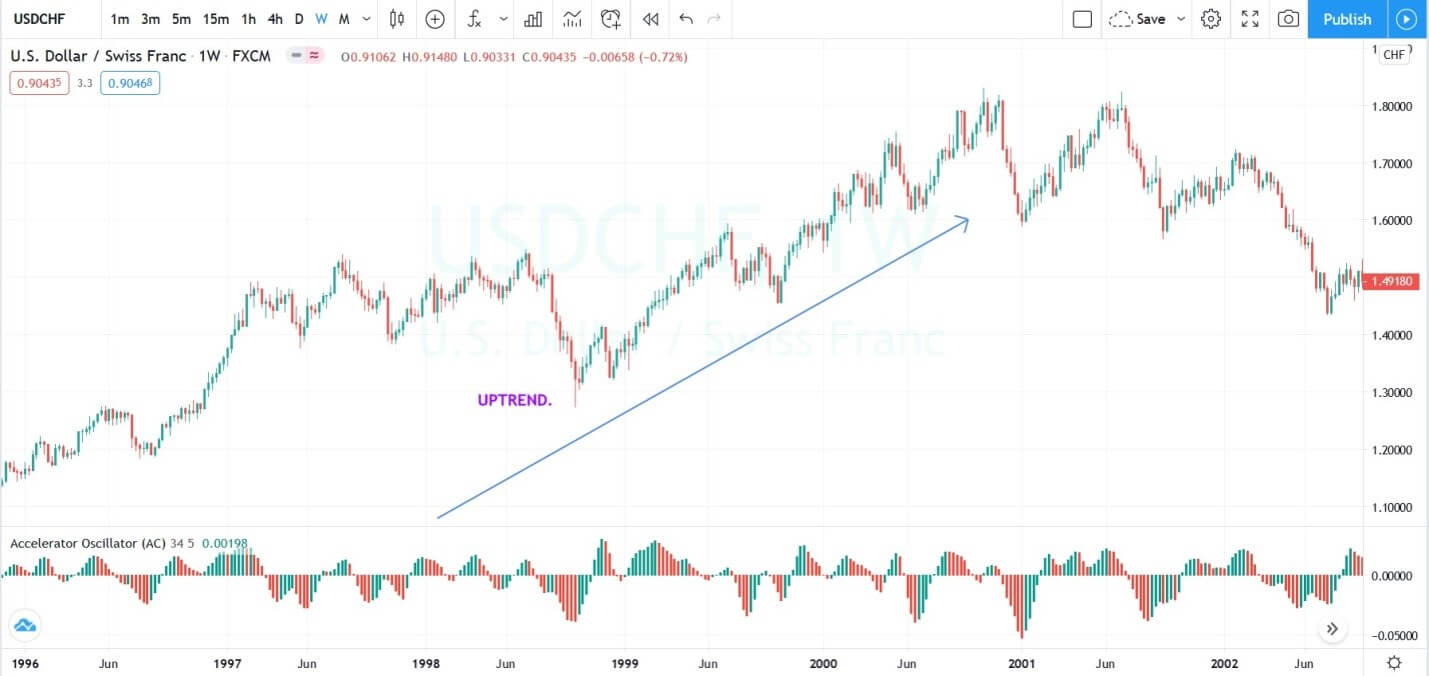
The image below represents the uptrend in the USDCHF forex pair.
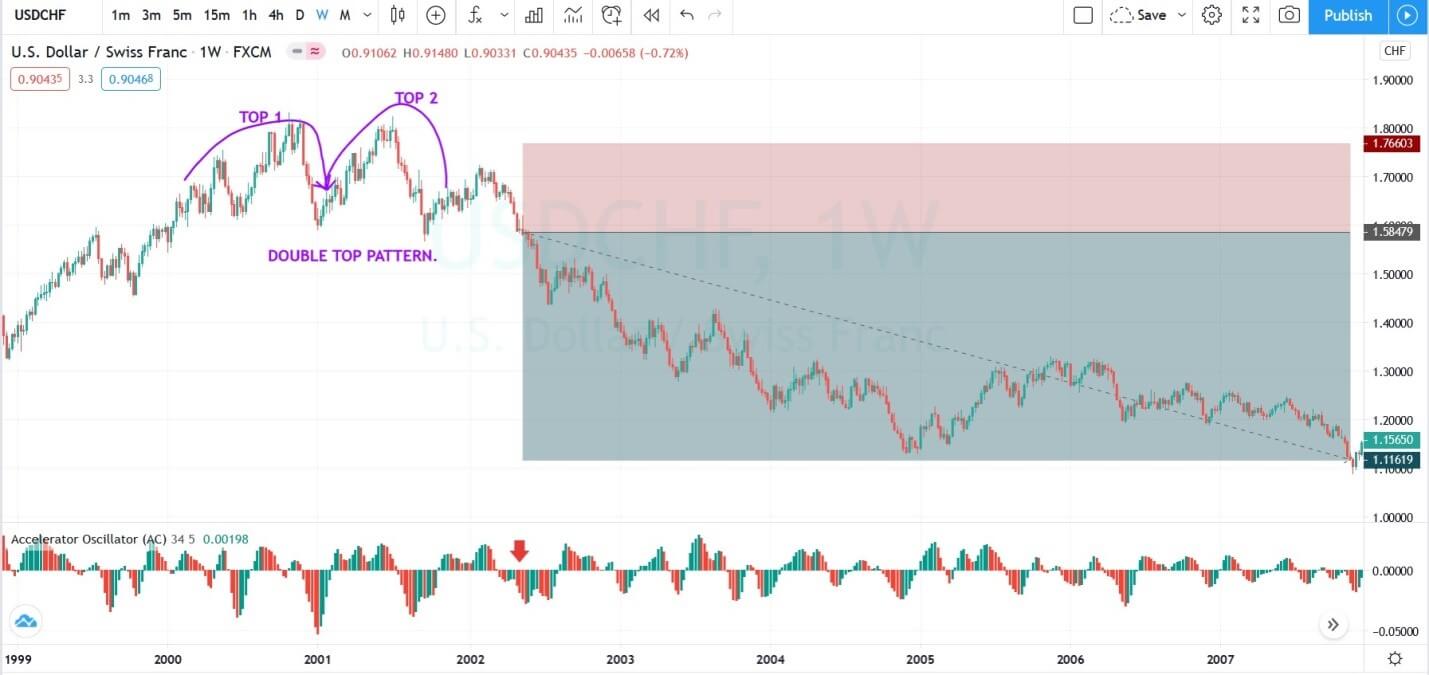
The image below represents our entry, exit, and stop loss in the USDCHF forex pair. As you can see, the pair was in an uptrend, and after the completion of the double top pattern, we choose to go short around the most recent lower high. After our entry price action smoothly goes down, and we witnessed the brand new lower low.
FOR SELLING
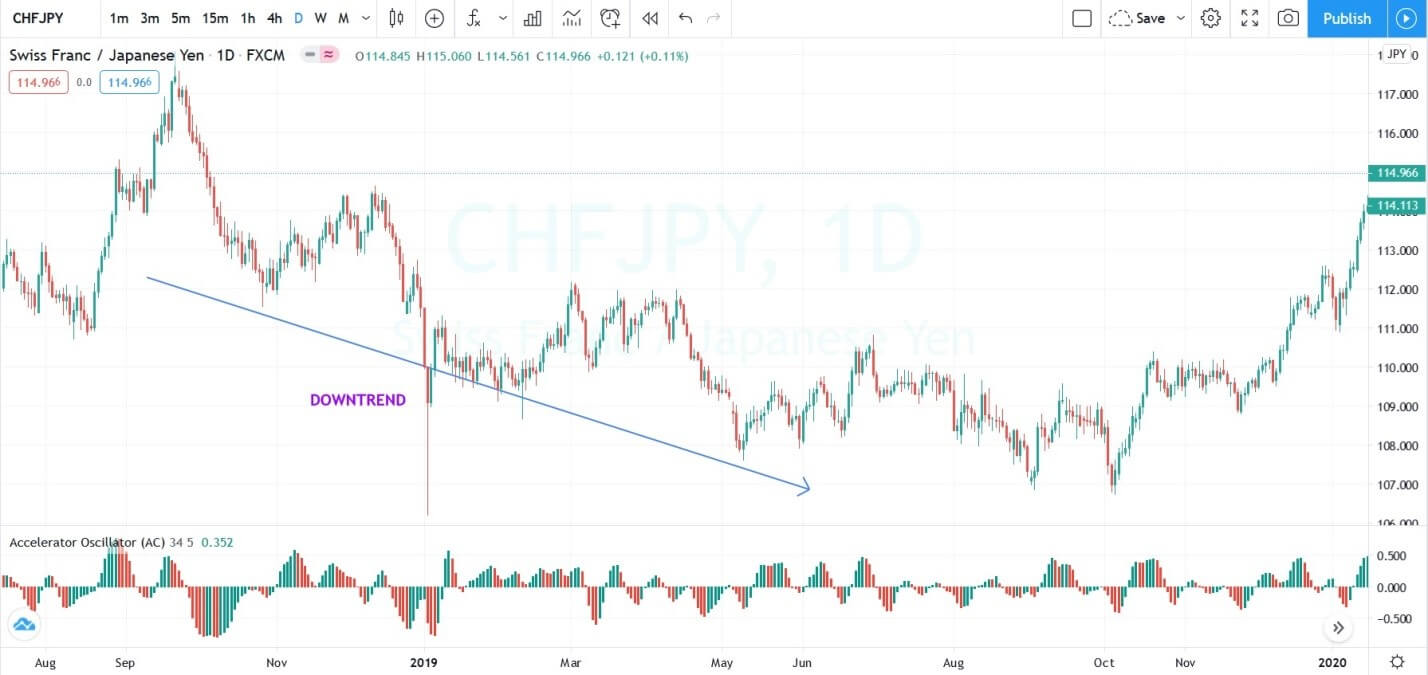
The image below represents the downtrend in the CHFJPY forex pair.
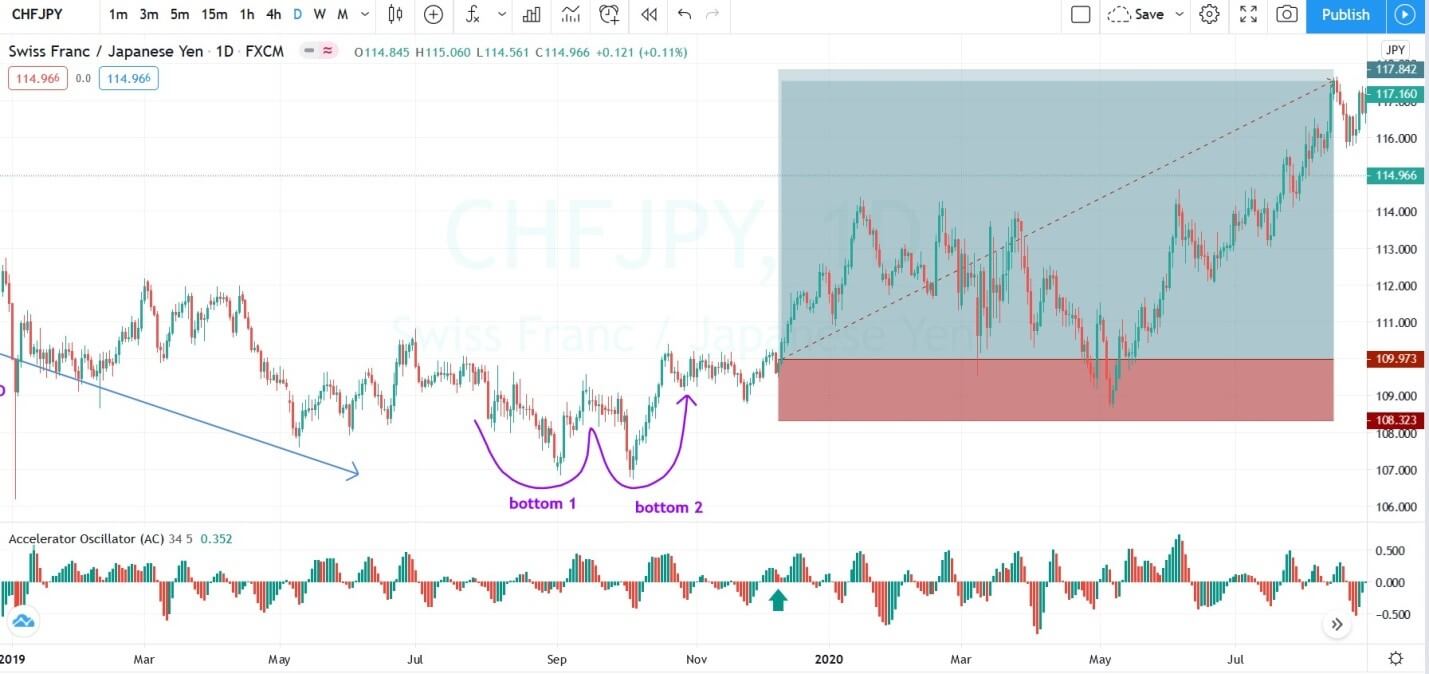
The image below represents the double bottom pattern on the CHFJPY forex pair. As you can see the currency was in a downtrend and when it prints the double bottom pattern as well the Accelerator indicator was also printing the longer green, it was a sign to go long in this currency.
TRADING THE PATTERN BEFORE THE COMPLETION
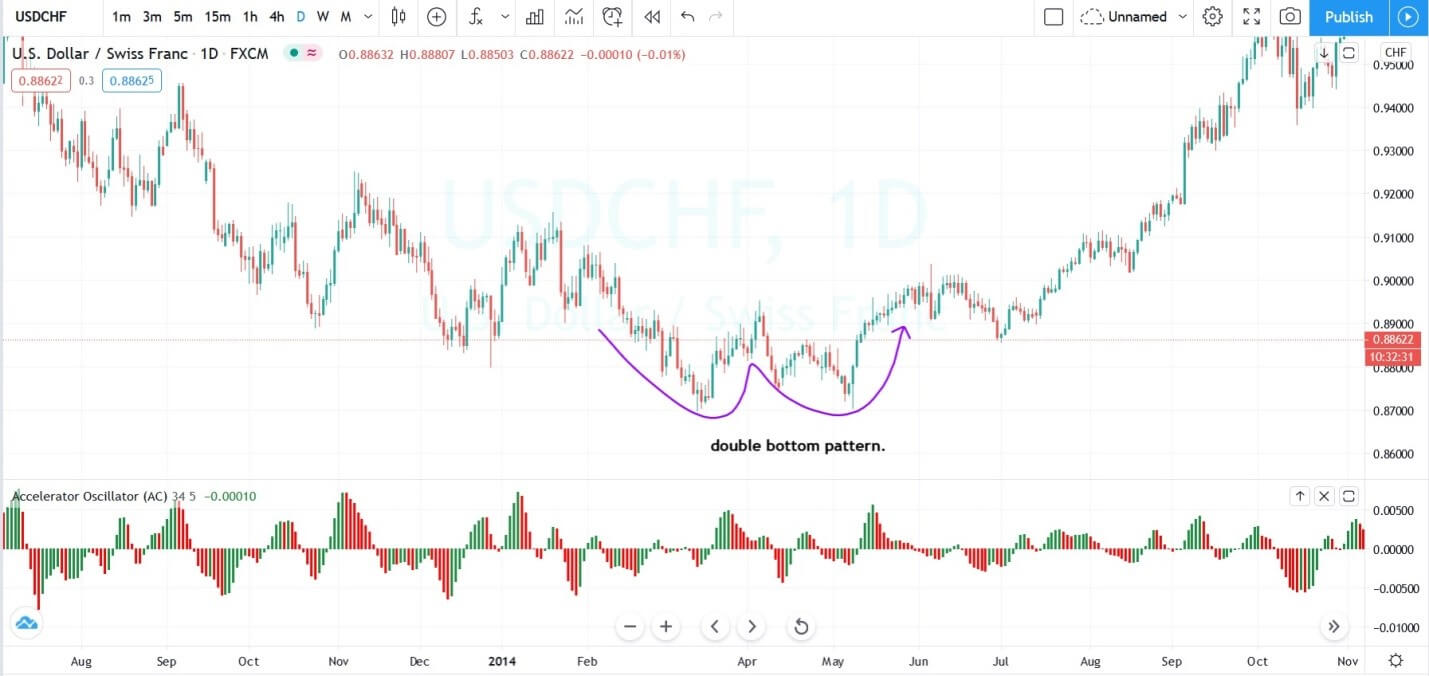
The image below represents the double bottom pattern in the USDCHF forex pair.
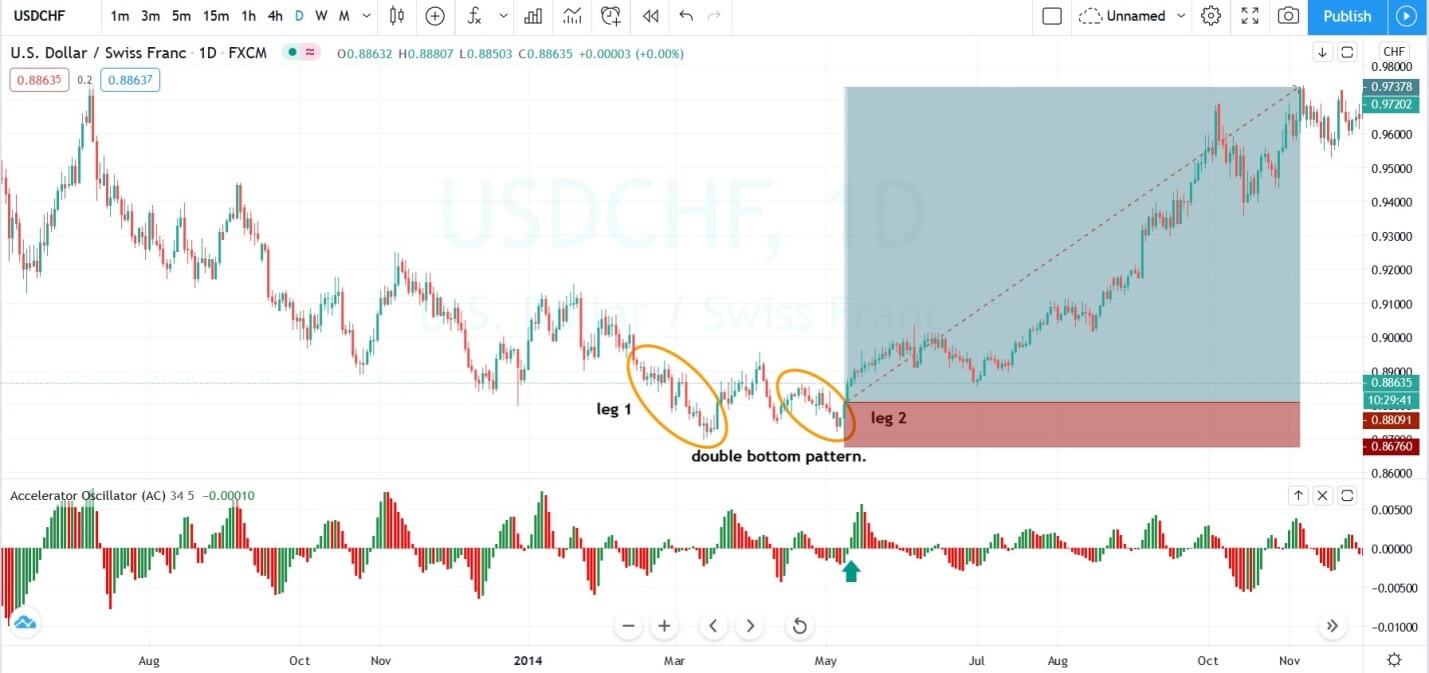
The image below represents the entry, exit, and stop-loss in the USDCHF forex pair. In this pair, we choose to take entry at the second bottom. For trading the pattern even before the completion, you need to do a deep analysis of the pattern. First of all, the trend must be down, and if the downtrend is way weaker then it is even a greater sign. In the image below, buyers and sellers both were holding equal power, which indicates the buyers have more chance to perform.
Furthermore, always compare the first sellers’ leg with the second sellers’ leg, and if the second leg is weaker as compared to the first, then it means we can take the buying entry. In the below image, the leg one sellers were strong, and then the buyers approached when the sellers tried they were way weaker than the buyers which means this would be a second bottom in the market. The Accelerator oscillator goes above the zero line, and the strong buying candle at the double bottom was a sign to go long in this pair.
CONCLUSION
Double top and the double bottom is a leading pattern in the industry which indicates the upcoming reversal in the market. It is very popular in the trading community, and all the type of trades uses this pattern to make consistent money. Pairing it with the accelerator oscillator gave the extra edge to the traders to trade the pattern, In the first strategy we shared how to time the pattern by using the indicator and how to filter out all the low probability pattern formations, and in the above trading strategy, we showed how to trade the second bottom even before the formation of the pattern, so that the traders can easily get the good risk to reward trades. By using these two trading strategies, anyone can master the pattern completely, and end up making a handsome amount of cash.

