Categories
Forex Course Guides

Forex Course 2.0 – Complete Guide

Hello there,

We hope you guys are following the course well. We have done with Course 2.0, and we quickly want to sum up the concepts we have discussed in this course. Also, this article will act as a guide for you in finding any particular articles or for a quick overall revision. Basically, this is a quick navigation guide of Forex Course 2.0.

We have started this course by understanding one of the most important parts of the Forex Industry – Brokers. We also learned the different types of brokers, tips to pick the right broker, and whom to stay away from. We have also understood the different types of analysis that are used by retail traders like us to forecast the price of a currency in the Forex Market. Below is the link for each of the lessons we have published.

Brief History and Introduction to The Forex Brokers – Link

Types 0f Brokers in the Foreign Exchange Market – Link 

Two Types of ‘No Dealing Desk’ Brokers – Link

Understanding the Concept of Spreads in Forex – Link

Two Different Types Of Spreads In The Forex Market – Link

Picking A Genuine Forex Broker 101 – Link

How to stay away from the Forex Bucket Shops – Link

Steps Involved In Opening A Forex Trading Account – Link

Analyzing The Forex Market – Fundamental Analysis – Link

Analyzing the Forex Market – Technical Analysis – Link

Analyzing the Forex Market – Sentimental Analysis – Link

Which is the best way to analyze the market? – Link

So with that, we have ended our course 2.0. The upcoming course 3.0 is the most valuable course we will be providing at Forex Academy. The entire course is going to deal with the Technical Analysis right from the fundamentals. This course is designed by the top price action traders in the industry, and we are super excited to start rolling out this course for our readers. Are you excited too? Stay tuned!

We hope you find this comprehensive guide useful. Let us know if you have any questions regarding Course 2.0 in the comments below. Cheers!

Categories
Forex Harmonic Forex Trading Guides

Harmonic Pattern Guide – Walkthrough

 Harmonic Pattern – Walkthrough

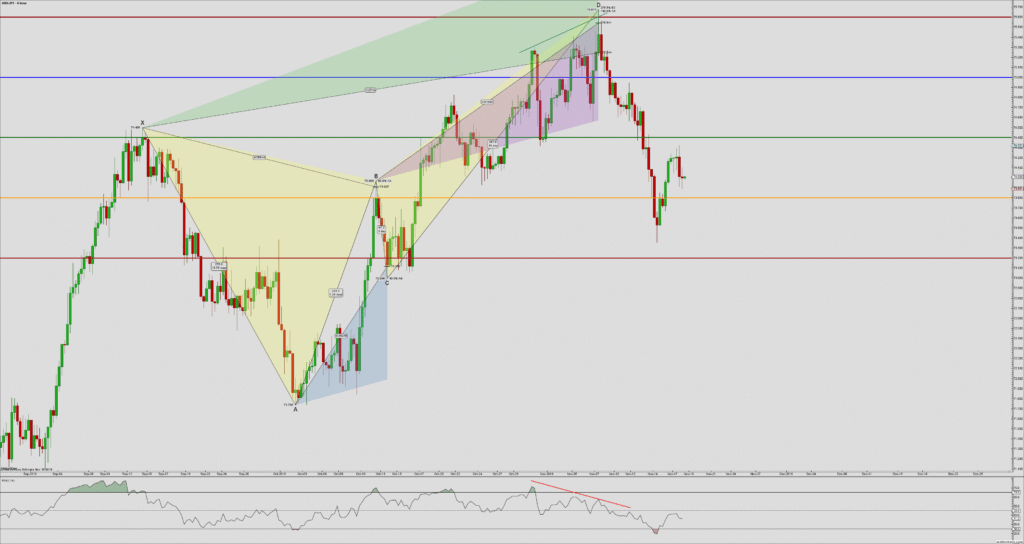
Bearish Butterfly Pattern against 180-degree Square of 9 angle.

The chart above is the AUDJPY Forex pair on its 6-hour chart. If you are unable to identify this pattern without referencing notes or the prior articles, you are not ready to use this form of technical analysis. Regardless, the pattern above is a Bearish Butterfly Pattern.

Harmonic Patterns are by there very nature indicative of imminent price reversals. The PRZ (Potential Reversal Zone) is, in my opinion, the most critical level when determining whether to utilize a Harmonic Pattern in my trading. A Harmonic Pattern itself is not a sufficient enough form of analysis to decide whether or not to take a trade. Harmonic Patterns, in my opinion, should not be used as a primary form of analysis, but rather a complementary or confirmatory form of analysis. The chart above is an excellent example of this.

The horizontal levels on AUDJPY’s chart are derived from W.D. Gann’s Square of 9 – natural number values that represent angles. The methods and theories in Gann Analysis are an entirely different topic and require years of study and research – but for this article, one component of his work will help make my point. The red horizontal line at the top is a 180-degree Square of 9 angle. The 180-degree Square of 9 angle is already a strong and naturally powerful level of resistance. When I see price is near the 180-degree Square of 9 angle, I know one thing is for sure:

There is a high probability that the AUDJPY will have difficulty crossing this level and a high probability of price, at least initially, being rejected from moving higher.

So I would naturally look to be taking a short trade if the market shows rejection at that level. That is where the presence of a Harmonic Pattern is desirable. The Bearish Butterfly Pattern is one of the most reliable and most powerful reversal patterns in all Scott Carney’s work. I know that the Butterfly Pattern typically shows up at the end of a swing – not necessarily a trend, but the end of a swing. If I see a Bearish Butterfly Pattern, I know one thing is for sure:

The Bearish Butterfly Pattern is a reversal pattern. I also understand that the Bearish Butterfly Pattern appears at the top of a swing, indicating an extended and overdone market.

After seeing price approach, the naturally strong reversal level of the 180-degree Square of 9 angle, and then the completion of a Bearish Butterfly Pattern, I believe that there is a sufficient amount of analysis to risk taking a short trade. A short trade is further validated by the completion of a bearish engulfing candlestick, as well as some lengthily bearish divergence on the RSI.


Categories
Forex Harmonic Forex Trading Guides

Harmonic Patterns – Start Here

Harmonic Patterns – Start Here

Harmonic Patterns are an advanced form of analysis and require more than a basic understanding of the technical analysis of financial markets. For those of you who have familiarized yourself with the application of Fibonacci levels, Harmonic Pattern Analysis will, perhaps, be of use to you. The following is a list of the Harmonic Patterns available for learning here at Forex Academy. The suggested order of learning about these patterns is below.

Phase One – Basic Harmonic Patterns

AB = CD

The Gartley Pattern

Phase Two – Advanced Patterns

The Butterfly Pattern

The Bat Pattern

The Alternate Bat Pattern

The Crab Pattern

The Deep Crab Pattern

The Shark Pattern

The Cypher Pattern

The 5-0 Harmonic Pattern

Phase Three – Application

Harmonic Pattern Walkthrough

The article above provides an example of how to use Harmonic Patterns in your own analysis and trading.


Sources: Carney, S. M. (2010). Harmonic trading. Upper Saddle River, NJ: Financial Times/Prentice Hall Gartley, H. M. (2008). Profits in the stock market. Pomeroy, WA: Lambert-Gann Pesavento, L., & Jouflas, L. (2008). Trade what you see: how to profit from pattern recognition. Hoboken: Wiley

Categories
Elliott Wave Guide Forex Elliott Wave

Essential Elliott Wave Theory Guideline

Recently, we ended the series that presents the basic concepts of the Elliott Wave Theory. In this guideline, we disclose the contents developed.

  1. Fundamentals of Elliott Wave Theory. Divided into three parts, we introduce the basic concepts of the wave principle.
    1. Wave principle and the five-waves structure.
    2. Motive waves, corrective waves, and cycles.
    3. Degrees and labeling.
  2. Planning the First Wave Analysis. In this two-parts chapter, we explain the necessary steps to analyze using the Elliott wave principle.
    1. Setting charts and the identification process.
    2. Proportionality and the relationship between price and time.
  3. Impulsive Waves Construction. This section offers the key concepts to understand the nature of impulsive waves.
    1. Nature of impulsive waves and the alternation principle.
    2. The channeling process.
    3. Extensions.
    4. Leading and Ending Diagonal.
  4. Corrective Waves Construction. Elliott, in his Treatise, spent a large part of time describing corrective waves. In this section, we present different corrective formations.
    1. Nature of corrective waves and alternation.
    2. Zig-zag pattern.
    3. Flat pattern.
    4. Triangles.
    5. Complex corrective waves.
  5. Elliott Wave Theory and Fibonacci. In this one-part article unfolds the keys to use Fibonacci retracement and expansion tools.
  6. Trading the Elliott Wave Principle. We end the cycle of the Elliott wave theory with the five-part guidelines.
    1. Wave three structure trading setup.
    2. Wave five and ending diagonal trading setup.
    3. Zig-zag pattern trading setup.
    4. Flat pattern trading setup.
    5. Triangle formation trading setup.
Categories
Forex Harmonic

AB=CD Pattern

AB=CD Pattern

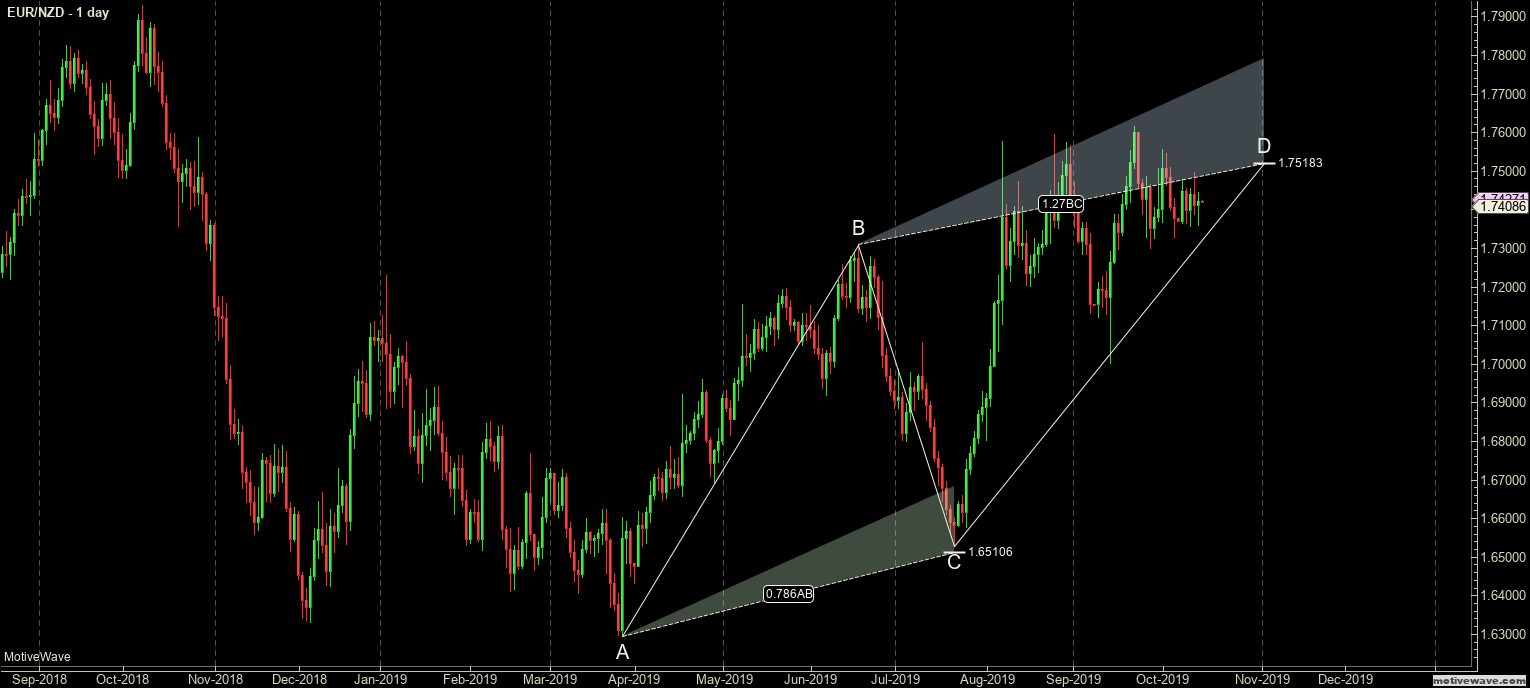
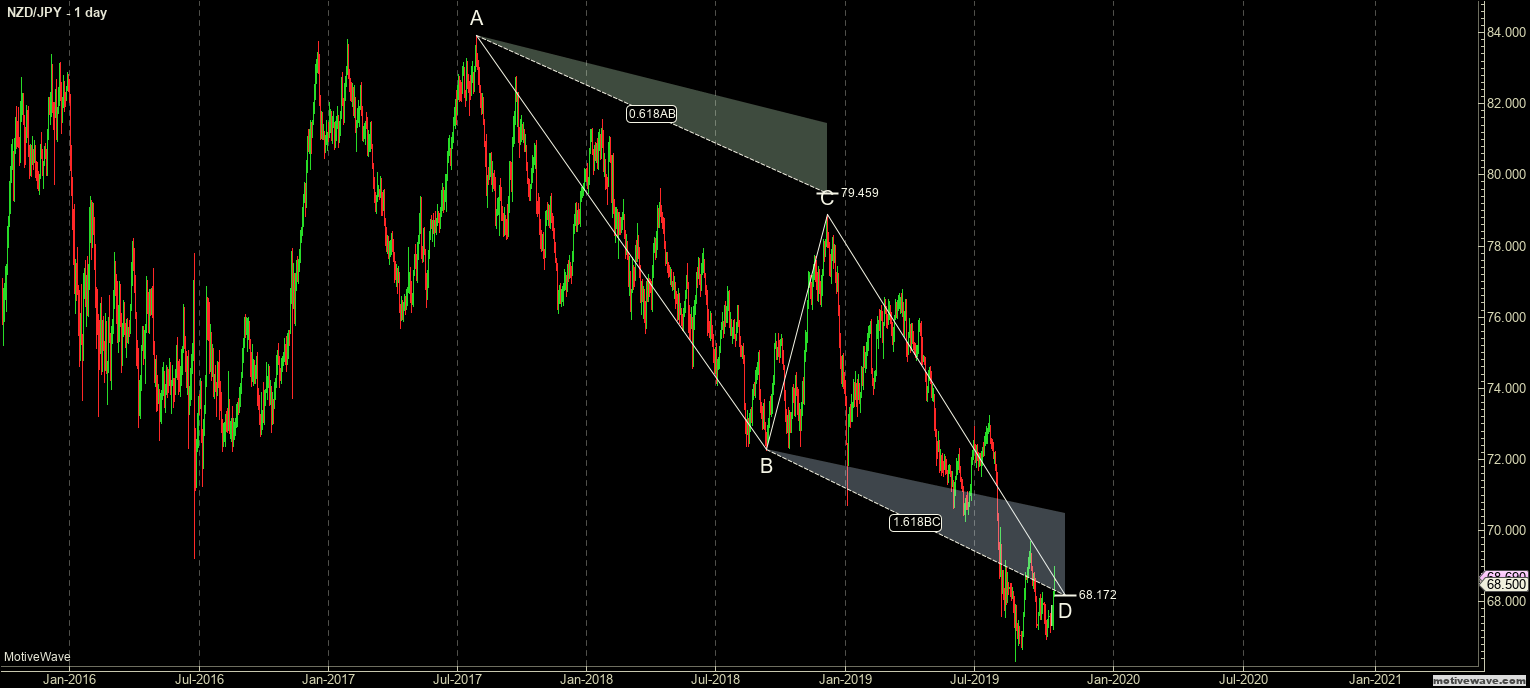
Bearish AB=CD Harmonic Pattern
Bullish AB=CD Harmonic Pattern

The AB=CD Harmonic Pattern is the most basic and common pattern in harmonic geometry. It is the building block of all other patterns. It is the ‘bread and butter’ pattern. Pesavento and Carney recommended that this pattern should be learned first – and reading this article does not qualify for having learned this pattern. Like any form of analysis, you will need to regularly and consistently train your brain and eyes to find this pattern. You won’t be able to get very far in the study of harmonic patterns until you can see this pattern just by glancing at a chart.

Rules

  1. BC cannot exceed AB.
  2. D must exceed B to form a completed AB=CD pattern.

Characteristics

  1. CD is an extension of AB, generally from the Fibonacci ratio of 1.27% to 2.00%.
  2. CD’s slope is steep or longer/wider than AB.
  3. BC often corrects to the Fibonacci ratios of 38.2%, 50%, 61.8%, or 78.6%.


AB=CD Pattern Reciprocal Ratios

Point C Retracement BC Projection
38.2% 24% or 261.8%
50% 200%
61.8% 161.8%
70.7% 141%
78.6% 127%
88.6% 113%


Sources: Carney, S. M. (2010). Harmonic trading. Upper Saddle River, NJ: Financial Times/Prentice Hall Gartley, H. M. (2008). Profits in the stock market. Pomeroy, WA: Lambert-Gann Pesavento, L., & Jouflas, L. (2008). Trade what you see: how to profit from pattern recognition. Hoboken: Wiley