Harmonic Pattern – Walkthrough
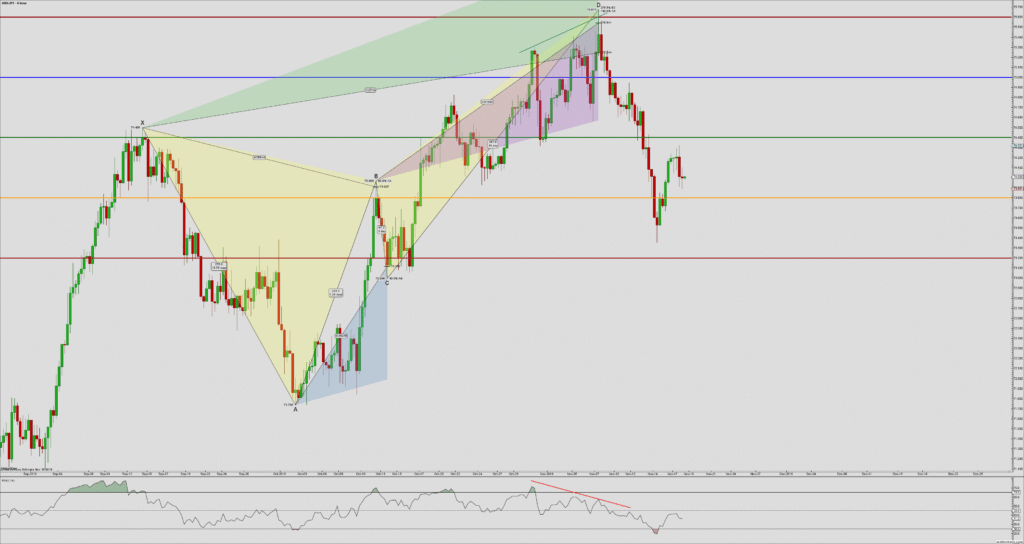
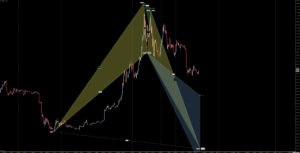
The chart above is the AUDJPY Forex pair on its 6-hour chart. If you are unable to identify this pattern without referencing notes or the prior articles, you are not ready to use this form of technical analysis. Regardless, the pattern above is a Bearish Butterfly Pattern.
Harmonic Patterns are by there very nature indicative of imminent price reversals. The PRZ (Potential Reversal Zone) is, in my opinion, the most critical level when determining whether to utilize a Harmonic Pattern in my trading. A Harmonic Pattern itself is not a sufficient enough form of analysis to decide whether or not to take a trade. Harmonic Patterns, in my opinion, should not be used as a primary form of analysis, but rather a complementary or confirmatory form of analysis. The chart above is an excellent example of this.
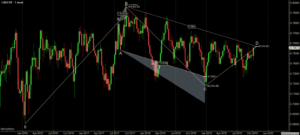
The horizontal levels on AUDJPY’s chart are derived from W.D. Gann’s Square of 9 – natural number values that represent angles. The methods and theories in Gann Analysis are an entirely different topic and require years of study and research – but for this article, one component of his work will help make my point. The red horizontal line at the top is a 180-degree Square of 9 angle. The 180-degree Square of 9 angle is already a strong and naturally powerful level of resistance. When I see price is near the 180-degree Square of 9 angle, I know one thing is for sure:
There is a high probability that the AUDJPY will have difficulty crossing this level and a high probability of price, at least initially, being rejected from moving higher.
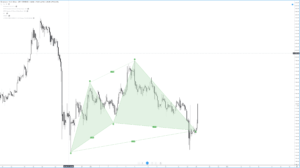
So I would naturally look to be taking a short trade if the market shows rejection at that level. That is where the presence of a Harmonic Pattern is desirable. The Bearish Butterfly Pattern is one of the most reliable and most powerful reversal patterns in all Scott Carney’s work. I know that the Butterfly Pattern typically shows up at the end of a swing – not necessarily a trend, but the end of a swing. If I see a Bearish Butterfly Pattern, I know one thing is for sure:
The Bearish Butterfly Pattern is a reversal pattern. I also understand that the Bearish Butterfly Pattern appears at the top of a swing, indicating an extended and overdone market.
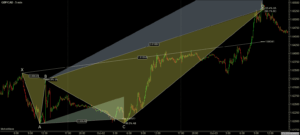
After seeing price approach, the naturally strong reversal level of the 180-degree Square of 9 angle, and then the completion of a Bearish Butterfly Pattern, I believe that there is a sufficient amount of analysis to risk taking a short trade. A short trade is further validated by the completion of a bearish engulfing candlestick, as well as some lengthily bearish divergence on the RSI.