Introduction
Harmonic patterns have always been popular among a set of traders around the world. So it is essential to learn them to have an edge over the market. There are two different types of Harmonic Patterns. The first type is external, and the second is internal. External Harmonic patterns include Butterfly and crab patterns. Whereas the internal Harmonic patterns include Gartley and Bat patterns. In today’s article, let’s discuss how to trade the Butterfly pattern profitably.
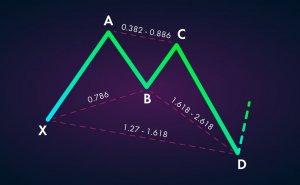
The Butterfly is both a bullish and bearish reversal pattern that falls into the category of the Harmonic group. It is developed by H.M Gartley. Scott Carney and Larry Pesavento then fine-tuned the pattern by adding the Fibs ratios. This harmonic pattern is composed of four legs, and they are marked as ‘X-A,’ ‘A-B,’ ‘B-C,’ and ‘C-D.’ The Butterfly pattern mostly appears at the end of the trend indicating a trend reversal.
By identifying this pattern on the price charts, traders can enter a trade anticipating a potential market reversal. The Butterfly structure on the chart resembles the letter’M’ in a downward trend. Conversely, in an uptrend, the pattern looks like a ‘W.’
Butterfly Pattern Rules
To confirm the appearance of the Butterfly pattern, the rules below must be met. Remember to accept the pattern even if the levels are closer to these Fib ratios. If we stick these levels only, we might be missing on well-performing trades as the setups with the exact Fib levels hardly occur.
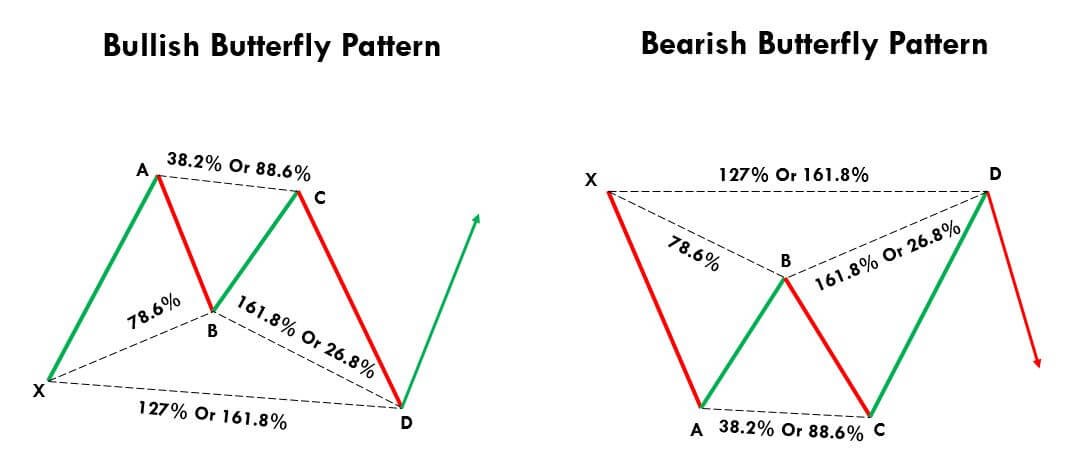
‘X-A’ – This is the initial move of the Butterfly pattern, and in a downtrend, this leg is formed when the price drops sharply from point X to A. Likewise, in an uptrend, this leg is formed when price moves up swiftly from X to A.
‘A-B’ – The B point should retrace 78.6% of X-A leg.
‘B-C’ – The B-C move should retrace 38.2% or 88.6% of the A-B move.
‘C-D’ – The C-D move is the final and most crucial move of the pattern. If the B-C is 88.6% of the A-B, then the C-D must be reached the 261.8% extension of BC. On the other hand, if the B-C is 38.2% of A-B, then the C-D must reach the 161.8% extension of B-C.
A pictographic representation of the same is shown below.
How To Trade The Butterfly Pattern
Trading The Bullish Butterfly Pattern
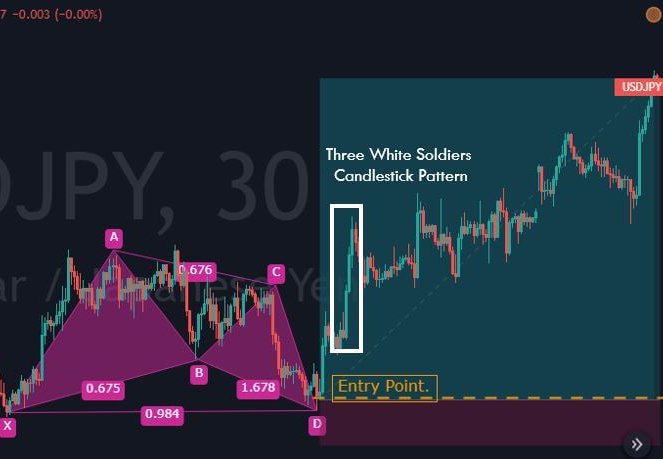
The below picture is a 30-minute chart of the USD/JPY Forex pair. We have identified the Butterfly pattern and plotted Fib levels on to that. As we can see, the first X-A leg started as a random bullish move on the price chart. The second A-B bearish move retraces close to the 78.6% of the X-A move.
Furthermore, the B-C moves reach close to 88.6% of the A-B move. The last C-D bullish move reaches almost close to the161.8% of the B-C movement. So after the appearance of all the four legs, we confirm the formation of the Bullish Butterfly Pattern. Now let’s how we are going to trade this pattern.
Once the price action completes the CD move, we must wait for 2 to 3 bullish candles to take a buy entry in the USD/JPY pair. We must enter the market right after the appearance of the Green confirmation candles. As we can see in the above image, the market blasted to the north right after the appearance of confirmation candles.
Always remember that we are dealing with probabilities and not certainty while trading. So as technical traders, we must adjust according to the market sentiment. The ideal way is to exit our positions when the price approaches the level of point A. But in this particular trade, the market shows excessive volatility as we can see the appearance of a ‘three white soldiers’ candlestick pattern. As per our learnings, we know when this pattern appears, the trend is going to continue.
So we must place deeper targets in this Forex pair. That’s the reason why we didn’t book any partial profits and closed our whole position at a significant resistance area. So in any given trade, always decide your risk-management according to the market situation. Furthermore, we put the stop loss just below the X point, which is the safest position to set a stop-loss. Because, if the price breaks this point, directly it invalidates the Butterfly pattern.
Trading The Bearish Butterfly Pattern
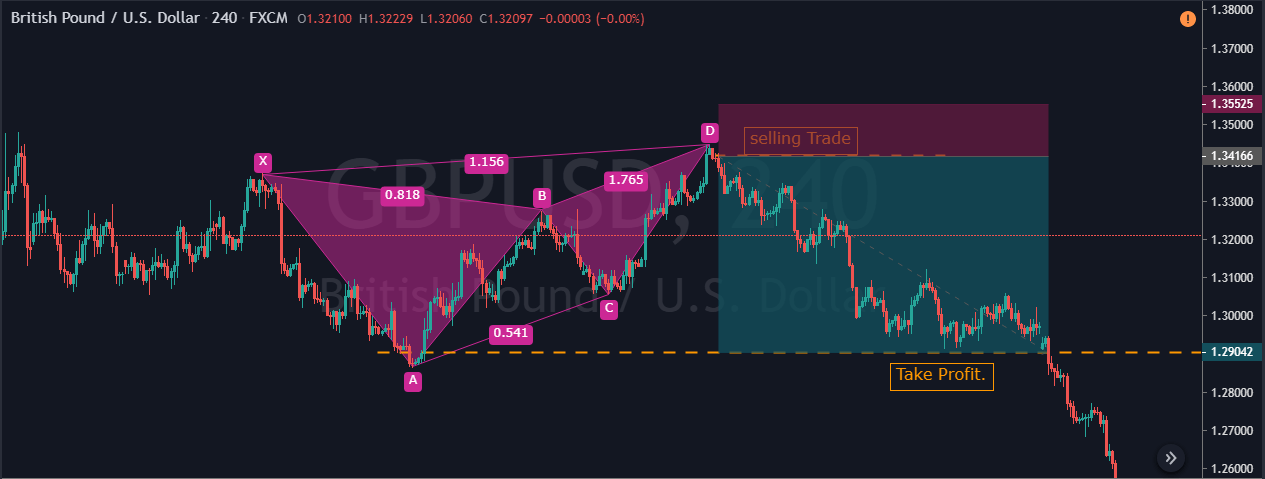
The below image represents the 240-min chart of the GBP/USD Forex pair. We have identified the formation of a Bearish Butterfly pattern in this chart. In a downtrend, the first X-A leg started as a random bearish movement in the market. The A-B leg is a bullish move that retraces close to the 78.6% of the X-A leg. Then the third B-C movement is the bearish move again, and it retraces close to the 38.2% of the A-B move. Then finally, the C-D move happened, which completes the formation of the Bearish Butterfly Pattern.
As we can see in the above picture, the last leg retraces to the upside, and it was close to the 161.8% extension of the BC move. When the price action completes the C-D leg, it prints a couple of red confirmation candles indicating a potential market reversal. Hence in this pair, we took a sell at D point, and the stop-loss placement was just above the D point. We didn’t book any partial profit at point B or C; instead, we closed our whole position at our final target, which is point A.
When and When Not to Trade The Butterfly Pattern?
The good thing about Harmonic patterns is that they work very well in all the types of markets. They also work wonderfully in every market condition. We believe you have clearly understood that the Butterfly is a reversal pattern. We must use all of our previous learnings to win a trade. For instance, if a bullish Butterfly pattern is formed in a strong downtrend, try to avoid trading that pattern. This is because it is difficult for a single pattern to completely reverse the market trend.
If the market was in an uptrend, which is now turning into a dying channel, and if we identify a bearish Butterfly pattern on the price chart, the probability of it being an accurate trading signal is more. Sometimes we can observe the market printing a pattern within the pattern. This also increases the likelihood of our trades. For instance, we can see the formation of a ‘Three White Soldiers’ pattern (below chart) in one of the examples we discussed.
This example is not in the context of trading the Harmonic pattern as a whole but in the context of placing our take-profit orders while trading Harmonic patterns.
Alternative to Harmonic Patterns?
It is a bit difficult for new traders to learn and implement the Harmonic patterns on their trades. So, in the beginning, new traders can also use other forms of technical analysis tools to trade the market. These harmonic patterns are used by most of the professional traders in the industry as they provide an excellent risk to reward ratio. But once you gain some experience, you can try trading harmonic patterns on the demo account, and if you are confident enough, you can apply them to the live charts.
In the end, price action trading is the only tool which can be considered as a complete alternative to the harmonic pattern trading. But a large part of the traders in the industry does not know how to use price action alone to trade the market. So for them, candlestick pattern trading combined with technical indicators is the best method to trade. Overall, yes, there is an alternative to harmonic pattern trading. However, most of the traders in the market aren’t aware of it.
Bottom Line
The one main benefit of identifying and trading the Butterfly pattern is that it helps the traders to identify the top and bottom of the price action so that they can ride the whole trend. The Butterfly pattern is the easiest one in the harmonic group, which provides highly profitable trading signals. The Fibonacci extension levels are an integral part of trading the Butterfly pattern. If the Fib ratios are not attached to your pattern, make sure to add the fibs manually to your price chart so that you can visualize the pattern correctly. Best of luck!


