Introduction
Bryce Gilmore and Larry Pesavento are the ones to first discovered the Butterfly pattern. It is a harmonic reversal pattern, and it is composed of four legs. The trading of this pattern is similar to the trading of Gartley and Bat patterns that we have learned in previous lessons. The Butterfly pattern helps us in identifying the end of the current move so that we can take the trade. There are both bullish and bearish Butterfly patterns, and we must be going long if we find a bullish butterfly and vice-versa.
Four legs of the Butterfly Pattern
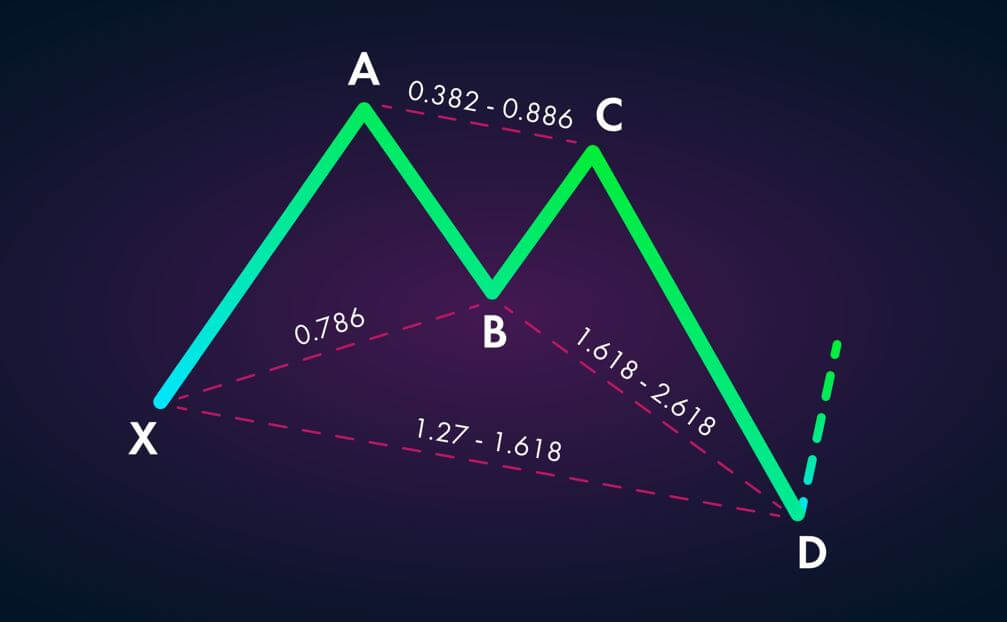
XA – In its bearish version, the first leg of the pattern forms when the price action drops from the point X to A.
AB – The AB leg reverses its direction and retraces to 78.6% Fib level of the distance covered by XA.
BC – In the BC leg, the price action changes its direction and moves back down. It then retraces between 38.2% and 88.6% Fib levels of the distance covered by AB.
CD – This is the final leg of the pattern, and if this leg goes wrong, we can consider the pattern formed till now as invalid. The CD leg must reach between 127% and 161.8% Fib extension of the AB leg. Take the sell trade at point D.
How To Trade The Butterfly Pattern?
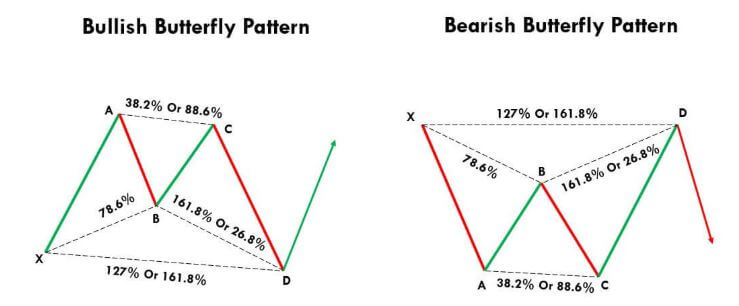
Bullish Butterfly Pattern
We have identified the formation of the Butterfly pattern in the USD/JPY Forex pair. The first push ‘XA’ was a random leg on the price chart. The second leg is a countertrend move, and it retraces to the 78.6% Fib level of the XA leg. For the third leg, price action goes up, and the BC leg reaches 88.6% of the AB move. Finally, the CD leg enabled the price to the 161.8% level of BC move.
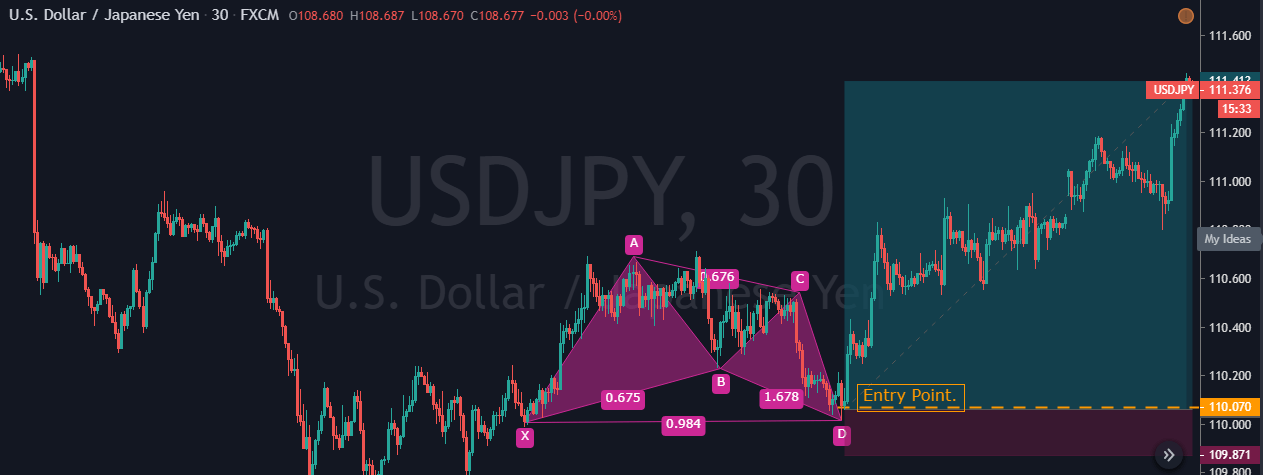
Since all the legs are formed according to the instructions, we can consider this a Bullish butterfly pattern. When price action completed the last leg, we activated our buy trade in this pair. The stops are placed below the trade, and the take profit was placed at point A.
Bearish Butterfly Pattern
The chart below represents the formation of a bearish butterfly in a downtrend. The first XA bearish leg was any random move in the market. The AB leg goes countertrend, and it retraces 78.6% of the XA leg. The BC move was bearish again, and it retraces to 38.2% of the AB move. Now that the three legs are completed, all we need is to confirm the last leg to ho short in this pair. For printing the last leg, price action again goes back up, and it reached the 161.8% of the BC move.
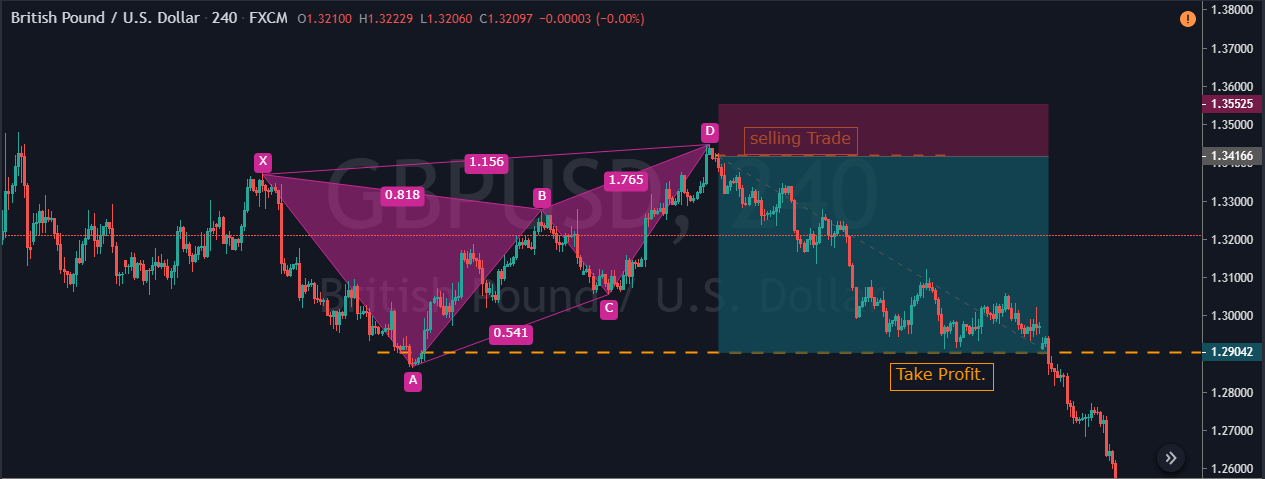
After all these legs, price action prints a bearish butterfly pattern, and the trade activation was at point D. The first take-profit was at point C, and the second take profit was at point A. We have placed the stop-loss order below the point D. The reason for shallow stops is that if the price goes above point D, the pattern itself becomes invalid.