Categories
Forex Elliott Wave

Alternation and Extensions in the Wave Analysis – Advanced Level

Introduction

In previous articles, we discussed the concepts of alternation and extensions and their importance in wave analysis.

R.N. Elliott, in his work “The Wave Principle,” described alternation as a principle of nature. Likewise, since financial markets are the result of human activity, and consequently part of nature, they are governed by the “law of nature.”

Elliott also identified the existence of extensions as part of impulsive movements. In particular, in his Treatise, Elliott points out that extensions should appear only on one of the three motive waves and never on more than one.

In this educational article, we will review and expand on the concepts of Alternation and Extensions applied in wave analysis.

Alternation

As we have seen in previous articles, alternation can be recognized in different forms, which are detailed as follows:

  1. Price, which corresponds to vertical advance, either increasing or decreasing.
  2. Time, which corresponds to the time taken by the construction of each wave.
  3. Severity, which is the ratio of the wave to the impulsive pattern, this aspect applies only to corrective waves 2 and 4.
  4. Complexity, which refers to the number of subdivisions that the Elliott pattern has in development.
  5. Construction, an Elliott wave pattern, can be a flat, zigzag, triangle, etc.

So far, we have studied the characteristics of alternation in the first three aspects. 

In impulsive structures, they can alternate in terms of time and price. However, in corrective structures, alternation in terms of price is usually not relevant. 

However, on alternation in time, in particular, one must verify the time taken by each phase of the corrective pattern, which in general will be very different from each other. Likewise, in terms of severity, if a corrective wave produces a deep retrace to the previous impulsive wave, likely, the next corrective wave will not show a deep retrace and vice versa.

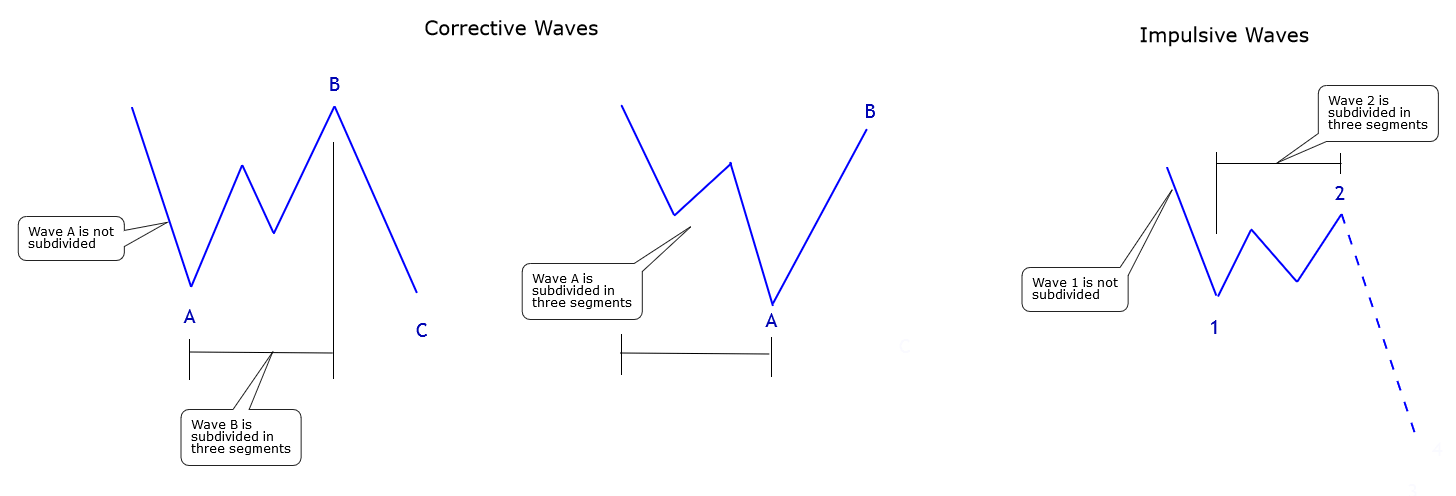
The next aspect that corresponds to the alternation principle is complexity or intricacy, which refers to the number of internal subdivisions that have an Elliott wave pattern, compared to the number of subdivisions that have the adjacent structure.

In practical terms, it will be useful for the analysis of poly-waves and multi-waves. In this way, it will be helpful for one wave to be subdivided and the other not. 

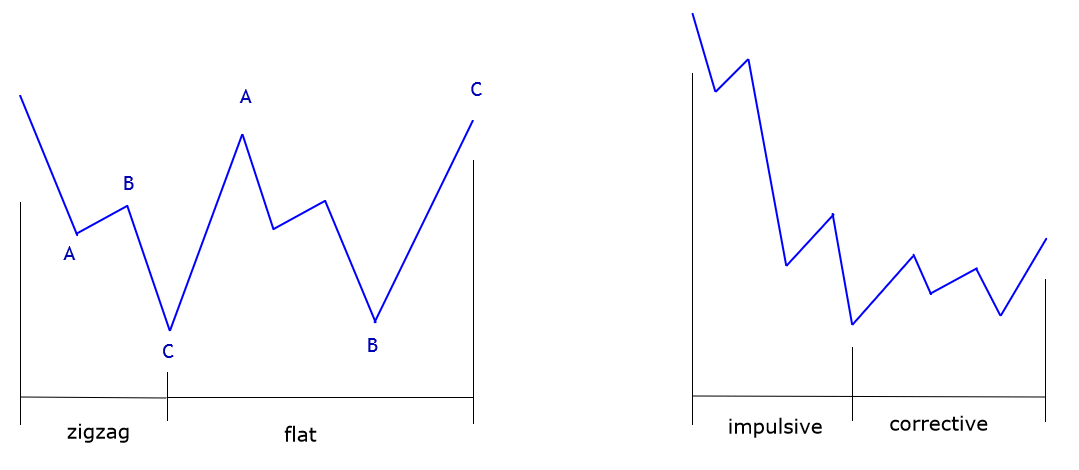
The following figure shows cases for impulsive and corrective structures.

The alternation in terms of construction corresponds to the patterns that compose an impulsive or corrective structure. 

For example, in a corrective sequence in which the first movement is composed of a zigzag pattern, the next corrective move can be any structure, minus a zigzag. 

In this context, in the real market, a typical sequence is first the appearance of a zigzag and then a movement corresponding to a flat pattern, as shown in the following figure. Likewise, if the price action develops an impulsive structure, the next movement will correspond to a corrective structure of the same degree.
 

Extensions

Usually, in wave analysis, the extension and subdivision concepts tend to be used interchangeably. However, Glenn Neely, in his work “Mastering Elliott Wave,” shows that both terms are independent.

On the one hand, the extension corresponds to the wave with the longest movement in favor of the trend. As we have seen in previous articles, the extended wave appears in a single wave, and this may be in the first, third, or fifth wave, but it will never be present in more than one simultaneously.

On the other hand, the term subdivision applies to the number of segments constituting a wave, which can be impulsive or corrective.

Thus, the extended wave will not necessarily be the one with the most subdivisions. Likewise, as the complexity of the wave under study increases, the level of subdivisions that constitute it will also increase.

Finally, as indicated by R.N. Elliott in his Treatise, the extended wave is a relevant factor in terms of the behavior of an impulsive wave, either by what the most complex corrective wave will be. It can also lead the wave analyst to avoid losses and obtain gains from its knowledge.

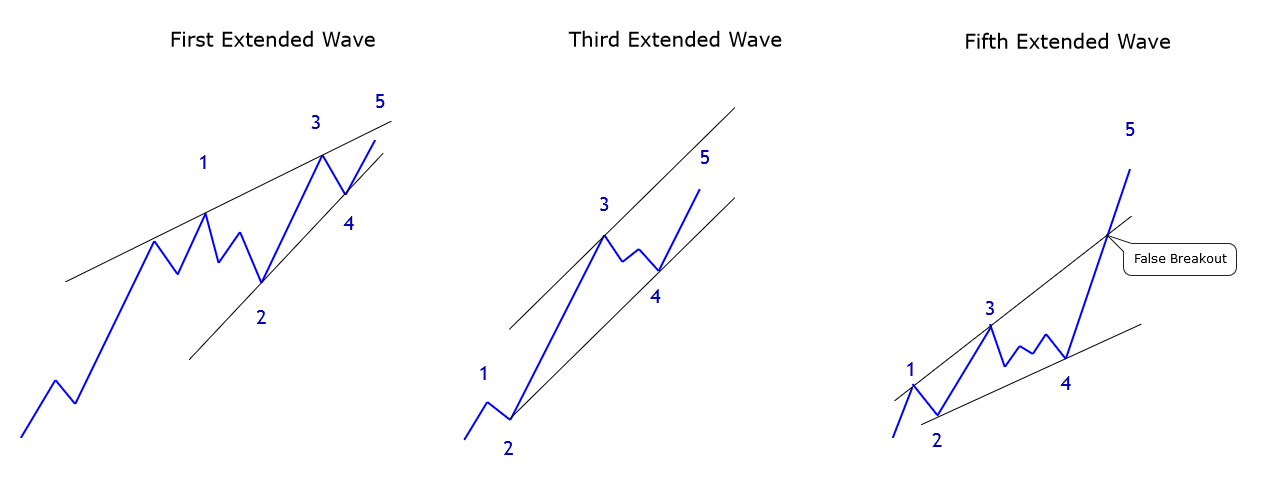
When the first wave is extended, the structural sequence has a wedge shape. In this series of waves, the ends of waves 1 and 3 and waves 2 and 4 are joined. Usually, the fifth wave will end up under the higher guideline. The structure shall be complete when the price action violates the lower guideline joining waves 2 and 4.

When the third wave is the extended one, the fourth wave should not retrace beyond 38.2% of the third wave advance. If the retrace extends beyond 38.2%, this would be indicative of a weakness in impulsive movement, and consequently, the fifth wave should not reach a new high.

Finally, when the fifth wave is the most widespread, waves 1 and 3 may be similar, the third wave being slightly longer than the first and the fourth wave the most complex corrective wave compared to the second wave. The fifth wave will have the appearance of a false rupture of the directive that joins waves 1 and 3.

Conclusions

In this educational article, we have seen the importance of the principle of alternation in wave analysis, which can provide valuable information in the study of price action.

Also, knowledge of the alternation principle can help the wave analyst to identify which wave will be extended. In particular, when the analysts look to incorporate to the trend when it is in progress.

In the next educational article, we will study the process of wave counting and counting.

Suggested Readings

  • Neely, G.; Mastering Elliott Wave: Presenting the Neely Method; Windsor Books; 2nd Edition (1990).
  • Prechter, R.; The Major Works of R. N. Elliott; New Classics Library; 2nd Edition (1990).


Categories
Forex Basic Strategies

Learning To Trade The Bullish & Bearish ‘Butterfly’ Harmonic Pattern

Introduction

Harmonic patterns have always been popular among a set of traders around the world. So it is essential to learn them to have an edge over the market. There are two different types of Harmonic Patterns. The first type is external, and the second is internal. External Harmonic patterns include Butterfly and crab patterns. Whereas the internal Harmonic patterns include Gartley and Bat patterns. In today’s article, let’s discuss how to trade the Butterfly pattern profitably.

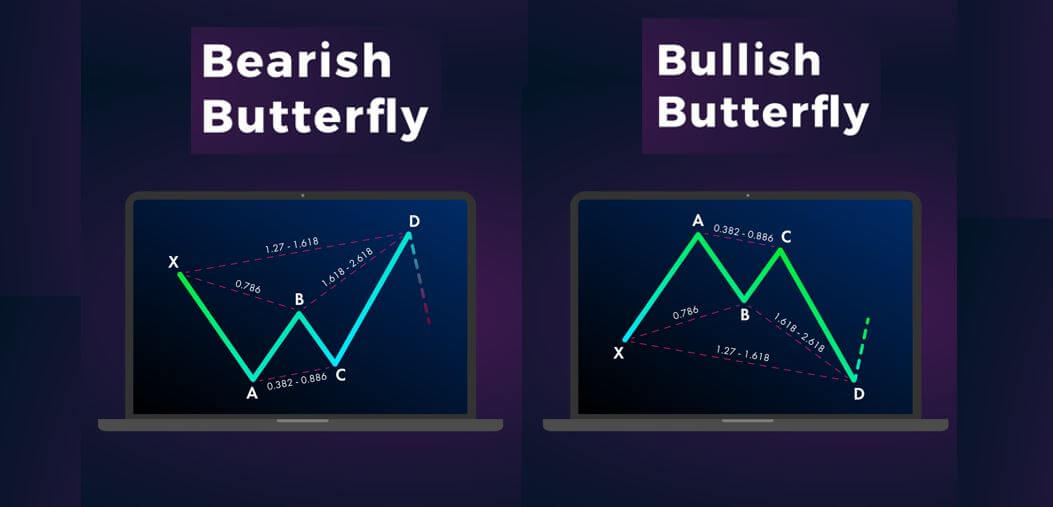
The Butterfly is both a bullish and bearish reversal pattern that falls into the category of the Harmonic group. It is developed by H.M Gartley. Scott Carney and Larry Pesavento then fine-tuned the pattern by adding the Fibs ratios. This harmonic pattern is composed of four legs, and they are marked as ‘X-A,’ ‘A-B,’ ‘B-C,’ and ‘C-D.’ The Butterfly pattern mostly appears at the end of the trend indicating a trend reversal.

By identifying this pattern on the price charts, traders can enter a trade anticipating a potential market reversal. The Butterfly structure on the chart resembles the letter’M’ in a downward trend. Conversely, in an uptrend, the pattern looks like a ‘W.’

Butterfly Pattern Rules

To confirm the appearance of the Butterfly pattern, the rules below must be met. Remember to accept the pattern even if the levels are closer to these Fib ratios. If we stick these levels only, we might be missing on well-performing trades as the setups with the exact Fib levels hardly occur.

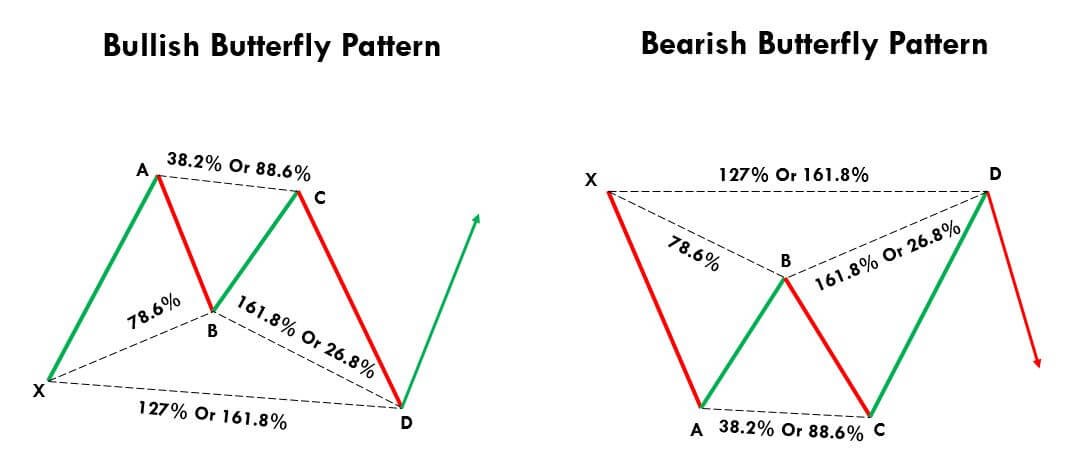
‘X-A’ – This is the initial move of the Butterfly pattern, and in a downtrend, this leg is formed when the price drops sharply from point X to A. Likewise, in an uptrend, this leg is formed when price moves up swiftly from X to A.

‘A-B’ – The B point should retrace 78.6% of X-A leg.

‘B-C’ – The B-C move should retrace 38.2% or 88.6% of the A-B move.

‘C-D’ – The C-D move is the final and most crucial move of the pattern. If the B-C is 88.6% of the A-B, then the C-D must be reached the 261.8% extension of BC. On the other hand, if the B-C is 38.2% of A-B, then the C-D must reach the 161.8% extension of B-C.

A pictographic representation of the same is shown below.

How To Trade The Butterfly Pattern

Trading The Bullish Butterfly Pattern

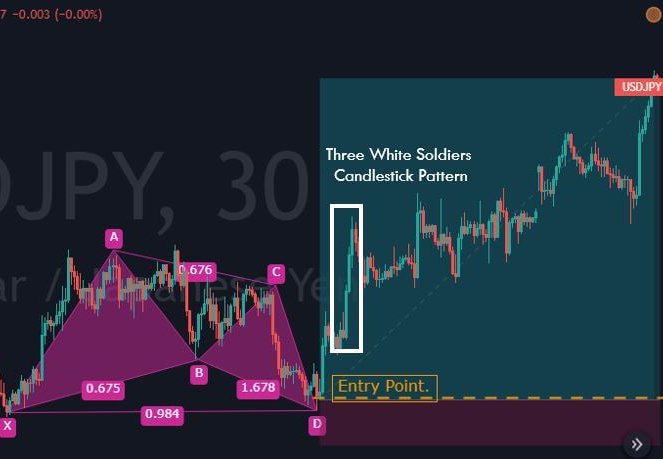
The below picture is a 30-minute chart of the USD/JPY Forex pair. We have identified the Butterfly pattern and plotted Fib levels on to that. As we can see, the first X-A leg started as a random bullish move on the price chart. The second A-B bearish move retraces close to the 78.6% of the X-A move.

Furthermore, the B-C moves reach close to 88.6% of the A-B move. The last C-D bullish move reaches almost close to the161.8% of the B-C movement. So after the appearance of all the four legs, we confirm the formation of the Bullish Butterfly Pattern. Now let’s how we are going to trade this pattern.

Once the price action completes the CD move, we must wait for 2 to 3 bullish candles to take a buy entry in the USD/JPY pair. We must enter the market right after the appearance of the Green confirmation candles. As we can see in the above image, the market blasted to the north right after the appearance of confirmation candles.

Always remember that we are dealing with probabilities and not certainty while trading. So as technical traders, we must adjust according to the market sentiment. The ideal way is to exit our positions when the price approaches the level of point A. But in this particular trade, the market shows excessive volatility as we can see the appearance of a ‘three white soldiers’ candlestick pattern. As per our learnings, we know when this pattern appears, the trend is going to continue.

So we must place deeper targets in this Forex pair. That’s the reason why we didn’t book any partial profits and closed our whole position at a significant resistance area. So in any given trade, always decide your risk-management according to the market situation. Furthermore, we put the stop loss just below the X point, which is the safest position to set a stop-loss. Because, if the price breaks this point, directly it invalidates the Butterfly pattern.

Trading The Bearish Butterfly Pattern

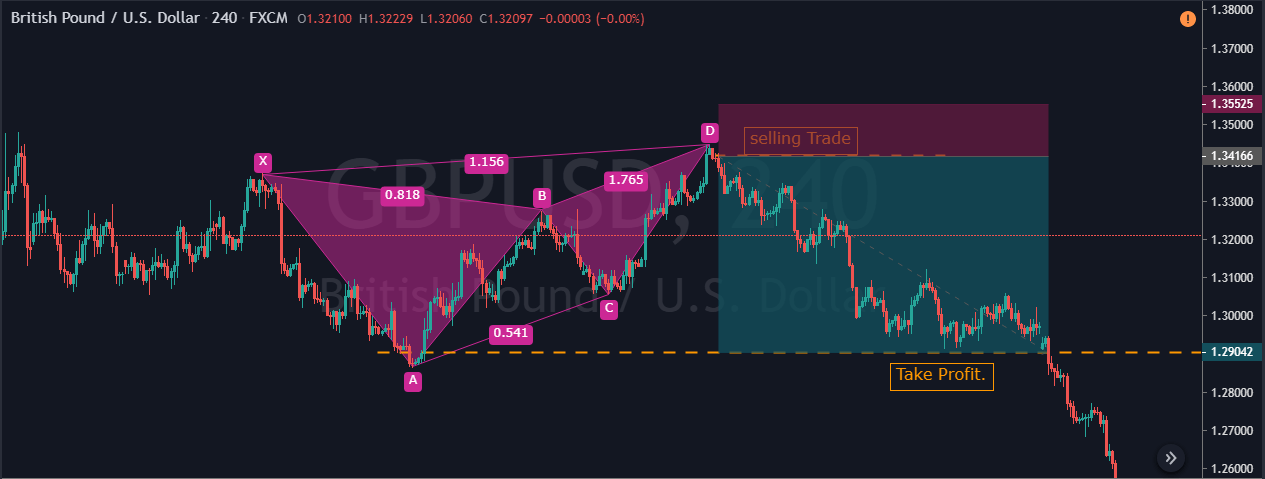
The below image represents the 240-min chart of the GBP/USD Forex pair. We have identified the formation of a Bearish Butterfly pattern in this chart. In a downtrend, the first X-A leg started as a random bearish movement in the market. The A-B leg is a bullish move that retraces close to the 78.6% of the X-A leg. Then the third B-C movement is the bearish move again, and it retraces close to the 38.2% of the A-B move. Then finally, the C-D move happened, which completes the formation of the Bearish Butterfly Pattern.

As we can see in the above picture, the last leg retraces to the upside, and it was close to the 161.8% extension of the BC move. When the price action completes the C-D leg, it prints a couple of red confirmation candles indicating a potential market reversal. Hence in this pair, we took a sell at D point, and the stop-loss placement was just above the D point. We didn’t book any partial profit at point B or C; instead, we closed our whole position at our final target, which is point A.

When and When Not to Trade The Butterfly Pattern?

The good thing about Harmonic patterns is that they work very well in all the types of markets. They also work wonderfully in every market condition. We believe you have clearly understood that the Butterfly is a reversal pattern. We must use all of our previous learnings to win a trade. For instance, if a bullish Butterfly pattern is formed in a strong downtrend, try to avoid trading that pattern. This is because it is difficult for a single pattern to completely reverse the market trend.

If the market was in an uptrend, which is now turning into a dying channel, and if we identify a bearish Butterfly pattern on the price chart, the probability of it being an accurate trading signal is more. Sometimes we can observe the market printing a pattern within the pattern. This also increases the likelihood of our trades. For instance, we can see the formation of a ‘Three White Soldiers’ pattern (below chart) in one of the examples we discussed.

This example is not in the context of trading the Harmonic pattern as a whole but in the context of placing our take-profit orders while trading Harmonic patterns.

Alternative to Harmonic Patterns?

It is a bit difficult for new traders to learn and implement the Harmonic patterns on their trades. So, in the beginning, new traders can also use other forms of technical analysis tools to trade the market. These harmonic patterns are used by most of the professional traders in the industry as they provide an excellent risk to reward ratio. But once you gain some experience, you can try trading harmonic patterns on the demo account, and if you are confident enough, you can apply them to the live charts.

In the end, price action trading is the only tool which can be considered as a complete alternative to the harmonic pattern trading. But a large part of the traders in the industry does not know how to use price action alone to trade the market. So for them, candlestick pattern trading combined with technical indicators is the best method to trade. Overall, yes, there is an alternative to harmonic pattern trading. However, most of the traders in the market aren’t aware of it.

Bottom Line

The one main benefit of identifying and trading the Butterfly pattern is that it helps the traders to identify the top and bottom of the price action so that they can ride the whole trend. The Butterfly pattern is the easiest one in the harmonic group, which provides highly profitable trading signals. The Fibonacci extension levels are an integral part of trading the Butterfly pattern. If the Fib ratios are not attached to your pattern, make sure to add the fibs manually to your price chart so that you can visualize the pattern correctly. Best of luck!

Categories
Forex Course

60. Introduction To Fibonacci Trading

Introduction

We have completed learning most of the basics related to candlesticks and its patters in the previous lessons. In the upcoming articles, let’s upgrade our technical trading skills by learning Fibonacci Trading. This field of study deals with trading the price charts using Fibonacci levels and ratios. In this article, we will briefly talk about what this Fibonacci trading is all about.

Fibonacci levels and ratios were devised by a famous Italian mathematician, ‘Leonardo Fibonacci.’ This Italian number theorist introduced various mathematical concepts that we use in the modern world, such as square roots, math word problems, and number sequencing.

Leonardo Pisano Fibonacci 

Picture Source – Thoughtco

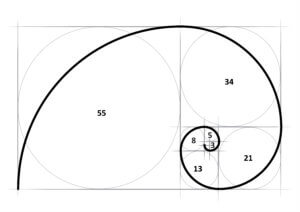
He found out a series of numbers that created ratios. The ratios described the natural proportion of things in the universe. The ratios are derived from the following number series: 0, 1, 1, 2, 3, 5, 8, 13, 21, 34, 55, 89, 144. This number series always starts at 0 and then adding 0+1 to get 1, which is the third number. Then, adding, the second and third numbers to get 2, which is the fourth number and so on.

The Fibonacci ratios are generated by dividing a Fibonacci number to its succeeding Fibonacci number. For instance, both 34 & 55 are Fibonacci numbers, and when we divide 34 with 55, we get 0.618, which is a Fibonacci Ratio. We also call them as Fibonacci Retracements. If we calculate the ratios between two alternative numbers, we get Fibonacci Extensions. For example, when we divide 34 by 89, it will be equal to 0.382, which is a Fibonacci Extension. Below, we have mentioned a few Fibonacci Retracement and Extention values for your reference.

Fibonacci Retracements - 0.236, 0.382, 0.500, 0.618, 0.764 etc.

Fibonacci Extensions - 0, 0.382, 0.618, 1.000, 1.382, 1.618 etc.

Many theories say that once the market makes a big move in one direction, the price will retrace or return partly to the previous Fibonacci retracement levels before resuming in the original direction. Hence traders use Fibonacci retracement points as potential support and resistance levels.

Many traders watch for these levels and place buy and sell orders at these prices to enter or place stops. Traders also use Fibonacci extension levels as profit-taking zones. In order to apply Fibonacci levels on the charts, we need to identify Swing highs and Swing low points, which will be discussed in the upcoming articles.

Fibonacci trading is one of the major branches of Technical Analysis. So it becomes compulsory for every trader to learn what this is all about. In the 21st century, almost all of the brokers provide charting software where we can find Fibonacci tools like indicators and Fibonacci calculators, which makes this aspect of trading very simple and easy.

[wp_quiz id=”62566″]
Categories
Forex Elliott Wave

Impulsive Waves Construction – Part 3

An extension is an essential feature of an impulsive movement. In this article, we will see what the characteristic of this type of movement is.

Extensions

An extension is a movement that characterizes the longest wave of an impulsive wave. This movement allows us to differentiate between an impulse and a correction. An extension may appear in waves 1, 3, or 5, but it will never appear in more than one wave. In the following figure, we see the extended wave of “blue” degree and the “black” grade wave corresponds to the upper degree structure.


Extensions of extensions

As in the previous case, extensions can have internal extensions. The rules for this scenario are the same as in the case of simple extensions.


The following figure corresponds to the Dow Jones Industrial Average (DJI) in the semilog scale. The chart shows the impulsive wave that begins with the October 1987 low at 1,616.2 pts., and concludes on October 2007 when DJI touched the 14,198.1 pts. The cycle ended when DJI made a new low in 2009, reaching the 6,470 pts.

Dow Jones chart shows that the third wave of blue degree is the extended wave. Additionally, the third wave of the black degree is the extension of the extension in the bullish cycle.


Categories
Forex Educational Library

Foundations of Fibonacci Extensions

Introduction

A very popular application of Fibonacci deals with the projection of levels up to where price is expected to further develop. In the article “Foundations of Fibonacci Retracements” (https://www.forex.academy/training/technical-analysis/beginner/foundations-of-fibonacci-retracements/) we covered how to use Fibonacci to locate price areas where impulses could bounce in every wave of a given trend, as well as to its application for risk management (i.e. where to set the Stop Loss). In the following article, we will introduce readers to the basic Fibo extensions as a good set up to exit winning positions.

The first step of the analysis is to draw boxes on the price chart that represent the distances between the top of the range and the closest which Fibonacci retracement level, and from that point to the closest low or high and so on. Priority must be given to the height of the boxes and not to the width. Each box will be subdivided between the Fibonacci retracement levels to determine the percentage ratios within the boxes; these levels may be a guide to fix a target price. However, the problem with the projected boxes is that we won’t know exactly whether such subdivisions are resistances or major supports, i.e., we don’t know how likely it is for the price to reach such levels.

To establish the robustness of the boxes´ subdivisions, i.e., how strong price will be contained, the last range of the box should be subdivided if it is in a bearish trend market to the line ending the box using Fibonacci retracements. And the strategy would be to wait for these areas to respect the market and rebound the price or continue to fall. Using this strategy to draw boxes from the Confluence zone to the limit of the range either higher or lower and replicate this box in the opposite direction, and then subdivide the box into Fibonacci levels does not always ensure that there is a successful trade, so you should use more analytical tools; and the first step is to have the confluence areas analyzed before and from this, project the boxes.

In some cases, the boxes will not share the same edges as the confluence zone due to, for example, gaps between both boxes. To find out which prices are areas of resistance or larger supports, inner boxes of other boxes must be carried out between the current price and the nearest percentage that would be of 38.1% and in this inner box are made the subdivisions with the Fibonacci levels which create areas of confluence that show that zones are supports or greater resistance.

To make this concept clearer, two examples will be presented below. The first example will be NOK/SEK. It is a market with a bearish tendency so you want to find supports that the market could respect and bounce, or find supports to where the market could reach if you continue lowering. At the beginning of the confluence zones were determined and from there, the graph of the upper table was created. This box is then replicated at the bottom of the confluence zone and the Fibonacci levels are determined within this. Having these three boxes you can see the smaller supports that the market has before reaching the minimum price. To find out which of these are areas of larger supports would have to draw another box in the smaller one to have areas of confluence. After having the three boxes drawn, you can see a blue line where a major support is located because it is a zone of confluence and the market should respect these levels of prices.

Foundations of Fibonacci Extensions

The second example is the USD/CHF asset, which is at a similar stage to the first example. The procedure is the same, being the first step to find the confluence zones with the Fibonacci retracements because it gives more strength to the analysis of price projection to be achieved with the boxes.

Fibonacci Extensions

As mentioned in the previous articles, the market gives clues on where to draw the ranges and boxes that at the end show areas of confluence. Care should be taken with graphics that have gaps as this will generate the drawn boxes do not share the same edges.


Introduction to Fibonacci Expansion

Another method used by traders is the Fibonacci expansion and the objective of this tool is to determine the third oscillation. Unlike Fibonacci regressions, this tool uses the market fluctuations instead of the bias for its construction. With the Fibonacci expansion, traders will be able to obtain signals of how the waves evolve, and with the analysis of the waves could be projected where the end of the bias is and the following rebounds that will suffer the price.

The important percentages used by the tool are 0618, 1,382.1, 1.5 and 1,618; These percentages must be expanded along the graph to touch the axis and to verify that they are important areas that the market has respected in the past. Several ranges have created starting from the same starting point to find zones of confluence and thus to see zones that are resistances or supports. It is important to keep in mind that if you are going to trade on long horizons of time, you should observe more data from the past that will allow for a clearer picture.

As in the article “Foundations of Fibonacci Retracements”, with this type of analysis, if you want to find a major support, you must start from a high price and go down in the graph to a low price where there is a market signal that shows significance at this level. To know where the high price should be located, a market correction point should be chosen. After having a certain range for the analysis, a box is drawn from the higher price chosen to where the bias is triggered. Then a second range will be drawn starting from the highest point, which was used for the first box and lowered in the graph to where the Fibonacci ratios seem significant. When both boxes are subdivided into the Fibonacci ratios, there are confluence areas which represent larger supports or resistances, which will be added to the confluence areas analyzed above. The short-term confluence zones will serve in the long term and vice versa, so it`s suggested to observe different horizons of time to appreciate various important levels. Using the Fibonacci expansion as given by the various trading programs and programming correctly, the graph of the market should be seen in the following way where, as with Fibonacci retracements, areas of confluence should be found to know that Fibonacci ratios are higher supports for the market.

Forex Academy: Foundations of Fibonacci Extensions

Elliot Wave Principle

Elliot’s principle is based on the discovery of Ralph Elliot who discovered that the price of the action was not random, on the contrary, it follows a certain logic and order. Elliot saw the same patterns repeating in different cycles, which reflected the prevailing emotions of investors. The movements were called waves. The basic interpretation of Elliot’s principle is that every action has its reaction. When there is a bullet market there are 5 waves moving in the direction of the bias and after this is exhausted there is a three-wave movement. In the next graph, you can see the waves that compose a bull market. The waves numbers 1,3 and 5 are impulse waves and numbers 2 and 4 are correction waves. While the bias exemplified by the letters shows the correction of the whole upward bias.

Elliot Wave Principle

Having explained the principle of Elliot’s wave can be related to the Fibonacci expansion. As mentioned before, the Fibonacci expansion will allow projecting an objective price to where the market price will reach, the Fibonacci projections are calculated after an impulsive phase is produced with its subsequent correction. The projection of 0.618 and 1 is usually used for the waves 5 once the waves 3 and 4 are located, the projection of 1,618 is usually given in the waves 3 once we have located the waves 1 y2. Finally, the projections of 1 and 1,618 usually appear in corrective waves C when the waves A and B are already located.