Introduction
We have completed learning most of the basics related to candlesticks and its patters in the previous lessons. In the upcoming articles, let’s upgrade our technical trading skills by learning Fibonacci Trading. This field of study deals with trading the price charts using Fibonacci levels and ratios. In this article, we will briefly talk about what this Fibonacci trading is all about.
Fibonacci levels and ratios were devised by a famous Italian mathematician, ‘Leonardo Fibonacci.’ This Italian number theorist introduced various mathematical concepts that we use in the modern world, such as square roots, math word problems, and number sequencing.
Leonardo Pisano Fibonacci

Picture Source – Thoughtco
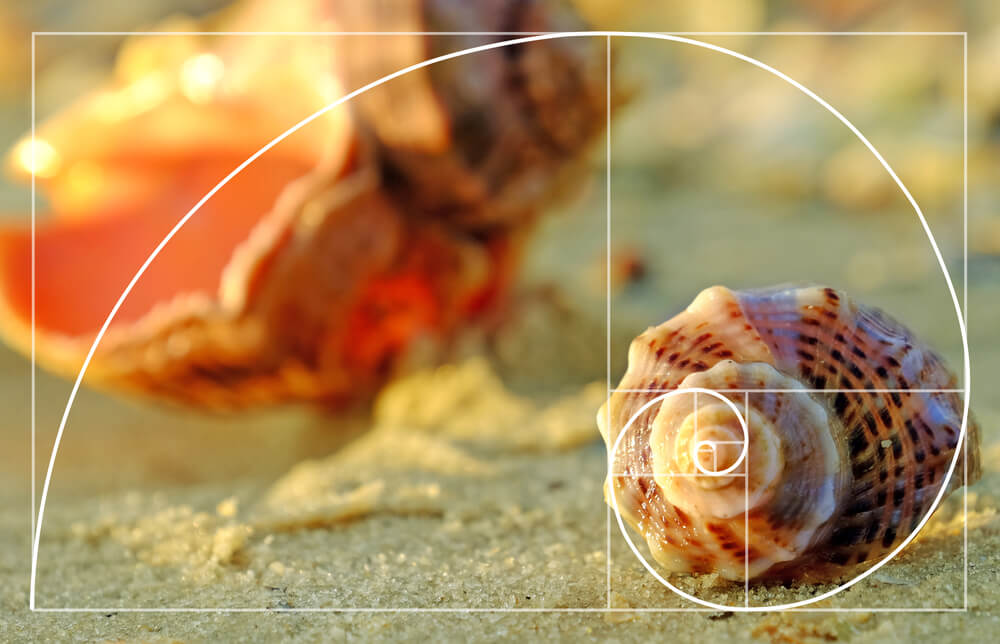
He found out a series of numbers that created ratios. The ratios described the natural proportion of things in the universe. The ratios are derived from the following number series: 0, 1, 1, 2, 3, 5, 8, 13, 21, 34, 55, 89, 144. This number series always starts at 0 and then adding 0+1 to get 1, which is the third number. Then, adding, the second and third numbers to get 2, which is the fourth number and so on.
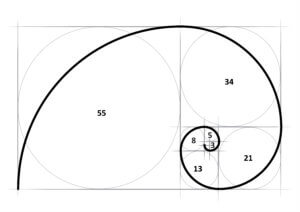
The Fibonacci ratios are generated by dividing a Fibonacci number to its succeeding Fibonacci number. For instance, both 34 & 55 are Fibonacci numbers, and when we divide 34 with 55, we get 0.618, which is a Fibonacci Ratio. We also call them as Fibonacci Retracements. If we calculate the ratios between two alternative numbers, we get Fibonacci Extensions. For example, when we divide 34 by 89, it will be equal to 0.382, which is a Fibonacci Extension. Below, we have mentioned a few Fibonacci Retracement and Extention values for your reference.
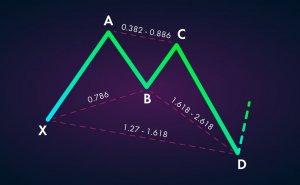
Fibonacci Retracements - 0.236, 0.382, 0.500, 0.618, 0.764 etc.

Fibonacci Extensions - 0, 0.382, 0.618, 1.000, 1.382, 1.618 etc.
Many theories say that once the market makes a big move in one direction, the price will retrace or return partly to the previous Fibonacci retracement levels before resuming in the original direction. Hence traders use Fibonacci retracement points as potential support and resistance levels.
Many traders watch for these levels and place buy and sell orders at these prices to enter or place stops. Traders also use Fibonacci extension levels as profit-taking zones. In order to apply Fibonacci levels on the charts, we need to identify Swing highs and Swing low points, which will be discussed in the upcoming articles.
Fibonacci trading is one of the major branches of Technical Analysis. So it becomes compulsory for every trader to learn what this is all about. In the 21st century, almost all of the brokers provide charting software where we can find Fibonacci tools like indicators and Fibonacci calculators, which makes this aspect of trading very simple and easy. [wp_quiz id=”62566″]