We have discussed three of the most used Harmonic patterns in the previous strategy articles, and they are AB=CD, Butterfly, and Bat patterns. In today’s article, let’s learn how to trade one of the oldest Harmonic patterns – The Gartley. Trading harmonic patterns is one of the most challenging ways to trade but equally rewarding. There are traders across the world who highly believe in these patterns because of their accuracy in identifying trading signals, and the high RRR trades they offer.
The Gartley is one of the most commonly used harmonic patterns as it works very well on all the timeframes. IT is also one such pattern that frequently appears on the price charts. H.M Gartley introduced this pattern in his book ‘Profits in the Stock Market’ in the year 1935.
This pattern is also known as the Gartley 222 pattern because H.M Gartley introduced this pattern in the 222nd page of his book. There are both bearish and bullish Gartley patterns, and they appear depending on the underlying trend of the market. The Gartley pattern is made up of 5 pivot points; let’s see what these points are in the below section.
5 Pivot Points of The Garley Pattern
Just like other harmonic patterns, H.M Gartley used five letters to distinguish the five separate moves and impulses of the Gartley pattern.
The letter X represents the start of the trend.
The letter A represents the end of the trend.
The letter B represents the first pullback of the trend.
The letter C represents the pullback of the pullback.
The letter D represents the target of the letter C.
Gartley Pattern Rules
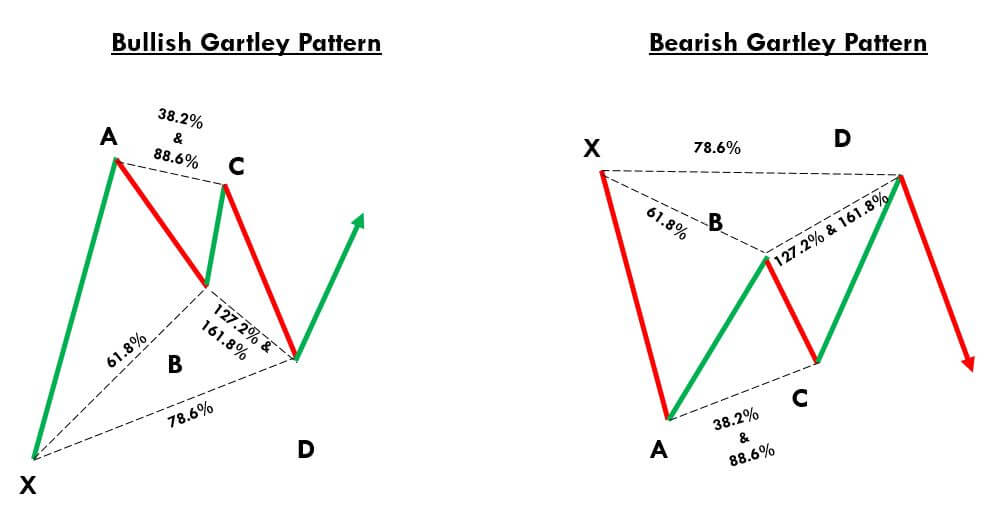
‘X-A’ – This is the very first move of the pattern. The wave XA doesn’t fit any criteria, so it is nothing but a bullish or bearish move in the market.
‘A-B’ – The Second move AB should approximately be at the 61.8% level of the first XA move. So if the XA move is bearish, the AB move should reverse the price action and reach the 61.8% Fib retracement level of the XA.
‘B-C’ – The goal of the BC move is to reverse the AB move. Also, the BC move should end either at 88.6% or 38.2% Fibonacci retracement level of XA.
‘C-D’ – The CD move is the reversal of the BC move. So if the BC move is 38.2% of the AB, CD move should respond at 127.2% level of BC. If BC move is at the 88.6% level of the AB move, the CD move should be at the 161.8% Fib extension level of BC.
‘A-D’ – This is the last but most crucial move of the Gartley pattern. Once the CD move is over, the next step is to measure the AD move. The Last AD move will show us the validity of the Gartley Pattern on the price chart. The pattern is said to be valid if this move takes a retracement approximately at the 78.6% Fib level of the XA move.
Below is the pictographic representation of the Gartley Pattern
Gartley Pattern Trading Strategy
Trading The Bullish Gartley Pattern
In the below NZD/USD weekly chart, we can see that the market is in a clear uptrend. We have then found the swing high and swing low, which is marked by the point X & Point A. We then have four swing-high & swing-low points on the price chart that binds together to form the Gartley harmonic pattern.
Always remember that every swing high and low must validate the Fibs ratios of the Gartley pattern. These levels can be approximate as we can never trade the market if we keep waiting for the perfect set-up. There are indicators out there where the Fibonacci levels are present in them by default. We generally use TradingView, and in this charting software, the below-used indicator can be found in the toolbox, which is present on the left-hand side.
Please refer to the marked region in the chart below. The first XA leg is formed just like a random bullish move in the market. The second AB move is a bearish retracement, and it is at the 61.8% Fib level of the XA move. Furthermore, the BC is a bullish move again, and it follows the 88.6% Fib level of the AB move. The CD leg is the last bearish move, and it is respecting the 161.8% Fib level of BC.
Now we have identified the bullish Gartley pattern on the price chart. We can take our long positions as soon as the CD move ends at the 161.8% level. The next and most crucial step of our strategy is to find the potential placement of our stop-loss. The ideal region to place the stop-loss is just below point X. If the price action breaks the point X, it automatically invalidates the Gartley pattern.
However, stop-loss placement depends on what kind of trader you are. Some aggressive traders place stop-losses just below the entry while some use wider stops. We suggest you follow the rules of the strategy and use point X as an ideal stop-loss placement.
B, C & A points can be considered as ideal areas for taking your profits. We suggest you go for higher targets in the case of the formation of a perfect Gartley pattern. Overall, placing a ‘take-profit‘ order depends on your previous trading experience also. Because, if you come across any ideal candlestick patterns in your favor while your trade is performing, you can extend your profits. We can also combine this pattern with other reliable technical indicators to load more positions in our trades.
Trading The Bearish Gartley Pattern
Below is the EUR/GBP four-hour chart in which we have identified the bearish Gartley pattern. In the highlighted region, we can see the formation of the bearish XA leg like a random bearish move. The second leg is AB – a bullish retracement stopping at the 61.8% level of the XA move. Furthermore, the BC move is bearish again, and it respects the 88.6% Fibs level of the AB move. CD is the final bullish move, and it is respecting the 161.8% Fibs level of BC.
As soon as the price action completes the CD move, we can be assured that the Gartley pattern is formed on our price chart. We can also see the formation of a Red confirmation candle indicating us to go short in this Forex pair. We have taken our short positions at point D and placed our stop-loss just above point X.
We have three targets in total, and they are points B, C, and A. Within a few hours, the price action hits the B point, which was our first target. Moreover, the price pulled back at point C, but we were safe in our trade as our stop-loss was placed above point X. Our final target was at point A, which is achieved within four days.
Conclusion
The Gartley pattern is wholly based on mathematical formulas and Fibonacci ratios. Remember to take the trades only when all the mentioned Fib levels are respected. If you have no experience with harmonic patterns, you must master this pattern on a demo account first and then use them on the live markets. We are saying this because it requires a lot of patience and practice to identify and trade these patterns.
We hope you understood how to identify and trade the Gartley Harmonic Pattern. If you have any questions, let us know in the comments below. Cheers!
We have discussed the many applications of the Fibonacci levels in our previous course lessons. Now its time to explore the scope of these levels in the most integral part of trading, which is money management. We are all familiar with the ‘take-profit’ order and also know how crucial it is to determine the same before entering a trade.
There are numerous ways to determine the ‘take-profit‘ levels to maximize our profits, but the Fibonacci levels are said to be extremely accurate. In this article, we will validate the accuracy of the Fibonacci indicator in determining the ‘take-profit’ levels.
Placing Accurate Take-Profit Order Using Fib Levels
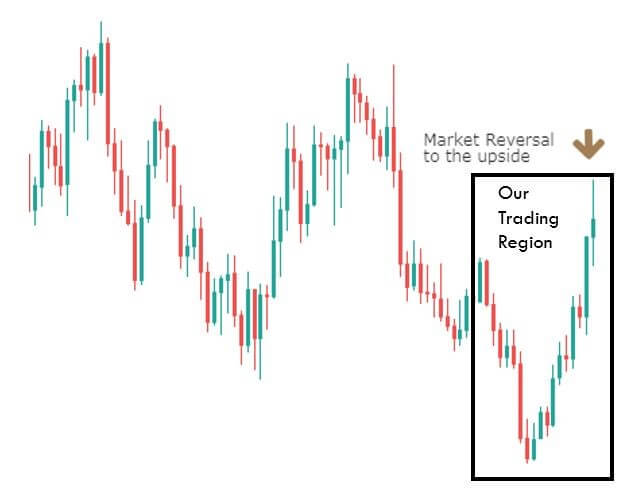
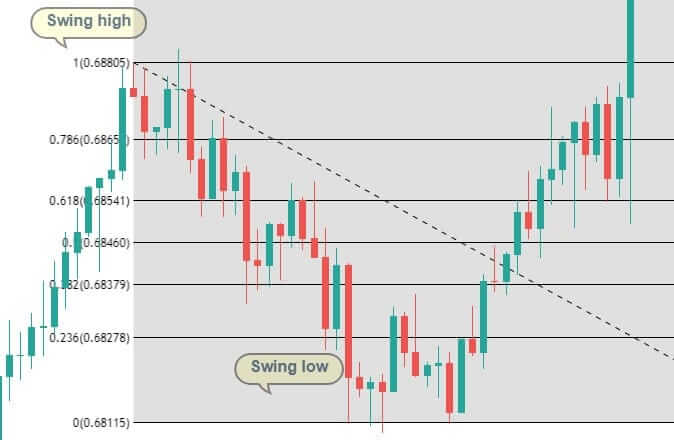
To find a trade, we need first to establish a significant trend. The primary trend could either be a continuation of a previous trend or beginning of a new trend after a market reversal. In the below chart, we can observe the market reversal to the upside. We must wait for its retracement; if the retracement follows all the rules of our Fibonacci strategy (discussed in the Fibonacci article), we can proceed to take the trade.
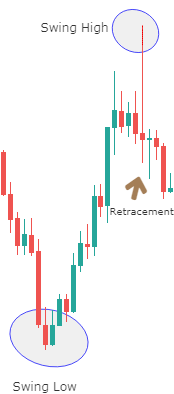
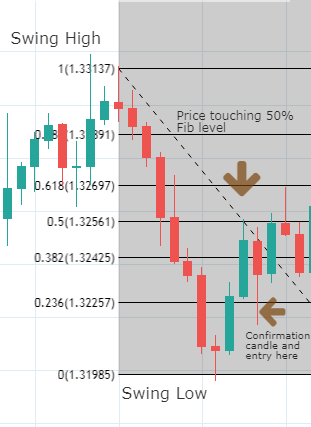
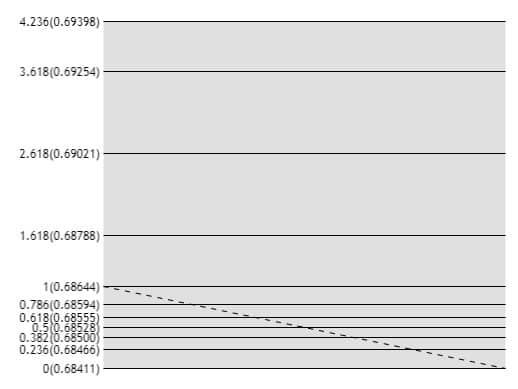
In the below image, we can notice a pullback coming in from the swing high. We will be evaluating this swing high using the Fibonacci levels. The Fibonacci levels used in this particular strategy for determining the accurate ‘take-profit’ placement are different from the usual Fibonacci levels we used in all the previous articles.
We are going to use ‘Fibonacci Extensions’ instead of retracements here. These extensions can be plotted on to the charts by using an indicator that can be found in most of the trading platforms. We use the Tradingview platform for our charting purpose, and this indicator can be found on the drawing panel of TradingView. It is available in the sub-menu of the Fibonacci tool folder and named as ‘Trend-Based Fib Extension.
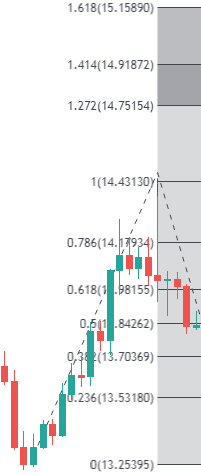
To plot Fibonacci extension on the chart, first, click on a significant low, then drag the cursor and click on the recent high. Finally, drag the cursor back to the swing low. We can also highlight the Fib ratios by clicking on the retracement levels. Don’t forget to include the Fib ratios on the chart that are above 100%, as our take-profit methodology is based on those ratios.
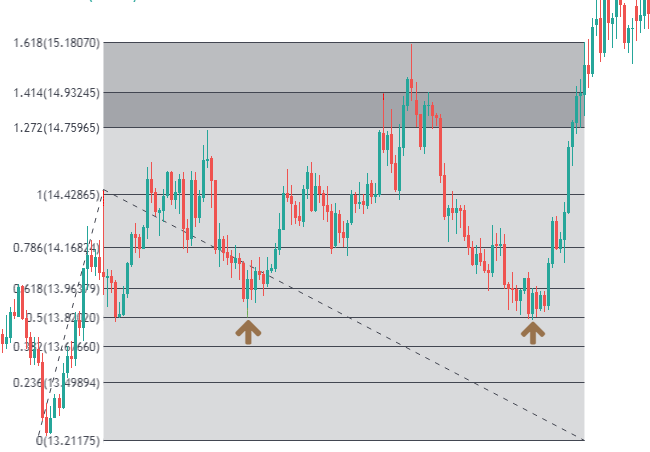
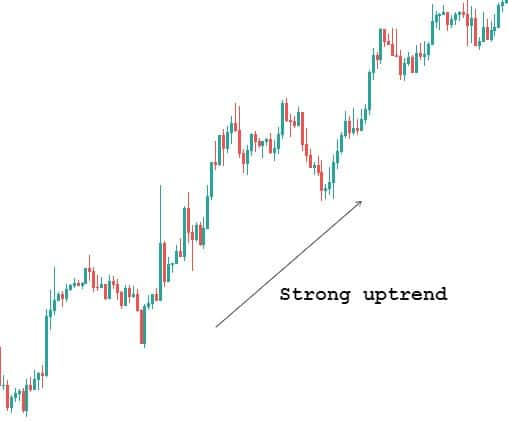
The below chart shows how the Fibonacci Extensions are plotted on the chart using the swing low and swing high. We also see from the chart that the retracement is exactly reacting from the 50% Fib levels, which could a sign of trend continuation. But to be sure, it is prominent to have a confirmation candle at this place.
We get a bullish confirmation candle in the direction of the dominant trend, after which a potential trade entry can be made to the ‘buy’ side.
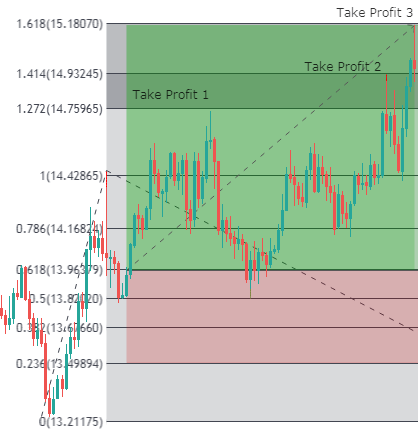
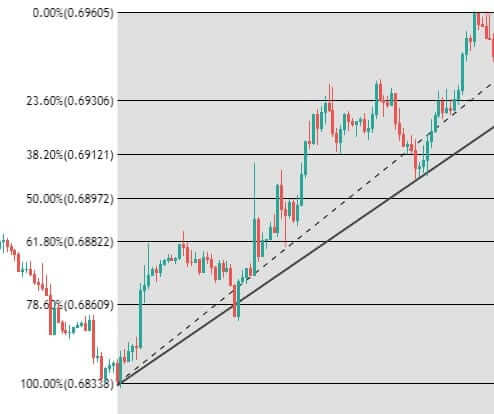
Right after entry, it is essential to determine our take-profit and stop-loss areas. Here is the part where we will be using our Fibonacci Extensions. The strategy is to take some profits at 127%, and then at 141% and remaining profits at 161%.
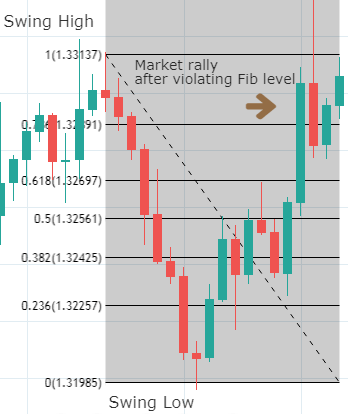
The take-profit points are clearly shown in the below chart. One can see that the market falls exactly after touching the respective Fib extension levels. By following this method, one can maximize their gains by taking profits at every subsequent point. The risk to reward ratio in this trade is also outstanding.
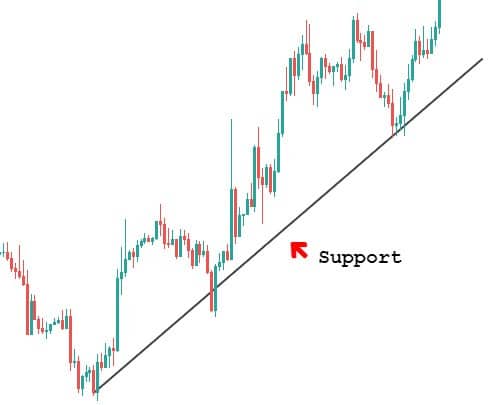
The below chart shows that the market continues to take support at the 50% fib level and eventually breaks out above our final take-profit order. The trend has completely reversed from a downtrend to an uptrend.
Conclusion
The Fibonacci tool can be used to find potential exit points in a trade with a great degree of accuracy. Hence, rather than taking a simple approach to determining the target points of the trade, we must make use of Fibonacci Extention levels to maximize our grains. Please remember that these extensions are not guaranteed levels too. So it is important not to depend upon them completely. Cheers!
In the previous article, we learnt how exactly to trade using the Fibonacci levels. There are many other ways through which Fib levels can be traded. Some of them include trading these levels using S&R, Trendlines, and even candlestick patterns. Before learning all of these ways, we must know that these levels are not guaranteed and cannot be traded stand-alone. So in this article, let’s discuss why one should be very careful while trading Fibonacci retracements.
Fibonacci Levels Will Not Be Respected Always
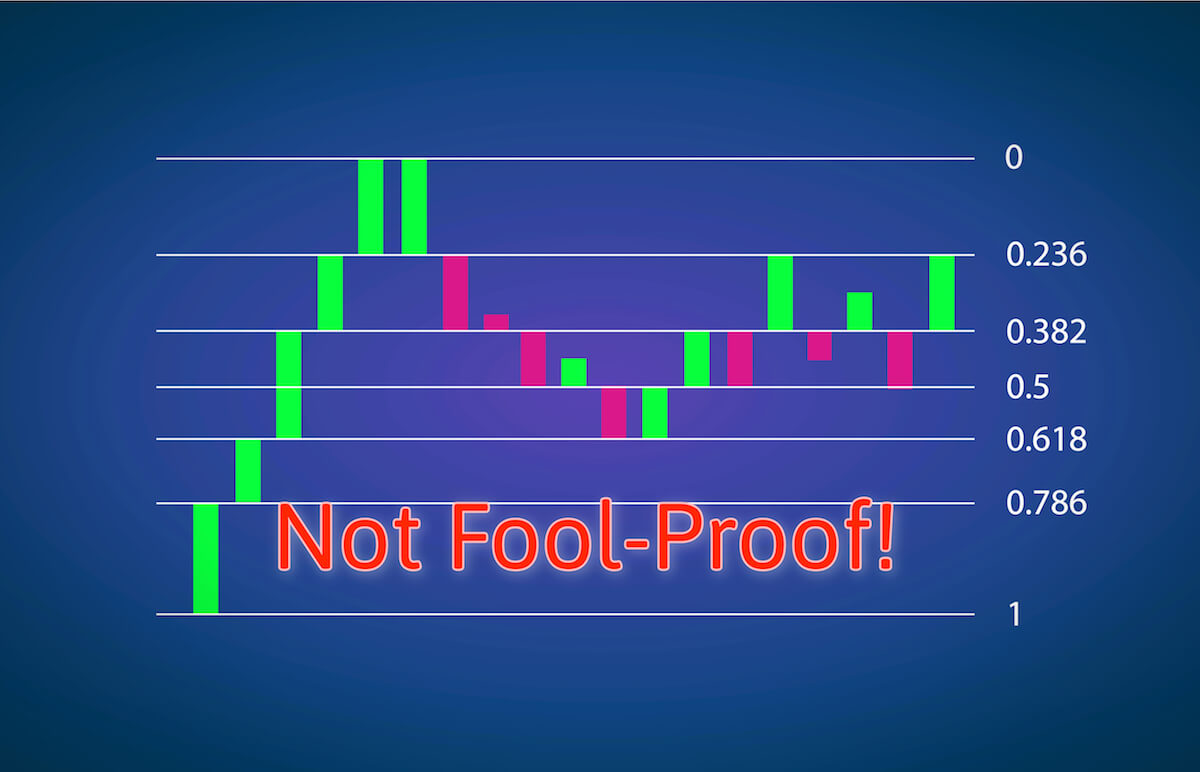
Every technical level ultimately breaks at a certain point in time, and that is the case with Fibonacci levels as well. In the previous article, we had learnt that Fibonacci levels also act as potential support and resistance areas. So these levels do break just as how S&R levels break. Therefore we must keep in mind that these levels are not foolproof.
Let’s understand this with the help of an example. But before that, make sure to read our article on ‘How to trade Fib retracements’ to understand this better. You can find that lesson here.
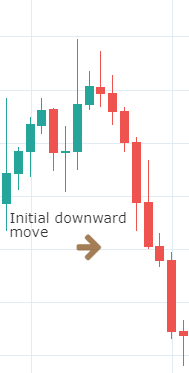
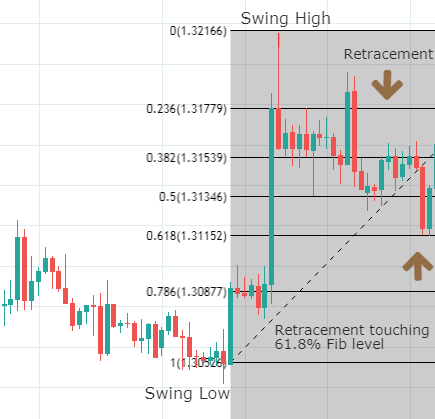
In the price chart below, we can see an initial big move to the downside. So basically, here we must wait for the retracement, and that retracement must touch the Fibo levels. Let’s see what happens in the next step.
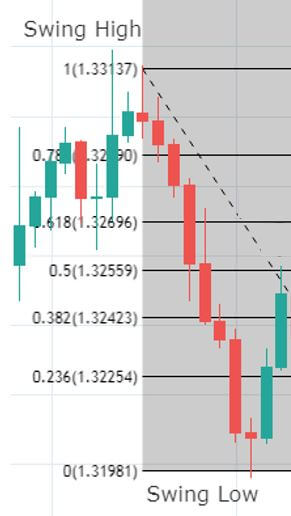
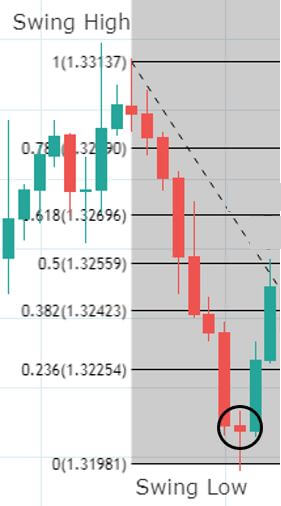
We saw the retracement (below chart) of the downward move, and we have placed the Fib levels from swing high to swing low since it is a downtrend.
Then we can see the retracement reaching the 50% Fib level and holding there. Ideally, at this point, the retracement must stop, and the market’s original downtrend should continue. Also, we should be placing our ‘sell’ trades as the Red confirmation candle can clearly be seen.
But, to our surprise, we observe that the price did not respect our strategy, and the market shot up to the north, violating all the Fibonacci levels, as shown in the below chart.
While Fibonacci retracement levels give us a high probability of the trade working in our favor, like any other technical analysis tool, they don’t always work. One can never be entirely certain that the price will respect the 50% or 38.2% or any Fibonacci level for that matter.
If you are an experienced technical trader, you wouldn’t have placed a sell trade in the above scenario. It was clear that the sellers are losing momentum. The formation of a bearish Doji candle at the bottom (below chart) is another confirmation of a trend reversal.
So we should be looking at the bigger picture, or we should take the help of any other technical tools to confirm the signals generated by the Fibonacci levels. Never completely depend on them.
Conclusion
Apart from the things that we discussed above, there is another issue while using these Fib ratios, which is determining the appropriate swing low and swing high. Everyone looks at charts differently. They trade at different time frames and have their own fundamental reason for buying or selling the currency pair.
Swing high for one trader might likely be different than swing high for another. And when the Fib ratios are placed incorrectly, of course, the trading signals generated won’t be accurate. Also, the prerequisite for Fibonacci trading is trending markets. When the market is in a consolidation or moving sideways, it is obviously not possible to trade with these ratios.
We hope you understood this lesson well. If you find this complicated or if you have any questions, please let us know in the comments below. Cheers.
In the previous article, we understood the definition of Fibonacci and how the Fibonacci levels are derived. Now we shall see how to use these levels to enter a trade and formulate a trading strategy around it.
The strategy we are going to discuss can be used not just in the Forex market. It can also be used in different other markets such as Stocks, Commodities, Cryptocurrencies, and ETFs. This is essentially a trend trading strategy that takes advantage of a pullback in a trend. The Fibonacci levels later prove to be critical areas of support and resistance that most traders keep a close watch on. Let’s get started with the strategy.
Step 1: Identify an initial big move. We are going to trade its retracement.
A trend helps the traders to identify the direction of the market and to determine where the market will head further. A big price movement indicates that the market has reversed from its original direction and will possibly continue further in that direction.
In this example, we have identified a big move on the upside, and we shall see how to trade its retracement to join the trend. Let’s use Fibonacci levels to enter the trend at the right time.
Step 2: Use the Fibonacci tool and plot the levels on the chart
After placing Fibonacci levels on the chart, we need to wait for a retracement and see where it touches the Fib levels. The most desirable condition is when the price bounces off after touching the 50% or 61.8% fib ratio. These ratios are also known as Golden Fib ratios. In the below chart, we can see the formation of a bullish candle as soon as the Red candle reaching the 61.8% level.
In an uptrend, always make sure to plot the Fib levels from Swing Low to Swing High. Likewise, in a downtrend plot, the Fib levels on the chart from Swing High to Swing Low.
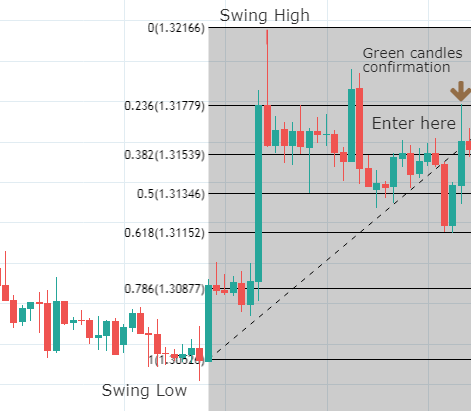
Step 3: Enter only after confirmation
Typically, traders are taught to place their buy orders as soon as the price reaches the 61.8% level. Do not do that. Only place the trades after the appearance of at least a couple of bullish candles. In the below chart, the formation of a green candle at 61.8% gives us an additional confirmation that the trend is going to continue after the retracement. Traders can also confirm this buy signal by using reliable technical indicators. This is how the chart would look at the time of entering the trade.
It is important to place accurate Stop-Loss and Take-Profit orders to mitigate the risk and maximize profits. In this strategy, stop-loss is placed just below the 61.8% Fib level. If the price breaks this Fib level, the uptrend gets invalidated, and we can expect the beginning of a downtrend.
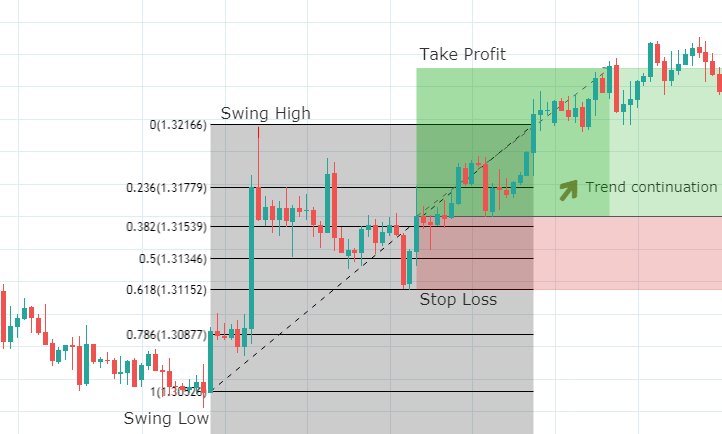
We can place the take-profit order at the nearest’ high’ of the uptrend and trail the stop-loss until it is triggered. The minimum risk to reward of this trade is 1:1, which is not bad. But since it is a continuation of the trend, we can wait until it makes a new high and take profits there. This will result in a 1:2 risk to reward trade.
Below is how the setup of the final trade looks like.
We can clearly see the price respecting the Fibonacci levels, and the trade here went exactly the way we predicted.
Conclusion
Fibonacci retracements are a part of the trend trading strategy that most traders observe during an uptrend. Traders try to make low-risk entries in the direction of the trend using these Fibonacci levels. It is believed that the price is highly likely to bounce from the Fibonacci levels back in the direction of the initial trend. These Fib levels can also be used on multiple time frames. When this tool is combined with other technical indicators, we can predict the outcome of the trade with a greater degree of accuracy.
We have completed learning most of the basics related to candlesticks and its patters in the previous lessons. In the upcoming articles, let’s upgrade our technical trading skills by learning Fibonacci Trading. This field of study deals with trading the price charts using Fibonacci levels and ratios. In this article, we will briefly talk about what this Fibonacci trading is all about.
Fibonacci levels and ratios were devised by a famous Italian mathematician, ‘Leonardo Fibonacci.’ This Italian number theorist introduced various mathematical concepts that we use in the modern world, such as square roots, math word problems, and number sequencing.
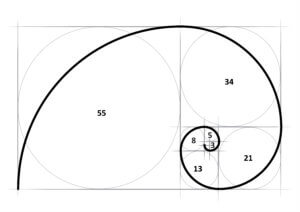
He found out a series of numbers that created ratios. The ratios described the natural proportion of things in the universe. The ratios are derived from the following number series: 0, 1, 1, 2, 3, 5, 8, 13, 21, 34, 55, 89, 144. This number series always starts at 0 and then adding 0+1 to get 1, which is the third number. Then, adding, the second and third numbers to get 2, which is the fourth number and so on.
The Fibonacci ratios are generated by dividing a Fibonacci number to its succeeding Fibonacci number. For instance, both 34 & 55 are Fibonacci numbers, and when we divide 34 with 55, we get 0.618, which is a Fibonacci Ratio. We also call them as Fibonacci Retracements. If we calculate the ratios between two alternative numbers, we get Fibonacci Extensions. For example, when we divide 34 by 89, it will be equal to 0.382, which is a Fibonacci Extension. Below, we have mentioned a few Fibonacci Retracement and Extention values for your reference.
Fibonacci Retracements - 0.236, 0.382, 0.500, 0.618, 0.764 etc.

Fibonacci Extensions - 0, 0.382, 0.618, 1.000, 1.382, 1.618 etc.
Many theories say that once the market makes a big move in one direction, the price will retrace or return partly to the previous Fibonacci retracement levels before resuming in the original direction. Hence traders use Fibonacci retracement points as potential support and resistance levels.
Many traders watch for these levels and place buy and sell orders at these prices to enter or place stops. Traders also use Fibonacci extension levels as profit-taking zones. In order to apply Fibonacci levels on the charts, we need to identify Swing highs and Swing low points, which will be discussed in the upcoming articles.
Fibonacci trading is one of the major branches of Technical Analysis. So it becomes compulsory for every trader to learn what this is all about. In the 21st century, almost all of the brokers provide charting software where we can find Fibonacci tools like indicators and Fibonacci calculators, which makes this aspect of trading very simple and easy.
H.M Gartley published a book known as ‘Profits in the Stock Market’ in 1932. In this book, Gartley shared the entire group of harmonic patterns that are widely being used by traders across the world. AB=CD is one such pattern from the harmonic group. As time has passed, professional traders and market technicians improved this pattern a lot. They have also incorporated the Fibonacci ratios to this pattern, which will be discussed in this article.
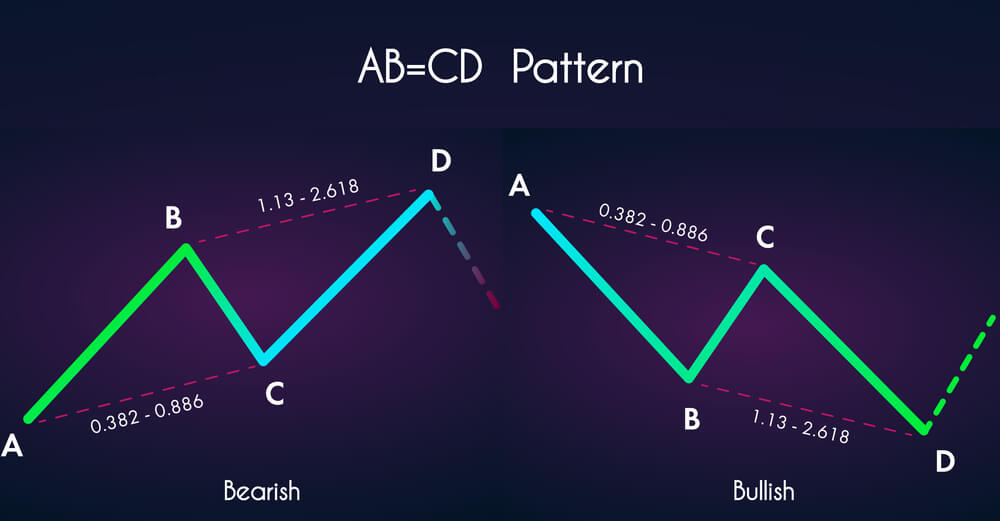
AB=CD is a reversal pattern that helps traders in predicting when the price action of an underlying asset is about to reverse. It is a visual geometric pattern comprised of three consecutive price swings. This pattern helps to identify the trading opportunities in all types of markets, on any timeframe, and in any kind of market condition. Bullish AB=CD pattern helps traders in identifying higher probability buy trades, whereas bearish AB=CD patterns help in determining selling opportunities.
This pattern includes a total of four letters – A, B, C, D. Each turning point represents a significant high or low on the chart. These turning points are referred to as AB move, BC move, and the CD move. Let’s see how traders must perceive this pattern in the upcoming sections.
AB=CD Pattern Rules
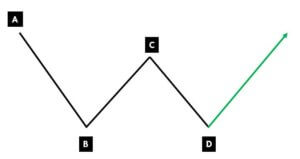
Bullish AB=CD Pattern
The bullish AB=CD pattern always appears in a downtrend.
First of all, point A to B will be any random downtrend move.
Then the price action must go into the counter side of the AB move, printing the B to C move.
The original selling trend should resume and print the CD leg resembling the AB leg.
Once all these three moves are completed, we can conclude that the market has printed the bullish AB=CD pattern
Activate the buy trades only at point D.
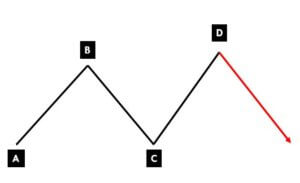
Bearish AB=CD Pattern
Bearish AB=CD pattern is nothing but a mirror image of the Bullish AB=CD pattern.
The pattern begins with a bullish line from point A to B.
These points could be any random move in an uptrend.
B to C move should reverse the trend of the market but shouldn’t cross point A.
C to D move should be equal in size to point A and B.
Once all these moves are completed, we can conclude that the market has printed the bearish AB=CD pattern
Start taking sell trades only from point D.
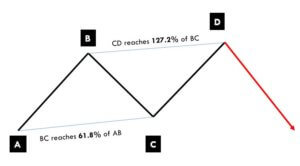
AB=CD Pattern – Fibonacci Ratios
As already mentioned, Fibonacci ratios can be used to confirm the validity of the AB=CD patter. Below are the fib levels that are incorporated in the AB=CD pattern by trading experts for pattern validation.
BC leg is the 61.8% Fib retracement of AB leg.

CD leg is the 127.2% Fib retracement of BC leg.
Only at these retracement levels, the length of AB will be equal to the length of the CD.
Only take the trades if these above Fibonacci levels are matching with the setup on your charts. Ignore the setup if the Fib levels aren’t matching.
As you can see in the above image, the BC move retraces 61.8 of the AB and CD move is the 127.2% extension of the BC move. Also, the length of the AB move is equal to the extent of CD, i.e., both the movements must take the same time to develop on the charts. If any underlying currency pair is confirming all the mentioned rules, only then we can safely anticipate a higher probability trade.
AB= CD Pattern Trading Strategy
We believe by now, you understood the formation of the AB=CD pattern very well. Now let’s combine this pattern with the Fibs ratio as discussed to learn how to trade this pattern in the right way. As soon as we identify this pattern on the price chart, the only problem most of the traders have is while determining the accurate Fib ratios. Novice or intermediate traders go wrong most of the time in this aspect. As a result, they lose their trade. So make sure always to set the accurate fibs ratio and only then trade the AB=CD setup.
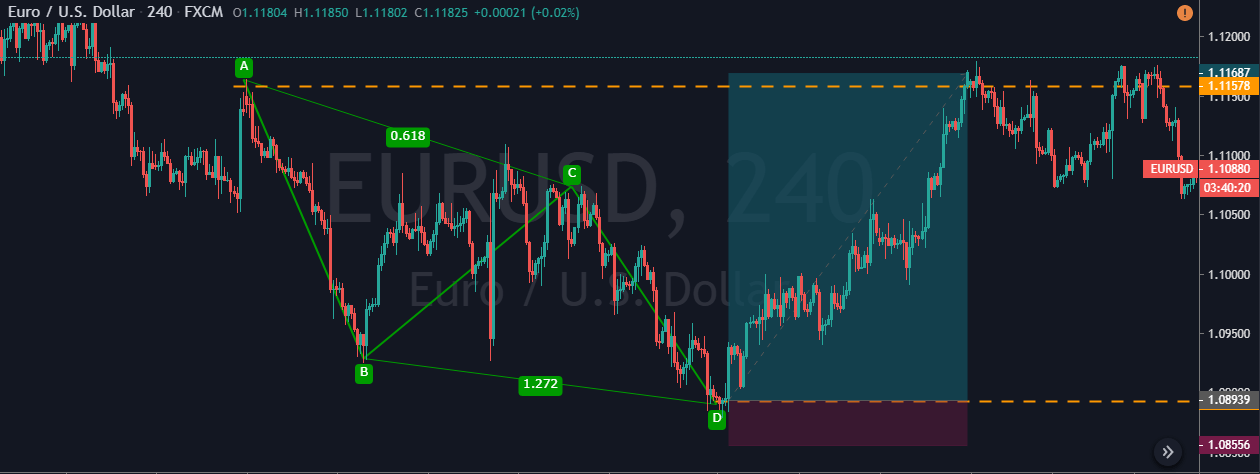
Bullish AB=CD Pattern
In the below EUR/USD 240 minutes chart, we can see that the pair was in an overall downtrend. We can also see that the CD move is equal in size to AB move. Also, after applying Fib ratios, we now know that the BC is 61.8% retracement of the AB move, and CD is the 127% extension of the BC. Therefore we can confirm the validity of the Bullish AB=CD pattern.
Entry, Stop-loss & Take Profit
Execute a buying trade at point D. Furthermore, always place the stops just below the D point. This is because, if price action goes beyond this point, it invalidates the pattern. This pattern provides two ‘take profit’ targets. The first one is point C, and the other is point A. We have closed our full position at point A because after activating our trade, the price action immediately blasted to the north. This indicates that we can expect more extended targets in this pair.
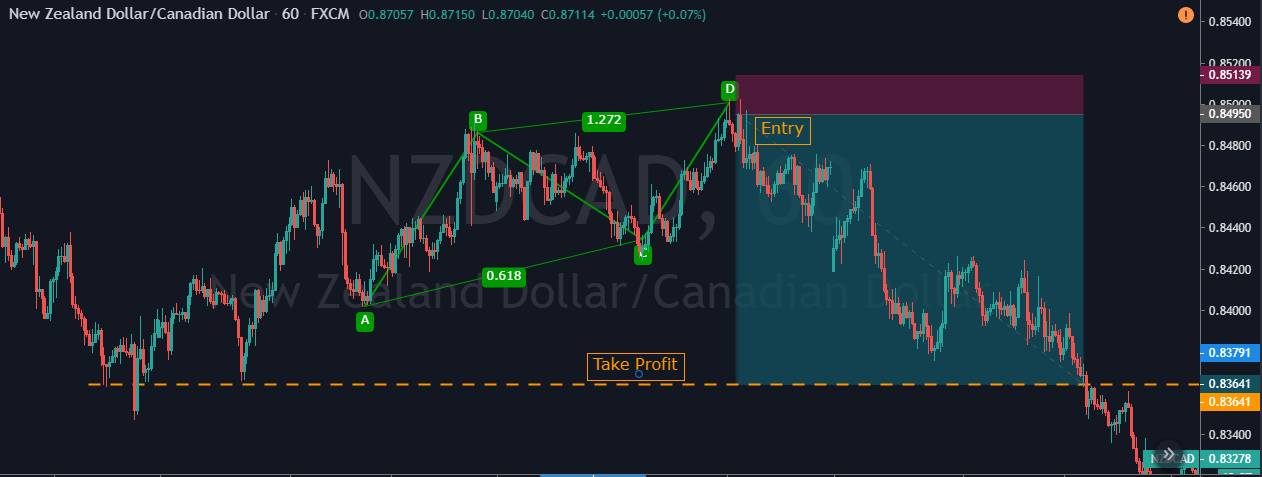
Bearish AB=CD Pattern
In the below 60 minute chart of the NZD/CAD Forex pair, the market was in an uptrend. This means that if at all, we are expecting an AB=CD pattern, it will be bearish. Notice that the AB is completely equal in size to the CD move. Following the rules of the pattern is critical while trading the AB=CD pattern. After applying Fibs, we can see that the BC is 61.8% retracement of the AB move, and the CD move was also a 127% extension of the BC move on the price chart. This confirms the authenticity of the bearish AB=CD pattern. We have executed a sell trade at point D. Although it was not a smooth ride, we have closed our full position at the major support area.
Bottom Line
AB=CD is one of the most popular trading patterns in the market. It is straightforward to identify, confirm, and trade as well. Also, we get to see this pattern frequently in the market, and traders can pair it with other forms of technical analysis to improve the odds of their trades. Always remember to follow the rules of the game; else, it is very difficult to win the game of trading. We hope you find this strategy useful. Try applying this strategy on a demo account and then apply it on the live charts. If you have enough questions, let us know in the comments below. Cheers!
Introduction
The Fibonacci tool was developed by Leonardo Pisano, who was born in 1175 AD in Italy. Pisano was one of the greatest mathematicians of the middle ages. He brought
Introduction
The Fibonacci tool was developed by Leonardo Pisano, who was born in 1175 AD in Italy. Pisano was one of the greatest mathematicians of the middle ages. He brought
Introduction
The Fibonacci tool was developed by Leonardo Pisano, who was born in 1175 AD in Italy. Pisano was one of the greatest mathematicians of the middle ages. He brought the current decimal system to the western world ( learned from Arab merchants on his trips to African lands). Before that, mathematicians were struggling with the awkward roman numerical system. That advancement was the basis for modern mathematics and calculus.
He also developed a series of numbers using which he created Fibonacci ratios describing the proportions. Traders have been using these ratios for many years, and market participants are still using it in their daily trading activities.
In today’s article, we will be sharing a simple Fibonacci Retracement Trading Strategy that uses Fibonacci extensions along with trend lines to find accurate trades. There are multiple ways of using the Fibonacci tool, but one of the best ways to trade with Fibonacci is by using trend lines.
With this Fibonacci trading strategy, a trader will find everything they need to know about the Fibonacci retracement tool. This tool can also be combined with other technical indicators to give confirmation signals for entries and exits. It also finds its use in different trading strategies.
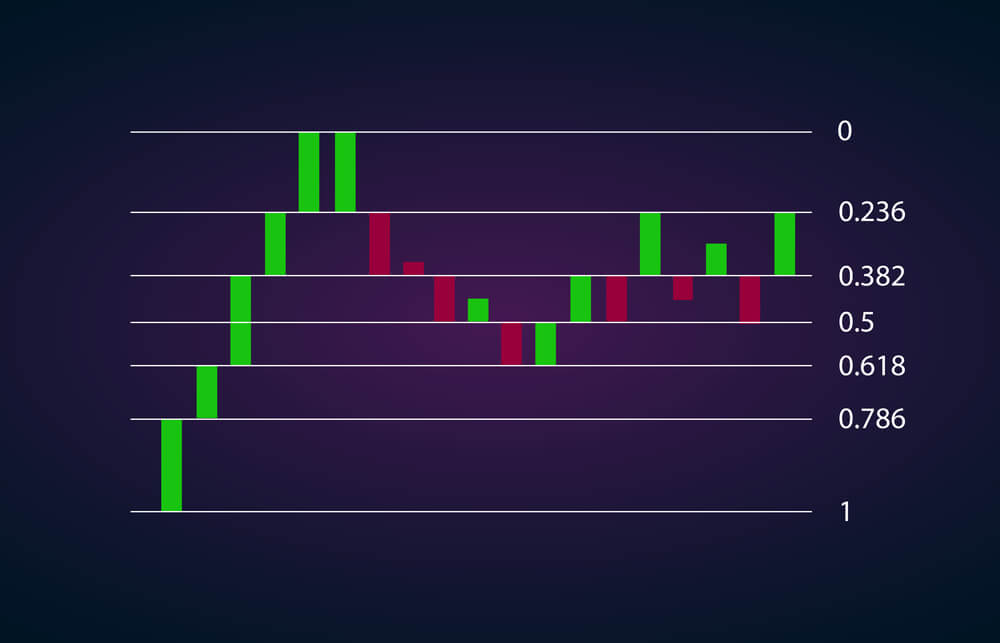
Below is a picture of the different ratios that Leonardo created. We will get into details of these lines as we start explaining the strategy.
Strategy Prerequisites
Most of the charting software usually comes with these ratios, but a trader needs to know how to plot them on the chart. Many traders use this tool irrespective of the trading strategy, as they feel it is a powerful tool. The first thing we need to know is where to apply these fibs. They are placed on the swing high/swing low.
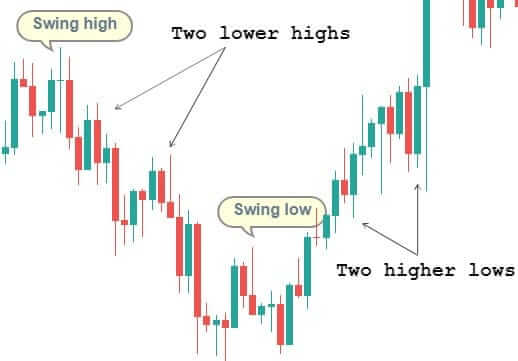
A swing high is a point where there are at least two lower highs to its right
A swing low is a point where there are at least two higher lows to its right
If you are uncertain of what the above definitions meant, have a look at the below chart.
Here’s how it would look after plotting Fibonacci retracement on the chart.
In an uptrend, it is drawn by dragging the Fibonacci level from the swing high all the way to swing low. In case of a downtrend, start with the swing high and drag the cursor down to the swing low. Let’s go ahead and find out how this strategy works.
The Strategy
This strategy can be used in any market, like stocks, options, futures, and of course, Forex as well. It works on all the time frames, as well. Since the Fibonacci tool is trend-following, we will be taking advantage of the retracements in the trend and profit from it. Traders look at Fibonacci levels as areas of support and resistance, which is why these levels could be a difference-maker to a trader’s success.
Below are the detailed steps involved in trading with this strategy
Step 1 – Find the long term (4H or daily time frame) trend of a currency pair
This is a very simple step but crucial, as well. Because we need to make sure if the market is either in an uptrend or a downtrend. For explanation purposes, we will be examining an uptrend. We will be looking for a retracement in the trend and take an entry based on our rules.
Step 2 – Draw a line connecting the higher lows. This line becomes our trendline.
The trend line acts as support and resistance levels for us. In this example, we will be using it as support.
Step 3 – Draw the Fibonacci from Swing low to Swing high
Use the Fibonacci retracement tool of your trading software and place it on swing low. Extend this line up to the swing high. Since it is an uptrend, we started with a 100% level at the swing low and ended with 0% at the swing high.
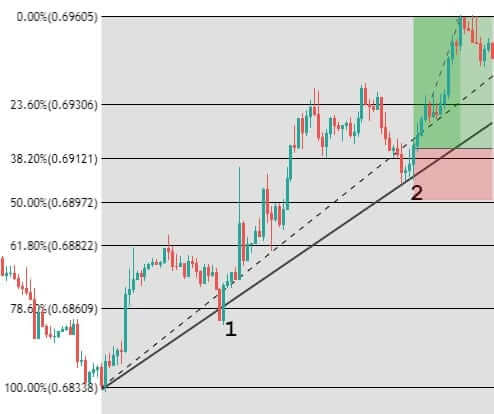
Step 4 – Wait for the price to hit the trend line between 38.2% and 61.8% Fibonacci levels.
In the below-given figure, we can see that the price is touching the trend line at two points (1 and 2). There is a significant difference between the two points. At point 1, the price touches the trend line between 78.6% and 100%, whereas, at point 2, the price touches the trend line between 38.2% and 61.8%.
The region between 38.2% and 61.8% is known as the Fibonacci Golden Ratio, which is critical to us. A trader should be buying only when the price retraces to the golden ratio, retracements to other levels should not be considered. Therefore, point 2 is where we will be looking for buying opportunities.
Step 5 – Entry and Stop-loss
Enter the market after price closes either above the 38.2% or 50% level. We need to wait until this happens, as the price may not move back up. However, it should not take long as the trend should continue upwards after hitting the support line.
For placing the stop loss, look at previous support or resistance from where the price broke out and put it below that. In this example, stop loss can be placed 50% and 61.8% Fibonacci level because if it breaks the 50% level, the uptrend would have become invalidated. The trade would look something like this.
Final words
The Fibonacci retracement tool is a prevalent tool used by many technical traders. It determines the support and resistance levels using a simple mathematical formula. Do not always rely only on Fibonacci ratios, as no indicator works perfectly alone. Use additional tools like technical analysis or other credible indicators to confirm the authenticity and accuracy of the generated trading signals. One more important point that shouldn’t be forgotten is not to use Fibonacci on very short-term charts as the market is volatile. Applying Fibonacci on longer time frames yield better results.
We hope you find this strategy informative. Try this strategy in daily trading activities and let us know if they helped you to trade better. Cheers!
Leonardo da Pisa developed the Fibonacci sequence in the thirteen century. The series starts like this: 1-1-2-3-5-8, and so on. Elliott, in his work “Nature’s Law,” said Fibonacci provides
Leonardo da Pisa developed the Fibonacci sequence in the thirteen century. The series starts like this: 1-1-2-3-5-8, and so on. Elliott, in his work “Nature’s Law,” said Fibonacci provides
Leonardo da Pisa developed the Fibonacci sequence in the thirteen century. The series starts like this: 1-1-2-3-5-8, and so on. Elliott, in his work “Nature’s Law,” said Fibonacci provides the mathematical basis of the Wave Principle. In this educational article, we will review how to apply the Fibonacci sequence to the Elliott Wave Theory.
The Fibonacci ratios
The Fibonacci sequence has its origin in Leonardo da Pisa’s work, “Liber Abacci.” In his work, the mathematician responses to the question:
How many pairs of rabbits placed in an enclosed area can be produced in a single year from one pair of rabbits if each pair gives birth to a new pair each month starting with the second month?
The answer to this question resulted in the series calculated as follows: The first month, there will be zero plus one that results in one pair. The next month, the rabbits will reproduce, expanding to two pairs. In short, the sequence of rabbits is as follows, 0, 1, 1, 2, 3, 5. The series concludes that at the end of the year, there will be 144 pairs of rabbits.
From the Fibonacci series, we obtain the main ratios of this sequence; these are 0.618 and 1.618; this number is known as the Golden Ratio.
In the Elliott Wave Analysis, we use some specific level to evaluate the retrace and potential next movement of the market; these levels are as follows:
Retracement:
0.09
0.146
0.236
0.382
0.5
0.618
0.764, some authors prefer to use the 0.786 level.
0.854, some authors prefer to use the 0.886 level.
Expansion:
0.618
1
1.272
1.414
1.618
2
2.272
2.618
Use of Fibonacci tools in the financial markets
Until now, we used neither a mathematical method to determine price targets. Consider that the price action is not compelled to respect a Fibonacci level by itself. These tools provide a probability zone to a reaction.
The following chart corresponds to AT&T (NYSE:T) in its daily timeframe. The bullish cycle started on August 24, 2019, when T found buyers at $30.97 per share.
The first Elliott wave movement calls for a leading diagonal structure, which made the wave 1 of Intermediate degree. Using the Fibonacci retracement tool, we observe that wave (2) retraces near to 38.2% o wave (1).
The wave (3) accomplishes the rule that commands “wave 3 is the largest wave.” In wave (4), we observe that respect the alternation rule that says, “if wave two is simple, wave four will be complex, and vice-versa.” This wave retraces between 23.6% and 38.2% of wave (3).
Finally, from wave (5), the price action drove to strike over the upper-line of the ascending channel.
Hello, and welcome to this latest edition of courses on demand brought to you by Forex dot Academy. In this course, we will be
[embed]https://youtu.be/11pW-JTdYHQ[/embed]
Hello, and welcome to this latest edition of courses on demand brought to you by Forex dot Academy. In this course, we will be
Hello, and welcome to this latest edition of courses on demand brought to you by Forex dot Academy. In this course, we will be discussing an introduction to Fibonacci. There is, of course, in risk when trading in the financial market. So, just before, we do begin please take a moment to familiarise yourself with the following disclaimer.
So, in this lesson, what, we hope to cover is really develop a basis with the introduction to Fibonacci. What is it all about and how do, we use it? As a technical indicator, we’ll discuss its mathematical significance, and it does actually have some significance in many walks of life in nature. We will discuss it as a technical indicator in relation to its support and resistance. So, that is really what It does. It looks for these areas within the market that, we look for trading opportunities, on congestion of price action around levels of support, and resistance. We will be really discussing how to use it as an indicator. Looking at these Fibonacci levels how to use it from high to low in the markets, and how significant. It can be, as a technical influence on our trading, and then we’ll be discussing some of the limitations obviously, as a technical indicator many other technical indicators. As technical analysts, we know and accept that they have various limitations. We’ll discuss the limitations of Fibonacci retracements themselves. So, let’s delve into our introduction to Fibonacci retracement levels, and these levels are very important to technical traders, as the highlight long-term support, and resistance levels that often identify potential market reversals. It is perhaps one of the most commonly used techniques that indicators, and us such generates additional interest when the market rates in, and around these levels okay. So, as technical traders, we are aware of these levels within the market, and that actually generates an additional level of interest, and is often a self-fulfilling prophecy, as price movement tends to react quite volatile and shift away from such levels. As an indicator, it is more applicable to trading longer time frames and is not suitable for trading shorter time frame analysis, for example, five-minute price action charting. Okay, however, given its objective in identifying potential reversal signals. It does work much better in markets that experience long-term volatility, and continued price change, and we will discuss this in much more detail throughout the webinar.
It is much more applicable for those markets that experienced volatility obviously, if we’re looking to trade off levels were, we see market pullbacks, we see levels of contraction, and potentially look to buy from those areas, if it’s selling off in that direction that fall eternity will actually give us opportunity with our Fibonacci retracement levels. So, these Fibonacci retracement levels, they alert traders to possible support and resistance areas in the market. A possible reversal is based on the prior move.
Okay, so, we’re looking potentially for market pullback to reverse, and the trading decision a bounce is expected to retrace a portion of the prior decline while a correction is expected to retrace a portion of the prior advance when a market pullback occurs technical traders identify a retracement levels for monitoring okay, and because, as I said, they are a self-fulfilling prophecy many traders are speculating in, and around these areas, we know how they’re going to react let’s say potentially the market is trading at all-time highs, and it pulls back to a 50 percent a level of retracement, we know that is very significant, and an area, where many traders are indeed monitoring the Fibonacci retracement has of course mathematical significance. It derives its values from a series of numbers these numbers were developed by Italian mathematician Leonardo of Pisa they’re in 1175 to 1250. So, those are the Fibonacci numbers they’re ranging from 1 to 144, and of course, they continue in the Fibonacci sequence, they are very significant, and, we often see them in many natural Universal proportions both mathematicians, and scientists conclude that their significance you can see them, and, as you look at the image there to the left resembles almost a share like, and make sure that you see on a beach with the formation of the swirl the Fibonacci swirl very famous indeed, they are important to us, as traders, as, they can identify these possible levels in the market support or resistance traders often trade these levels or look for breaker, and opportunities. So, when, we see them bounce from, as support to resistance within a level, they can often range, and that can cause range buying opportunities for a long consistent period of time or perhaps when these eventually break down, we can look for these breakout opportunities there is an acknowledgement of such levels often because trading congestion that leads to I suppose a lot of interest within the markets at these key for Fibonacci levels that’s generally what we’ll see there are a lot of speculative traders looking to trade these levels, and, as prices congest down to these levels that’s why you often see a breakouts after a mature trading trend almost expires from the level you can see a quick shift a quick burst of a volume in, and around these levels.
So, they’re technically very significant. Let’s discuss our Fibonacci levels, as technical support, and resistance for a moment in identifying in January levels of support, and resistance this obviously helps traders to discover both floors, and ceilings in the market okay. So, these prices are often supported by floors unresisted by the ceilings just like our house there, we have an image of the house, where the floor is actually supporting I say your body weight, and everything in the house on the ceiling would be resisting anything from the outside have perhaps weatheror rain anything like that a downward pressure on the house itself these levels are particularly important over long periods of time, they are never a sure signal just like many other technical indicators prices often breakthrough such levels with strength, and, we see that, as a breaker, and, where exactly this is the common question, we get asked, as trading educators, where exactly should support, and resistance levels be pray be placed in the markets. So, here, we have a gold market, and, we can observe just technically, where you see our technical levels of support, and resistance, and it’s really not too difficult a question to ask why do, we choose these levels of support or resistance well, as, we look at the gold market we’re looking at the daily comments like structure albeit it’s over a long period of time, we can see that there are very significant areas or inflection points within these markets, we can see, we have a long-time high in, and around, and when, we have our level of support one-three-five-six, and of course, we have some very strong bounces from such an area. So, what I’d like to do is actually highlight some of these areas within the market here these areas, of course, I’m going hole we’re back to 2014 it’s technically significant for us. It is a long-time high in regards to the last three years of price action, and obviously the market has concluded that, It cannot break these highs for a long period of time that would lead us to believe that this level of support or resistance either one-three-five-six level is technically significant but, we can see throughout that there are some very important price inflection points here would be another level where we can see yes the market traded down all but a few times but. It punched quite strongly from these levels did break it on several occasions, but you can see over the long term. It does provide some real technical support, and, we get some very consistent bounces from the area these areas can convey an or these bounces can actually only last for a I suppose a short period of time, as, we see our next level of support holds up quite well over many significant areas within the market.
So, these are genuine levels of support, and resistance over the long term in the markets that seem to hold up, and quite well how does this relate in terms of ahead establishing the Fibonacci retracements well that is the real focus of Fibonacci retracement. It is to look for further levels of technical support, and resistance that can give you more evidence to actually look a tradeoff these areas or levels. So, as I move across to in the price chart here this is the dollar-yen daily chart the question I would like to pose for technical traders is how do we identify genuine levels of support, and resistance within the markets well let’s try, and look at, and just visibly see for a moon, if, we can see some highs, and lows over the price action that can give us our own identifiable levels of support of resistance obviously in observing these price action charts, we can see initially that some will be more significant than others. So, here, we have three very strong structured highs, and lows within the markets and they’re providing some technical support, and within this technical support, we have about a few various branches that are providing perhaps some shorter time levels of support and resistance. So, just by observing the price section chart what, we can do is look at these previous highs, and lows existing in the markets to give some technical at January levels of support, and resistance let’s look at identifying this technical support, and resistance areas over asset classes here on what, we have in front of us is the German DAX it’s an equity index in Europe, and, we have daily price action from left to right, we can see already, we have placed an overlay of some genuine levels of support, and resistance again they’re based on previous highs, and lows which give us a very strong inflection points within the markets what, we can see here is that we have a ceiling that is actually providing resistance over a sustained period of time, and, as the market trades up through, and breaks that level that ceiling then becomes a floor in the market. So, it’s very important to note that, as, we trade the markets can break through these levels, and obviously once the breakout occurs that previous level of support and resistance has actually faltered, and can actually change or shift to become a new level of support or resistance in the market
That again provides us with trading opportunity, as, we look to more relative price action we’ve seen a very strong break to the downside in this German DAX market, and that breakout opportunity has moved quite swiftly in terms of the price, and that’s generally what can occur in these markets we’ve seen the floor here. It provided support over a sustained period of time the market, and trade up to new high reverted from new highs, and with that weakness looking at the Japanese the structure of that Japanese candlestick, we see a very strong consistent breakthrough to the downside over of our new floor here, we have the gold market in front of us again, if, we look at the price section its daily candlesticks, and moving from left to right over a long consistent period of time what, we can see is a technical overlay is actually a Fibonacci retracement, and it is extending from a recent high to low point. So, that’s how we actually use these Fibonacci indicators, we look for a recent a real high or low point or a high to low, and actually stretch the indicator from those areas that stretch across our Fibonacci retracement levels of support, and resistance. So, it creates these retracement support levels, as a function of the Fibonacci numbers, as a technical indicator. It works better for particular asset classes, and, we will discuss that again in more detail, and the question I would like to pose is what happens next, we can see the blue circle indicating almost relative price action, and it is our 23.6 Fibonacci retracement level well what happens next, we know that there could be a significant move from this level, we could see a points up to new highs again or, we could see the price break down I have from our Fibonacci retracement level right the whole way down to 38.2 potentially lower over 50% retracement level. So, let’s branch across to a different asset class here in front, we have the US dollars are, and the question again I would like to pose here, where exactly do, we place the Fibonacci retracement indicator, if, we remember back to the previous slide we’re looking for a high, and low within this market something that can give us a real genuine insight, as to, where the Fibonacci numbers may be significant we’re not looking to perhaps pick a high, and a low from the past week we’re looking for an overall a genuine level of reflection over that consistent period of trading looking at these daily candlesticks high, and low that can give us a subjective level to, where the indicator is more observable. So, here, as, we input our indicator ins in the market, we can see the most recent long term high in the most recent long term lows are the most significant areas in which to place this Fibonacci indicator. So, let’s delve into the actual study of Fibonacci retracement, as a technical indicator in terms of what it means for our trading notice that I’ve used this market before quite a few times the gold market because gold is quite significant in terms of technically adhering to the Fibonacci retracement level, and again I wanted to use this because it is a good example, to use the indicator, and actually applying it to the markets. Notice in this chart, now, that I have my Fibonacci level, as the second most recent high there, and I want to really give you this, as an indicator in terms of high price section moves, as, we look to trade.
So, let’s just say for example, we begin trading where, we have our begin trading point marked how could, we look to perhaps trade this in terms of looking for levels of support, and resistance, and pullbacks within the market, and actually looking to trade, and corrections or our bounces from such levels will be, we have here our green circles here which actually give us very good strong signals to trade this market, we can look to buy or sell, as the market trades up or down between our indicator levels. So, very good term structures indeed but notice again that, we have some areas, where the signal actually is a pure signal on. It actually gives us some losing trades, if, we decided how it decided to take these trading positions on. So, there is a level of inconsistency with the indicator itself and, if we hadn’t started other begin trading signal there, we would have made have various good trades, and a few bad trades, as well. So, there is that level of inconsistency again, as, we approach our most recent price action the question is often well what happens here what’s going to happen next, and all, we can do is observe the price actually ask technical traders looking for closing perhaps the structure of the Japanese candlesticks – – perhaps volume, and momentum shifts to see, if we can get more of a signal that this market will actually bounce from this level or break through it, we know that it’s technically significant and that many other traders are focusing on monitoring their technical trading decisions around this retracement level. It is the awareness of these Fibonacci levels therefore that the markets often focus their attention on this can then become a self-fulfilling prophecy, as traders observe price action around these levels, and that leads us nicely on them to discussing the limitations of Fibonacci retracement, as a technical indicator the underlying principle of any Fibonacci tool is only a numeric anomaly and is not grounded in any logical proof, and that is a very important point to make there, guys. Okay, just like any other indicator of the Fibonacci retracement is not a standalone signal that, we can use for trading decisions, we could potentially look for let these levels of support, and resistance of course, and look how a price-action and trades around these areas perhaps congest perhaps there’s more volatility perhaps there is more volume but, we can see that. It is inconsistent in terms of providing us with assured signals or logical proof that this market is either going to reverse or look for sustained movement and from a breakthrough.
So, it is only one indicator, and to be coupled or used to try, and heighten your probability of a trade the indicator is not applicable to all asset classes to another’s one of the reasons of course why I chose to present the Forex pairs in the gold market again because those markets are quite volatile over the long run, they can see a shorter-term shifts in sentiment, they can see shorter-term shifts in trend, and status, as well, and that’s what we’re looking for. We’re looking for potential pullbacks in these markets, where the Fibonacci retracementcan be met, and actually look for trading opportunities again, if I use the example, of an equity market or an equity market bull run, and which were actually seen in the markets. Now, we aren’t given the best opportunities in terms of seeing these long-term Corrections or volatility to maybe get, as many trades off from our long-term high-to-low, and Fibonacci retracement perhaps, if, we see a real structured correction in an equity market that can give us a signal, and to maybe look for a pullback in the Fibonacci retracement pergolas, we know that volatility isn’t, as such that, we get. So, many variants of price action over a long term price action chart when observing the equities. So, it, as an indicator is not, as applicable to observing such asset classes, as equity markets class retracement only points to possible Corrections reversals on counter Tran bounces and struggles to confirm any logical buy or sell signals, and that is very significant for us, as traders, we know that we’re very much concerned with trying to find these big moves in the market, if you’re particularly a long-term trader you’re looking to either buy or sell the market, and have a directional bias in the long term the Fibonacci retracement given that it’s looking for pullback. So, market reversals or counter-trend bounces it’s looking to find out volatility to find, and perhaps opportunity within the volatility. It doesn’t actually give us those buy or sell long-term signals in the markets. So, that’s very significant in terms of trying to try, and trade, and it doesn’t necessarily help her age or decision making whatsoever, and of course it can experience a high degree of inconsistency.
This is something we’ve seen even by observing the price charts throughout the webinar we’ve seen the gold market how. It was providing us with some very good signals. It was providing us with some per Cygnus that would have led to some losses of course, as well but that’s part, and parcel of using these technical indicators, they are not always an assured sign of a high probability trade, they can often be quite inconsistent, and that’s why, as technical traders, and certainly when trading Fibonacci retracements. It is advised to look to use many of these technical indicators to really stack the odds in your favour in terms of decision making, as a technical trader okay. So, that brings us to the end of this introduction to Fibonacci webinar. Let’s have a quick review of what we’ve actually learned! Obviously in discussing both introduction to Fibonacci, and mathematical significance, we know that it is derived from the mathematical, as significance really of the Fibonacci sequence, or numbers those in turn, give us an outlay which, we can stretch on to our price action chart, and, they help us derive technical support, and resistance but, they are observable in price inflection points long-term price inflection points that, we can look to look to add our own genuine levels of support, and resistance, if, we can use perhaps the Fibonacci retracement levels across these price action charts, as well not gonna help us, and give us another signal to actually looking for mathematical levels of support, and resistance. So, that could lift a couple upon, and really giving us more probability in terms of a possible level or genuine level within the market. We then went on to actually express these Fibonacci retracement levels across various asset classes. So, we looked at the gold market, and some Forex pairs, and highlighted some trading opportunities there, and that led us nicely into discussing the limitations of Fibonacci retracement, as an indicator, it is often providing us with some very well structured levels of support, and resistance in the market what perhaps is a time very consistent with its trading opportunities given that. It gives us good signals and some false signals, as well. So, that brings us to the end of this webinar. Thank you very much for joining us on this installment of courses on demand brought to you by Forex dot Academy. We do hope to see you very soon. Bye for now.
Background
Traders use the Elliott Wave mostly as a continuously developing price map, on which they try to guess the most probable future path. Sometimes the trader waits for
Background
Traders use the Elliott Wave mostly as a continuously developing price map, on which they try to guess the most probable future path. Sometimes the trader waits for
Background
Traders use the Elliott Wave mostly as a continuously developing price map, on which they try to guess the most probable future path. Sometimes the trader waits for some unfinished wave to end, to pull the trigger or take profits. When this occurs, he or she commonly uses Fibonacci ratios in trading to forecast a price level for that event.
Ian Copsey on his book The Case for Modification of R.N. Elliott’s Impulsive Wave Structure, says he has found that harmonic ratios derived from the square root of two are also a very helpful tool.
My personal belief is that those ratios are really artefacts, a product of the random nature of the trading activity. In the age of computers and Big Data, a statistical study on the retracements ratios might reveal much more precise information about those proportions. Even better, a computer study might be developed to show the most likely retracement levels as a function of the latest N-retracements, taking account of the recent volatility changes.
Nonetheless, Fibonacci ratios and Sqrt-2 ratios may serve as an approximation to forecast retracements or extensions when a better information tool is unavailable.
Fibonacci
Leonardo Pisano Bigollo (1170-1250), known as Leonardo Fibonacci, was an Italian mathematician and traveller, who studied and brought the Indo-Arabic numerical system to Europe. This revolutionary numerical system on which the absolute value of a digit is established by its position within the number made possible the mathematical and scientific revolution in Europe.
In his Liber Abaci book of 1202, Fibonacci introduced the arithmetic systems he learned from the merchants working on the Mediterranean coast that he called modus Indorum (The way of the Indians). The book made a case for a 0-9 digits and place value, as well as examples of how to use it in business to calculate interest rates, money-changing, and other applications.
The Fibonacci sequence
The book also discusses irrational numbers, prime numbers, and the Fibonacci series, as a solution to the problem of the growth of a population of rabbits.
The Fibonacci sequence starts with two ones: 1,1. The following numbers in the series are calculated as the sum of the preceding two numbers. He carried the calculation up to 377, but he didn’t discuss the golden ratio as the limit ratio of consecutive numbers in the sequence.
Below, Table 1 shows in yellow the first 27 Fibonacci numbers. The other columns, from 1 to 6 show the results of the n-following divisions, as a percentage. That is the result of dividing the Fibonacci number by next one, two apart, three apart etc.
The last column shows the stabilized Fibonacci ratios generated:
Table 2 shows the Fibonacci ratios of the n-preceding division as a percentage.
As with the preceding table, the last column shows the stabilized Fibonacci ratios generated:
Two more sets of Fibonacci multiplying ratios are obtained by multiplication and division of the N-following ratios:
As we can observe, except for ratios smaller than 5% and the 100% ratio, all of them are already present in the original series.
The Square root of two
Well, the square root of two is the first known irrational number, and the one that raised heated passions in ancient Greece, that ended with a crime. At a date around 520 BC, a man called Hippasus of Metapontum was dropped from a boat into open waters to die. The man’s crime was revealing to the world a “dirty” mathematical secret. The secret of the relation between the sides of the square triangle of length 1, and its hypotenuse.
According to the well known Pythagoras theorem, the sum of the squares of the sides a rectangle is equal to the hypotenuse squared.
Therefore, for unity sides: 12+12 = 2, therefore the hypotenuse length is the square root of 2.
The square root of two including its four decimal places is 1.4242
This article is not focused on the proof that the square root of two is not rational, so I’d recommend the curious reader the following page:
Ian Copsey explains that he was told about this ratio applied to the markets by some acquaintance, who stated that it was commonly occurring between musical notes.
After studying it, Mr Copsey began to find out that two derivations of this ratio usually happened: 41.4% and it complementary 58.6%, being 100-41.4%.
Usual wave relationships
Ian Copsey says in his book that, after many research hours into normal relationships between waves, he has found the most usual to be:
To this list, you can add those derived from the square root of 2: 41.4% and 58.6%.
And, specifically on Wave (iii), it’s possible to take those ratios and add 100%, 200% and on occasions 300% and 400%.
The most common extensions he has found were: 138.2%, 176.4%, 223.6%, 261.8%, 276.4%, and 285.4%. Additionally, but less frequently, he found 158.6%, 166.7%, 238.2%, and 361.8% and occasionally 423.6% and also 461.8%
It’s important to observe the underlying ratios of a particular market trend. It’s better to stick with the ratios that often show in the most recent retracements of the same kind.
As is usual, the help of visual channels, spotting important supports and resistances or pivot points may show which one of those ratios best fit the rest of the clues.
It is also noteworthy that the projections of the Wave (v) and also of the Wave (c) should match the end of higher-order waves as well, so the most probable final ratio is the result of that confluence.
The data below was taken from Mr Copsey’s study, published in the referred book.
Wave (i)
There is no relationship to any previous wave as this is the start of a five-wave sequence.
Wave (ii)
This is a corrective wave of Wave (i). This retracement is one of the most difficult to assess. According to Ian Copsey, it can go from 14.5% up to 100%. He also mentions that on a 5 min chart it’s complicated to observe the sub-waves composing Wave(ii), however on a daily chart it shows the typical A-B-C pattern or, even, more complex patterns.
Wave (iii)
Wave (iii) is an extension of Wave (i), projected from the end of wave (ii).
Projections:
The most typical forecast are 176.4%, 185.4%, 190.02%, 223.6%, 276.4%, and 285.4% projections of Wave (i).
Less recurring projections are: 138.2%, 166.7%%, and 261.8%.
Sporadically it goes to: 123.6%, 238.2%, 361.8%, 423.6%, and 476.4%.
Wave (iv)
Wave (iv) is, of course, a retracement starting from the top of Wave (iii). At this stage, noting the implications of the alternation rule with Wave (ii) or Wave (b) there is a stronger basis to identify the end of the pullback.
Potential retracement percentages:
For small retracements: 14.6%, 23.6%, 33.3%, and 38.2%.
For mid retracements: 41.4% and 50%.
For intense retracements: 58.6% and less often 61.8% or 66.7%.
Wave (v)
Wave (v) is an extension of the total price move from the beginning of Wave (i) to the end of Wave (iii), projected from the end of Wave (iv).
Having identified Wave (iv) makes it much easier to build up a projection for Wave (v).
Projections:
The bulk of projections go to 61.8%, 66.7%, and 76.4%.
In a truncated Wave (v), usual ratios are 58.6% and 50%.
In an extended Wave (v), the most usual projections are: 85.6%, 100%, 114.4%, and sometimes 123.6% and 138.2%.
Wave (A)
Wave (A) is similar to Wave (I) in its unpredictability. There is no reference to spot its end because there is no relation to other prior waves. The best method is to find a higher order price channel in which this wave might end, observe support/resistance levels or pivot points.
Another method is to go to a shorter time frame, watch the 5-wave pattern that constitutes the A wave and try to project Wave (v) by matching it with a previous Wave (B) of Wave (v) or the prior Wave (iv).
Wave (B)
Wave (B) is a retracement of Wave (A), but it’s a correction within a correction so that it can be really complicated and random. The retracement ratios range from 15% to 100%. The use of pivot, swing high and low, and support/resistance levels give more clues than simple mathematical ratios.
As stated in other articles, it doesn’t pay to trade Wave (B) or any other 3-wave corrective pattern for that matter, because of it’s poor reward-to-risk ratio.
Wave (C)
Wave (C) is an extension of Wave (A) projected from the end of Wave (B).
Projections:
The most usual projections are: 100%, 105.6%, 109.2%, 114.4%, 138.2%, and 161.8%.
Less common are: 76.4%, 85.6%, 123.6%, and 176.4%.
Sporadic projections are: 123.6%, 223.6%, and 261.8%, but sometimes, as short as 61.8%.
It is important to note that Wave (C) is related to the next higher and lower degrees. Thus, its sub-wave (v) should, also, match Wave (A) extension and, if it’s part of a higher degree’s Wave (iii) or Wave (v), their possible projections.
Wave (x)
Wave (x) usually retrace similarly to Wave (b).
Triangles
Wave a: retraces deeply. In a Wave (iv) this exceeds 50% of Wave (iii)
Wave b: commonly retraces beyond 76% of Wave a
Wave c: projects 66.7% to 76.4% of Wave a, from the end of Wave b
Wave d: 66.7% to 76.4% of Wave b from the end of Wave c
Wave e: a zigzag less than 66% of Wave d
Expanded Flat Corrections
Wave a: 50% of the preceding wave
Wave b: 15% to 38%, occasionally as low as 9% and rarely up to 41%
Wave c: Back to the end of Wave or beyond.
Final guidance
Those values are only a guide. Every market has its characteristics; therefore you should know them to trade efficiently. Additionally, every timeframe behaves differently.
In intra-day trading, you should add pivot points to this analysis as pivots are used heavily by professional traders.
Visual clues offer better information than numerical values. If the projection or retracement touches a trendline drawn on price channel or support/resistance area, then the chance of that projected value increases substantially.
Reference:
The Case for Modification of R.N. Elliott’s Impulsive Wave Structure, Ian Copsey

 Gartley Pattern Trading Strategy