Categories
Forex Course

120. Introduction To Harmonic Patterns

Introduction

In the previous course articles, we have been discussing a lot of concepts related to Technical Analysis. In that journey, we have learned the trading of some of the most significant chart patterns like Head & Shoulders, Triangle, Wedge, etc. The extension to the learning of these concepts is to know the process of identifying and trading of Harmonic Patterns. We want to mention that learning this part is a bit tricky as the concepts are advanced and require a lot of practice to master them. Let’s get into details.

Brief History

The discovery of these Harmonic patterns dates back to the 1930s. H.M.Gartley, an American author and technical analyst, mentioned the trading of these unique patterns in his book ‘Profits In The Stock Market.’ Later these patterns were highly improvised by ‘Larry Pesavento’ by adding Fib ratios to identify and confirm these patterns. Finally, ‘Scott Carney’ discovered more Harmonic patterns and published them in his most famous book ‘Harmonic Trading.’

What Are Harmonic Patterns?

Harmonic Chart Patterns are nothing but the same kind of Forex chart patterns that we have learned in our previous lessons. But the shapes of these patterns look similar to the real-life birds and animals. For instance, one of the very well known harmonic chart patterns is the Butterfly pattern. That is, when this pattern is complete, we will be able to see a butterfly-like structure on the price charts formed by the price action.

All the Harmonic patterns are both bullish and bearish in nature. That is, these patterns can be identified and traded in both up trending & down trending markets. Also, some of the Harmonic patterns indicate that the current market trend is going to continue, and some of them indicate a market reversal. Hence we can consider Harmonics as both trend continuation and reversal patterns.

Why is it important to know them?

The harmonic patterns levels-up the pattern-based trading as it involves an additional technical tool to confirm and trade them. And that tool is none other than the well known Fibonacci levels. The harmonic patterns can only be confirmed by analyzing at what levels the price action turning its directions. Only if these levels are in line with the predefined Fibonacci levels, we can confirm and trade these patterns. The harmonic trading enables traders in predicting the future price movements of an asset more accurately than any other form of trading.

How many Harmonic Patterns are there?

In total, there are nine Harmonic patterns out of which six are used frequently by the traders to trade the Forex market. The ideology behind trading any of these patterns is the same; we must wait for a particular Harmonic pattern to form completely on the price chart and then take long or short positions accordingly. In the upcoming course lessons, we will be discussing the six Harmonic patterns that we have mentioned below.

The other three less used Harmonic patterns are Shark Pattern, Cypher Pattern, and the ABC Pattern. Stay tuned to learn the trading of these patterns in the easiest way possible. Cheers!

Categories
Forex Basic Strategies

Identifying & Trading The Bullish & Bearish Gartley Pattern

Introduction

We have discussed three of the most used Harmonic patterns in the previous strategy articles, and they are AB=CD, Butterfly, and Bat patterns. In today’s article, let’s learn how to trade one of the oldest Harmonic patterns – The Gartley. Trading harmonic patterns is one of the most challenging ways to trade but equally rewarding. There are traders across the world who highly believe in these patterns because of their accuracy in identifying trading signals, and the high RRR trades they offer.

The Gartley is one of the most commonly used harmonic patterns as it works very well on all the timeframes. IT is also one such pattern that frequently appears on the price charts. H.M Gartley introduced this pattern in his book ‘Profits in the Stock Market’ in the year 1935.

This pattern is also known as the Gartley 222 pattern because H.M Gartley introduced this pattern in the 222nd page of his book. There are both bearish and bullish Gartley patterns, and they appear depending on the underlying trend of the market. The Gartley pattern is made up of 5 pivot points; let’s see what these points are in the below section.

5 Pivot Points of The Garley Pattern

Just like other harmonic patterns, H.M Gartley used five letters to distinguish the five separate moves and impulses of the Gartley pattern.

  • The letter X represents the start of the trend.
  • The letter A represents the end of the trend.
  • The letter B represents the first pullback of the trend.
  • The letter C represents the pullback of the pullback.
  • The letter D represents the target of the letter C.

Gartley Pattern Rules

‘X-A’ – This is the very first move of the pattern. The wave XA doesn’t fit any criteria, so it is nothing but a bullish or bearish move in the market.

‘A-B’ – The Second move AB should approximately be at the 61.8% level of the first XA move. So if the XA move is bearish, the AB move should reverse the price action and reach the 61.8% Fib retracement level of the XA.

‘B-C’ – The goal of the BC move is to reverse the AB move. Also, the BC move should end either at 88.6% or 38.2% Fibonacci retracement level of XA.

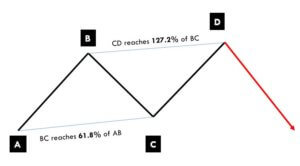
‘C-D’ – The CD move is the reversal of the BC move. So if the BC move is 38.2% of the AB, CD move should respond at 127.2% level of BC. If BC move is at the 88.6% level of the AB move, the CD move should be at the 161.8% Fib extension level of BC.

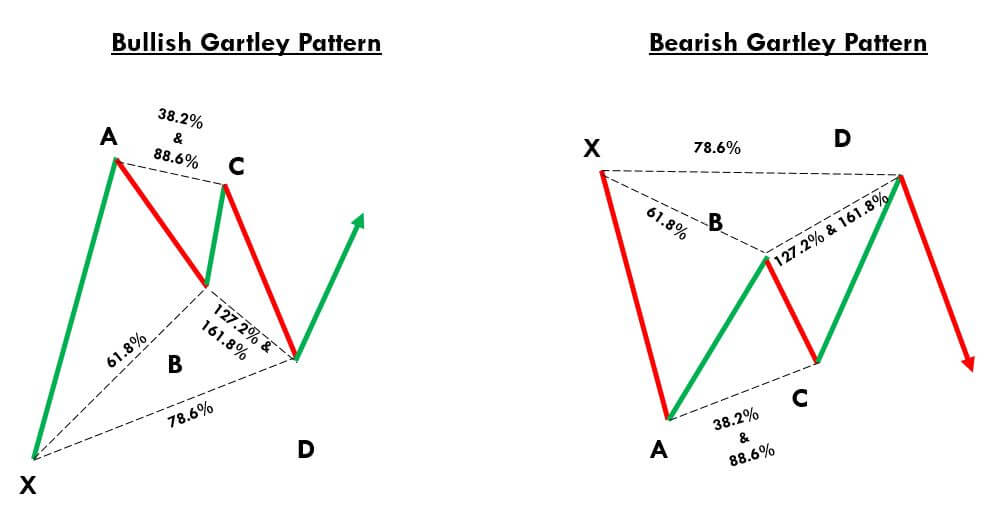
‘A-D’ – This is the last but most crucial move of the Gartley pattern. Once the CD move is over, the next step is to measure the AD move. The Last AD move will show us the validity of the Gartley Pattern on the price chart. The pattern is said to be valid if this move takes a retracement approximately at the 78.6% Fib level of the XA move.

Below is the pictographic representation of the Gartley Pattern

 Gartley Pattern Trading Strategy 

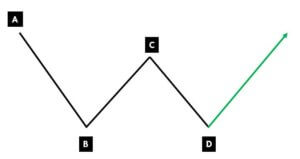
Trading The Bullish Gartley Pattern

In the below NZD/USD weekly chart, we can see that the market is in a clear uptrend. We have then found the swing high and swing low, which is marked by the point X & Point A. We then have four swing-high & swing-low points on the price chart that binds together to form the Gartley harmonic pattern.

Always remember that every swing high and low must validate the Fibs ratios of the Gartley pattern. These levels can be approximate as we can never trade the market if we keep waiting for the perfect set-up. There are indicators out there where the Fibonacci levels are present in them by default. We generally use TradingView, and in this charting software, the below-used indicator can be found in the toolbox, which is present on the left-hand side.

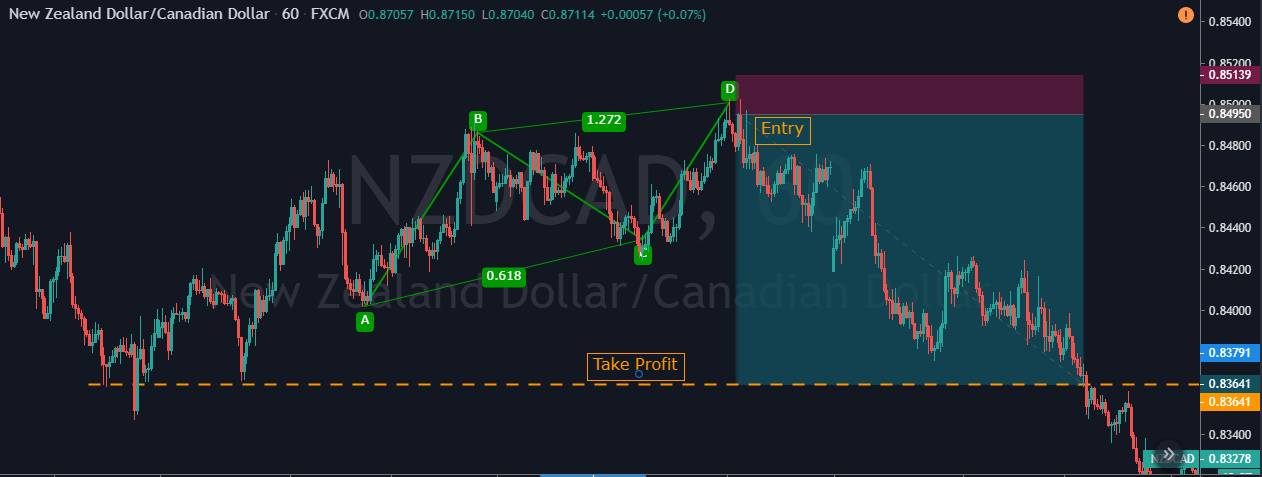
Please refer to the marked region in the chart below. The first XA leg is formed just like a random bullish move in the market. The second AB move is a bearish retracement, and it is at the 61.8% Fib level of the XA move. Furthermore, the BC is a bullish move again, and it follows the 88.6% Fib level of the AB move. The CD leg is the last bearish move, and it is respecting the 161.8% Fib level of BC.

Now we have identified the bullish Gartley pattern on the price chart. We can take our long positions as soon as the CD move ends at the 161.8% level. The next and most crucial step of our strategy is to find the potential placement of our stop-loss. The ideal region to place the stop-loss is just below point X. If the price action breaks the point X, it automatically invalidates the Gartley pattern.

However, stop-loss placement depends on what kind of trader you are. Some aggressive traders place stop-losses just below the entry while some use wider stops. We suggest you follow the rules of the strategy and use point X as an ideal stop-loss placement.

B, C & A points can be considered as ideal areas for taking your profits. We suggest you go for higher targets in the case of the formation of a perfect Gartley pattern. Overall, placing a ‘take-profit‘ order depends on your previous trading experience also. Because, if you come across any ideal candlestick patterns in your favor while your trade is performing, you can extend your profits. We can also combine this pattern with other reliable technical indicators to load more positions in our trades.

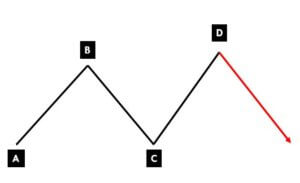
Trading The Bearish Gartley Pattern

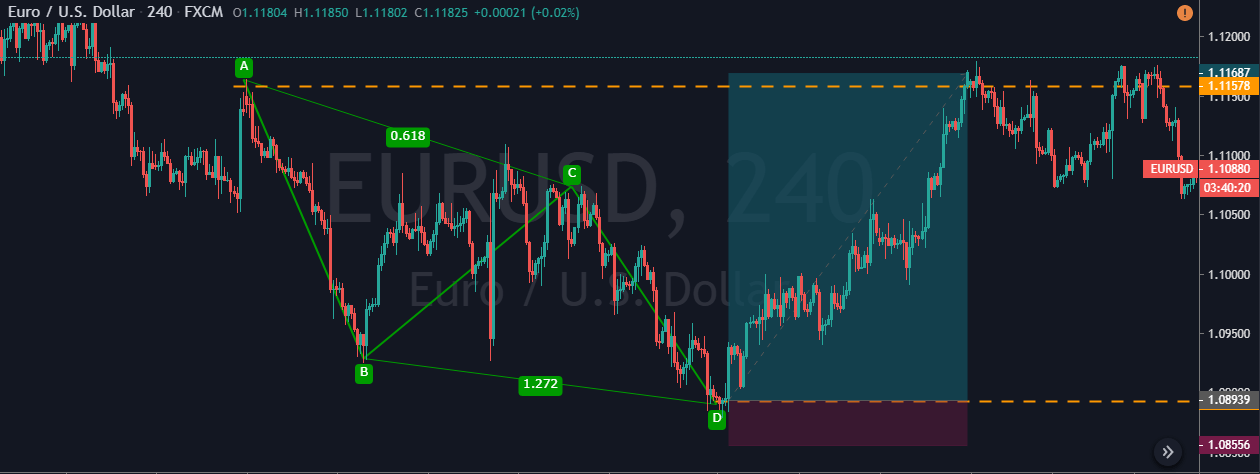
Below is the EUR/GBP four-hour chart in which we have identified the bearish Gartley pattern. In the highlighted region, we can see the formation of the bearish XA leg like a random bearish move. The second leg is AB – a bullish retracement stopping at the 61.8% level of the XA move. Furthermore, the BC move is bearish again, and it respects the 88.6% Fibs level of the AB move. CD is the final bullish move, and it is respecting the 161.8% Fibs level of BC.

As soon as the price action completes the CD move, we can be assured that the Gartley pattern is formed on our price chart. We can also see the formation of a Red confirmation candle indicating us to go short in this Forex pair. We have taken our short positions at point D and placed our stop-loss just above point X.

We have three targets in total, and they are points B, C, and A. Within a few hours, the price action hits the B point, which was our first target. Moreover, the price pulled back at point C, but we were safe in our trade as our stop-loss was placed above point X. Our final target was at point A, which is achieved within four days.

Conclusion

The Gartley pattern is wholly based on mathematical formulas and Fibonacci ratios. Remember to take the trades only when all the mentioned Fib levels are respected. If you have no experience with harmonic patterns, you must master this pattern on a demo account first and then use them on the live markets. We are saying this because it requires a lot of patience and practice to identify and trade these patterns.

We hope you understood how to identify and trade the Gartley Harmonic Pattern. If you have any questions, let us know in the comments below. Cheers!

Categories
Forex Basic Strategies

Trading The ‘AB=CD’ Harmonic Pattern Using Fibonacci Ratios

Introduction

H.M Gartley published a book known as ‘Profits in the Stock Market’ in 1932. In this book, Gartley shared the entire group of harmonic patterns that are widely being used by traders across the world. AB=CD is one such pattern from the harmonic group. As time has passed, professional traders and market technicians improved this pattern a lot. They have also incorporated the Fibonacci ratios to this pattern, which will be discussed in this article.

AB=CD is a reversal pattern that helps traders in predicting when the price action of an underlying asset is about to reverse. It is a visual geometric pattern comprised of three consecutive price swings. This pattern helps to identify the trading opportunities in all types of markets, on any timeframe, and in any kind of market condition. Bullish AB=CD pattern helps traders in identifying higher probability buy trades, whereas bearish AB=CD patterns help in determining selling opportunities.

This pattern includes a total of four letters – A, B, C, D. Each turning point represents a significant high or low on the chart. These turning points are referred to as AB move, BC move, and the CD move. Let’s see how traders must perceive this pattern in the upcoming sections.

AB=CD Pattern Rules

Bullish AB=CD Pattern

  • The bullish AB=CD pattern always appears in a downtrend.
  • First of all, point A to B will be any random downtrend move.
  • Then the price action must go into the counter side of the AB move, printing the B to C move.
  • The original selling trend should resume and print the CD leg resembling the AB leg.
  • Once all these three moves are completed, we can conclude that the market has printed the bullish AB=CD pattern
  • Activate the buy trades only at point D.

Bearish AB=CD Pattern

  • Bearish AB=CD pattern is nothing but a mirror image of the Bullish AB=CD pattern.
  • The pattern begins with a bullish line from point A to B.
  • These points could be any random move in an uptrend.
  • B to C move should reverse the trend of the market but shouldn’t cross point A.
  • C to D move should be equal in size to point A and B.
  • Once all these moves are completed, we can conclude that the market has printed the bearish AB=CD pattern
  • Start taking sell trades only from point D.

AB=CD Pattern – Fibonacci Ratios

As already mentioned, Fibonacci ratios can be used to confirm the validity of the AB=CD patter. Below are the fib levels that are incorporated in the AB=CD pattern by trading experts for pattern validation.

BC leg is the 61.8% Fib retracement of AB leg.

CD leg is the 127.2% Fib retracement of BC leg.

Only at these retracement levels, the length of AB will be equal to the length of the CD.

Only take the trades if these above Fibonacci levels are matching with the setup on your charts. Ignore the setup if the Fib levels aren’t matching.

As you can see in the above image, the BC move retraces 61.8 of the AB and CD move is the 127.2% extension of the BC move. Also, the length of the AB move is equal to the extent of CD, i.e., both the movements must take the same time to develop on the charts. If any underlying currency pair is confirming all the mentioned rules, only then we can safely anticipate a higher probability trade.

AB= CD Pattern Trading Strategy

We believe by now, you understood the formation of the AB=CD pattern very well. Now let’s combine this pattern with the Fibs ratio as discussed to learn how to trade this pattern in the right way. As soon as we identify this pattern on the price chart, the only problem most of the traders have is while determining the accurate Fib ratios. Novice or intermediate traders go wrong most of the time in this aspect. As a result, they lose their trade. So make sure always to set the accurate fibs ratio and only then trade the AB=CD setup.

Bullish AB=CD Pattern

In the below EUR/USD 240 minutes chart, we can see that the pair was in an overall downtrend. We can also see that the CD move is equal in size to AB move. Also, after applying Fib ratios, we now know that the BC is 61.8% retracement of the AB move, and CD is the 127% extension of the BC. Therefore we can confirm the validity of the Bullish AB=CD pattern.

Entry, Stop-loss & Take Profit

Execute a buying trade at point D. Furthermore, always place the stops just below the D point. This is because, if price action goes beyond this point, it invalidates the pattern. This pattern provides two ‘take profit’ targets. The first one is point C, and the other is point A. We have closed our full position at point A because after activating our trade, the price action immediately blasted to the north. This indicates that we can expect more extended targets in this pair.

Bearish AB=CD Pattern

In the below 60 minute chart of the NZD/CAD Forex pair, the market was in an uptrend. This means that if at all, we are expecting an AB=CD pattern, it will be bearish. Notice that the AB is completely equal in size to the CD move. Following the rules of the pattern is critical while trading the AB=CD pattern. After applying Fibs, we can see that the BC is 61.8% retracement of the AB move, and the CD move was also a 127% extension of the BC move on the price chart. This confirms the authenticity of the bearish AB=CD pattern. We have executed a sell trade at point D. Although it was not a smooth ride, we have closed our full position at the major support area.

Bottom Line 

AB=CD is one of the most popular trading patterns in the market. It is straightforward to identify, confirm, and trade as well. Also, we get to see this pattern frequently in the market, and traders can pair it with other forms of technical analysis to improve the odds of their trades. Always remember to follow the rules of the game; else, it is very difficult to win the game of trading. We hope you find this strategy useful. Try applying this strategy on a demo account and then apply it on the live charts. If you have enough questions, let us know in the comments below. Cheers!