Introduction
In the previous course articles, we have been discussing a lot of concepts related to Technical Analysis. In that journey, we have learned the trading of some of the most significant chart patterns like Head & Shoulders, Triangle, Wedge, etc. The extension to the learning of these concepts is to know the process of identifying and trading of Harmonic Patterns. We want to mention that learning this part is a bit tricky as the concepts are advanced and require a lot of practice to master them. Let’s get into details.
Brief History
The discovery of these Harmonic patterns dates back to the 1930s. H.M.Gartley, an American author and technical analyst, mentioned the trading of these unique patterns in his book ‘Profits In The Stock Market.’ Later these patterns were highly improvised by ‘Larry Pesavento’ by adding Fib ratios to identify and confirm these patterns. Finally, ‘Scott Carney’ discovered more Harmonic patterns and published them in his most famous book ‘Harmonic Trading.’
What Are Harmonic Patterns?
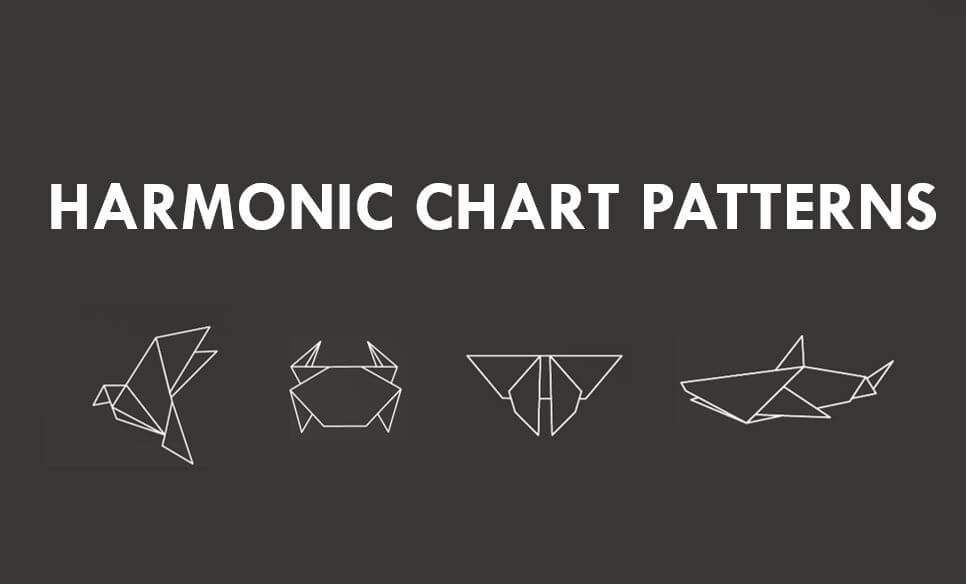
Harmonic Chart Patterns are nothing but the same kind of Forex chart patterns that we have learned in our previous lessons. But the shapes of these patterns look similar to the real-life birds and animals. For instance, one of the very well known harmonic chart patterns is the Butterfly pattern. That is, when this pattern is complete, we will be able to see a butterfly-like structure on the price charts formed by the price action.
All the Harmonic patterns are both bullish and bearish in nature. That is, these patterns can be identified and traded in both up trending & down trending markets. Also, some of the Harmonic patterns indicate that the current market trend is going to continue, and some of them indicate a market reversal. Hence we can consider Harmonics as both trend continuation and reversal patterns.
Why is it important to know them?
The harmonic patterns levels-up the pattern-based trading as it involves an additional technical tool to confirm and trade them. And that tool is none other than the well known Fibonacci levels. The harmonic patterns can only be confirmed by analyzing at what levels the price action turning its directions. Only if these levels are in line with the predefined Fibonacci levels, we can confirm and trade these patterns. The harmonic trading enables traders in predicting the future price movements of an asset more accurately than any other form of trading.
How many Harmonic Patterns are there?
In total, there are nine Harmonic patterns out of which six are used frequently by the traders to trade the Forex market. The ideology behind trading any of these patterns is the same; we must wait for a particular Harmonic pattern to form completely on the price chart and then take long or short positions accordingly. In the upcoming course lessons, we will be discussing the six Harmonic patterns that we have mentioned below.
- Butterfly Pattern
- Gartley Pattern
- Bat Pattern
- Crab pattern
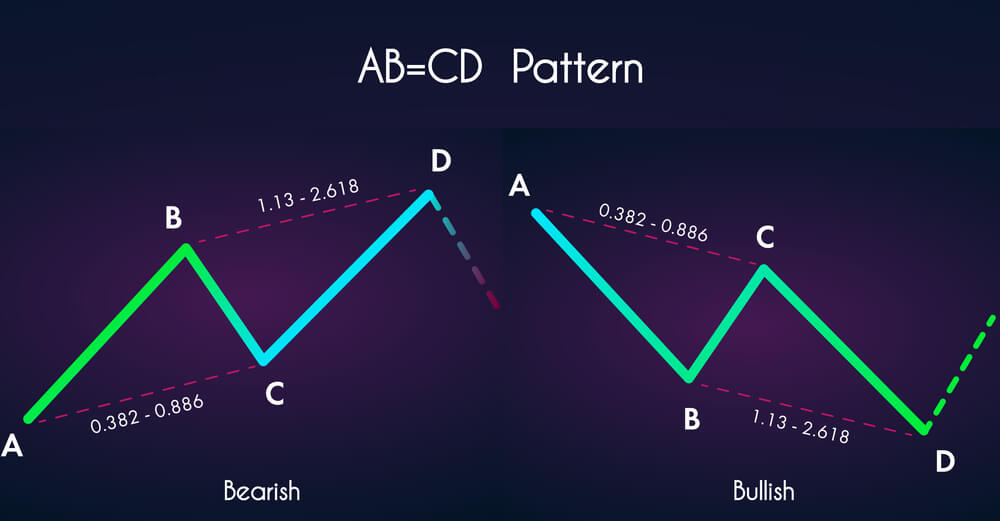
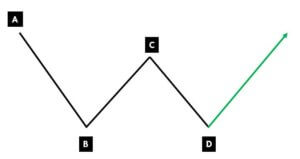
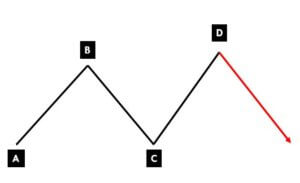
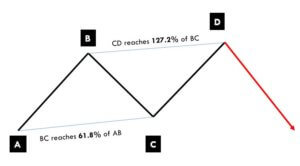
- AB=CD Pattern
- Three-Drive Pattern
The other three less used Harmonic patterns are Shark Pattern, Cypher Pattern, and the ABC Pattern. Stay tuned to learn the trading of these patterns in the easiest way possible. Cheers!