Categories
Forex Course

107. Comprehending The Impulsive Waves In Elliot Wave Theory

Introduction

In the previous lesson, we got started with understanding the fundamentals of the Elliot Wave theory. An introduction to impulsive waves and corrective waves was also discussed. This lesson shall go over the concept of impulsive waves.

There are two types of waves in the Elliot theory, impulsive and corrective. And as a whole, Elliot stated that a trending markets move in 5-3 wave patterns. The 5-wave pattern corresponds to the impulsive wave, and a 3-wave pattern corresponds to the corrective wave. And the combination of the 5-wave and 3-wave patterns form a trend.

Formation of Impulsive Wave

The impulsive waves are formed by five waves numbered from 1 through 5. Wave numbers 1, 3, and 5 are motive, i.e., they are the waves that go along the overall trend, while wave numbers 2 and 4 are corrective waves that go against the overall trend. Below is a diagram that represents the 5-wave impulsive pattern.

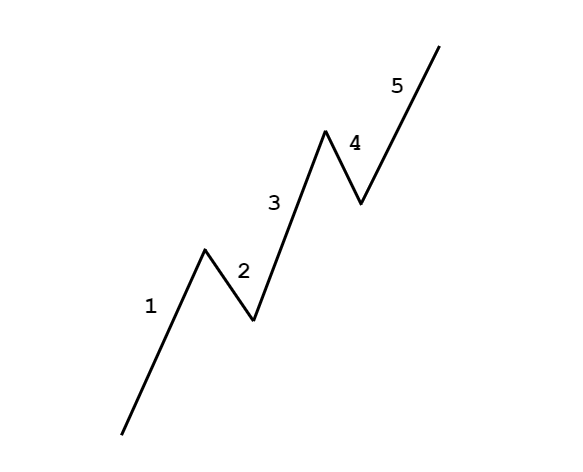
This is the impulsive wave that is formed in all types of instruments. It claimed that this wave patterns form not only in stocks but on currencies, bonds, gold, oil, etc. as well. Now, let’s interpret each wave in the impulsive wave pattern.

🌊 Wave 1 – This is the first up move in the market. This is typically caused by a handful number of people who think that the currency is at a discounted rate and is the right time to buy.

🌊 Wave 2 – This move is against the previous move. There is a dip in the market as the initial buyers are booking profits, thinking it is now overvalued. However, it does not go down until the previous lows because it is also considered to be at a discount for other traders.

🌊 Wave 3 – Wave 3 resembles the wave 1. This wave is usually the longest and the strongest in terms of momentum. This is because, as the price goes higher and higher, the mass public begins to buy along with the institutional players. Hence, it is stronger than wave 1.

🌊 Wave 4 – After a strong up move (wave 3), some traders start to book profit, assuming the security has become expensive. However, this down-move is not quite strong because there are traders who still believe in the bullishness and hence see this as a discounted price.

🌊 Wave 5 – Wave 5 is when most people start to buy security. This is solely due to panic and is considered to a rat trap. Wave 5 is when the security has reached the news. All traders and investors on the news channels advice the public to buy.

But, in reality, this is when the security is considered to be overpriced. The big investors and institutions begin to short and square off their positions. And the liquidity for it is provided by the mass public.

All these waves together form the 5-wave impulsive pattern. We hope you were able to comprehend this concept of impulsive waves. If not, shoot your questions in the comment section below, and don’t forget to take the below quiz.

[wp_quiz id=”71436″]
Categories
Forex Harmonic

The 5-0 Harmonic Pattern

Harmonic Pattern Example: Bearish 5-0 Harmonic Pattern

The 5-0 Harmonic Pattern

Like the Shark Pattern, the 5-0 pattern is a relatively new pattern discovered by the great Scott Carney. Carney revealed this pattern in his second book in his harmonic series, Harmonic Trading: Volume Two.

The 5-0 pattern is easily one of the wonkiest looking patterns. Depending on where you are at with your knowledge of harmonic patterns, the 5-0 will look foreign. And this is primarily because the 5-0 Pattern starts a 0. If you are used to seeing XABCD,  then 0XABCD will undoubtedly look odd.

5-0 Elements

  1. The pattern begins (begins with 0) at the beginning of an extended price move (direct quote from Carney’s work).
  2. After 0 has been established, an impulse reversal at X, A, and B must possess a 113 – 161.8% extension.
  3. The projection off of AB has a 161.8% extension requirement to C. C can move beyond the 161.8% extension but not beyond 224%.
  4. D is the 50% retracement of BC and is equal to AB (a Reciprocal AB=CD Pattern).
  5. The reciprocal AB=CD is required.

One of the best ways to interpret this pattern is to view it from an exasperated trader’s point of view. If we take the Bullish 5-0 Pattern as an example, then we can see why. The AB leg ends with B below X, creating a lower low. We then get an extended move in time where the BC leg is the most prolonged move with C ending above A. The movement from B to C may take on the appearance of a bear flag or bearish pennant. C to D shows intense shorting pressure and a belief among bears that new lows are going to be found. Instead, we get to D – the 50% retracement of BC. Instead of new lower lows, we get a confirmation swing creating a higher low. That move will more than likely generate a brand new trend reversal or significant corrective move.


Sources: Carney, S. M. (2010). Harmonic trading. Upper Saddle River, NJ: Financial Times/Prentice Hall.  Gilmore, B. T. (2000). Geometry of markets. Greenville, SC: Traders Press.  Pesavento, L., & Jouflas, L. (2008). Trade what you see: how to profit from pattern recognition. Hoboken: Wiley.

Categories
Forex Harmonic

The Butterfly Pattern

Butterfly Harmonic Pattern Example: Bearish Butterfly

The Butterfly

The Butterfly pattern is a harmonic pattern discovered by Bryce Gilmore. Gilmore is the author of Geometry or Markets (now in its 4th Edition, initially published in 1987)– a must-read for those interested in harmonics patterns. He is the creator of his proprietary software called WaveTrader. The Butterfly is one of the most potent harmonic patterns because of the nature of where it shows up. Both Carney and Pesavento stress that this pattern typically shows the significant highs and significant lows of a trend. In fact, in utilizing multiple time frame analysis, it is not uncommon to see several Butterfly patterns show up in various timeframes all at the end of a trend (example: the end of a bull trend can show a bearish butterfly on a daily chart with a 4-hour and 1-hour chart showing a bearish butterfly ending at the same time). This pattern is an example of an extension pattern and is generally formed when a Gartley pattern (the Gartley Harmonic pattern) is invalidated by the CD wave moving beyond X. From a price action perspective, this is the kind of move where one would ‘assume’ a new high or low should be established, but extreme fear or greed takes over and causes prices to accelerate in both volume and price to end a trend.

Failure, Symmetry, and Thrust

Pesavento identified three crucial characteristics of the Butterfly pattern.

Thrust – C should be observed as an indicator of whether a Gartley or Butterfly pattern will form. He indicated specific Fibonacci levels that are important for gaps – but that is important for equity markets that are rife with gaps. That is not important for us in Forex markets (gaps in Forex are rare intra-week and typically form only on the Chicago Sunday open, Forex also has an extremely high degree of gaps filling). He noted that thrusts out of the CD wave point to a high probability of new 161.8% extensions rather than a 127.2% extension.


Symmetry – The slope of the AB and CD wave in the AB=CD should be observed strictly. Depending on how steep the angle is on the CD wave, this could indicate a Butterfly pattern is going to be formed. Pesavento also noted that the number of bars should be equal (10 bars in AB should also be 10 bars in CD). Regarding the steepness of the CD wave, this is where Gann can become instrumental. In my trading, and depending on the instrument and market, I utilize Gann’s various Squares (Square of 144, Square of 90, Square of 52, etc.). If you use a chart that is properly squared in price and time, there is very little ambiguity involved in identifying the speed of the slope of a CD wave.


Failure Signs – Very merely put, Pesavento called for close attention to any move that extends beyond the 161.8% XA expansion. And this is an excellent point because one of the most dangerous things we can do as traders is an attempt to put to much weight on a specific style of analysis. It’s easy to think, ‘well, the Butterfly pattern is strong, so if it completes that must be the high or low.’ That is a very foolish and dangerous assumption to make. When markets, even Forex, make new highs or lows in their respective trends, that is generally a sign of strength. So while the Butterfly pattern does indicate the end of a trend – common sense confirmation is still required. The Butterfly pattern should help confirm the end of a trend, not define it.


The Five Negations

Continuing on with the great work of Pesavento and Jouflas, they identified five conditions that would invalidate a Butterfly pattern:

  1. No AB=CD in the AD wave.
  2. A move beyond the 261.8% extension.
  3. B above X (sell) or B below X (buy).
  4. C above A or C Below A, respectively.
  5. D must extend beyond X.


Ideal Butterfly Pattern Conditions

Carney identified six ideal conditions for a Butterfly pattern. You will note that the combination of Pesavento and Jouflas’s work greatly compliments Carney’s.

  1. Precise 78.6% retracement of B from the XA wave. The 78.6% B retracement is required.
  2. BC must be at least 161.8%.
  3. AB=CD is required – the Alternate 127% AB=CD is the most common.
  4. 127% projection is the most critical number in the PRZ (Potential Reversal Zone).
  5. No 161.8% projection.
  6. C should be within its 38.2% to 88.6% Fibonacci retracement.

Sources: Carney, S. M. (2010). Harmonic trading. Upper Saddle River, NJ: Financial Times/Prentice Hall.  Gilmore, B. T. (2000). Geometry of markets. Greenville, SC: Traders Press.  Pesavento, L., & Jouflas, L. (2008). Trade what you see: how to profit from pattern recognition. Hoboken: Wiley.