Categories
Forex Education

The True Story Behind the Elliot Wave Theory

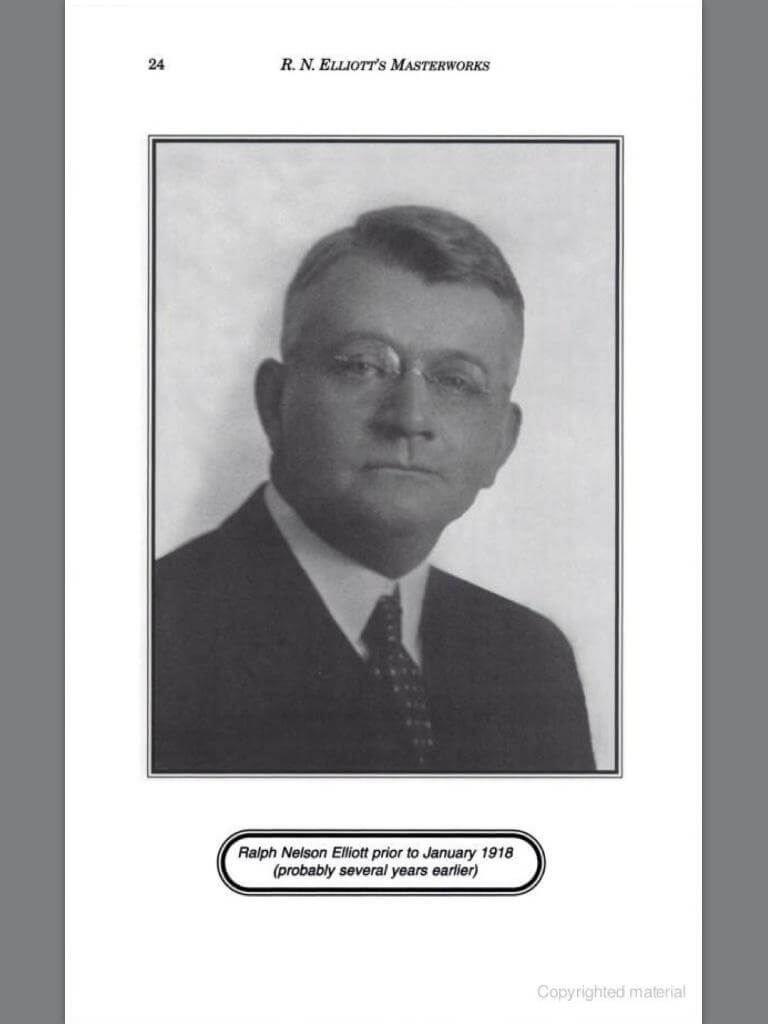
There are few technical analysis components that can credit a single person, but Elliott’s wave theory has that distinction. The founder of the theory is Ralph Nelson Elliott, who was born in Marysville, Kansas, in 1871 and then moved to San Antonio, (Texas state).

Elliott began his career as an economist in the middle of 1890. After holding executive positions in private companies and a successful consulting business, the United States State Department wanted Elliott to be the candidate for the post of Chief Accountant of Nicaragua (a country that was then under US control).

During his stay in Central America, Elliott contracted a debilitating illness, which forced him to retire early at the age of fifty-eight. Around this time, he decided to devote himself to the study of the American stock market.

When Elliott began his study of markets, it was generally believed that markets were chaotic and random. Elliott, after many studies, was convinced that there was some sort of underlying order in the way they moved and proposed that market prices develop into specific patterns and trends. This was considered a revolutionary idea at the time.

It began its study by studying more than 75 years of historical data from stock markets using annual, monthly, weekly, daily, hourly, and half-hour charts. Remember, this was in the 1930s before there was computing capacity available to help review graphs and keep records. All these analyses were done manually and to carry it out without help was an achievement in itself.

As his research progressed, he began to establish rules that he could apply. The greater his confidence, the more frequently he began to spread his ideas publicly. In March 1935, an ordinary day, he sent a telegram after the closing of the market indicating that the US stock market is coming to an end.
The next day, Thursday, March 14, 1935, the Dow Jones Industrial Average reached its lowest closing price for the whole year. In fact, the market began an increase which lasted nearly two years and doubled the value of the Dow. Elliott, using its own market rules that he himself had developed, had set the bottom of the market within a trading day.

What makes this most notorious was the moment in history that Elliott made the prediction. In 1935, the United States was in the midst of the Great Depression, and the idea that markets could grow seemed unthinkable.

A few months after predicting the decline in March 1935, Elliott wrote “The Elliott Principle” with Charles J. Collins. Collins himself received Elliott’s telegram on Wednesday afternoon, predicting the decline of the market.

With the book, Wave Theory Elliott was officially born.

After Elliott’s death in 1948, many renowned financiers continued to make predictions based on Elliott Wave’s studies. In the early 1970s, a novice analyst at Merrill Lynch, Robert Prechter, was impressed with Elliott’s work and introduced it to the public through his own books.

Prechter won the US Trade Championship in 1984 with Elliott Wave, with a yield of 444% in four months on a real-money options trading account. Prechter also successfully predicted America’s long-term bullish market that began in 1982 and the October 1987 crash. The CNBC in 1989 named him “Guru of the Decade”.

Today, Prechter is considered the world’s best known Elliott The Wave Analyst, and the book, called “The Beginning of the Elliott Wave”, is considered today as the modern Bible for understanding this topic.

There’s a lot of criticism of the Elliott Wave and Prechter himself has made the wrong predictions. That said, Elliott’s wave theory is considered an important part of the technical analysis and is part of the curriculum of the authorized market technician designation.

Categories
Forex Videos

Elliot Wave Education In Forex – Trading With Confidence!

Elliot Wave Theory


This video is an example of a wave counting case when the movement starts from a different level to the lowest point of the movement recorded in the price chart.

The following chart corresponds to the cross Euro Pound in its hourly timeframe.

Different techniques of technical analysis teach that the price should be analyzed from the lowest point to the highest level, or vice versa. However, in Elliott’s wave theory, an impulsive, or corrective movement, does not always start or end at the lowest level shown on the price chart.

In this example, we see that the price comes from a bearish movement, which ends with an aggressive fall. However, this did not end at level 0.82758, but ended at level 0.82767, from where we observed that the euro pound cross initiated an impulsive sequence in five waves, which developed an extended third wave, also shows the advance on a fourth wave which is longer in time than the second wave and this impulsive sequence ended on January 14, 2020.

Now we will see the internal structure of the extended third wave. Here we see the first wave, the second, third, fourth, fifth. The degree of the sequence would correspond to Subminuette in green.

Remember that both colors and grades are used for convenience for analysis purposes. Elliott, when he developed his wave theory, he never pointed out an obligation of a time range with a specific degree. The important thing in wave counting is the existing order in the analysis process.

We have already seen the third extended wave, now we see the principle of alternation between the corrective waves, from the graph we see that wave 2 is a simple correction and the fourth is a complex correction.

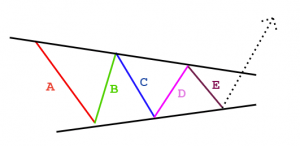
In the fourth wave, we see that its structure corresponds to a triangular formation, and we see its internal segments a, b, c, d, and e, and here we can observe the initiation of impulsive movement in 5 waves belonging to the fifth wave.

The start of the fifth wave is validated once the price breaks the b-d triangle guideline. Likewise, the upward movement of the fifth wave is considered finished after the low rupture of the upward guideline that joins waves 2 and 4.

This corrective sequence should correspond to a corrective process of a similar degree to this training that began on December 13, 2019. However, for the purposes of this analysis, we will only analyze the impulsive structure. 

Another detail that we must take into account in the impulsive structure is related to the extended third wave, which has a particularity that we can observe in this case. When the share price goes back beyond 38.2% of Fibonacci, the price warns us that the momentum bullish is running out, and it is very likely that the price will not exceed the previous maximum. In this case, we see that the price exceeded the maximum of wave 3 for only 4 pips reaching the level 0.85959.


Categories
Forex Course

109. Fractals – Elliot Waves within an Elliot Wave

Introduction

The 5-3 wave pattern is made up of the combination of 5-wave impulsive pattern and a 3-wave corrective pattern. The 5-wave pattern is inclined towards the predominant trend, while the 3-wave pattern is always against the trend. It is basically a pullback to the overall trend.

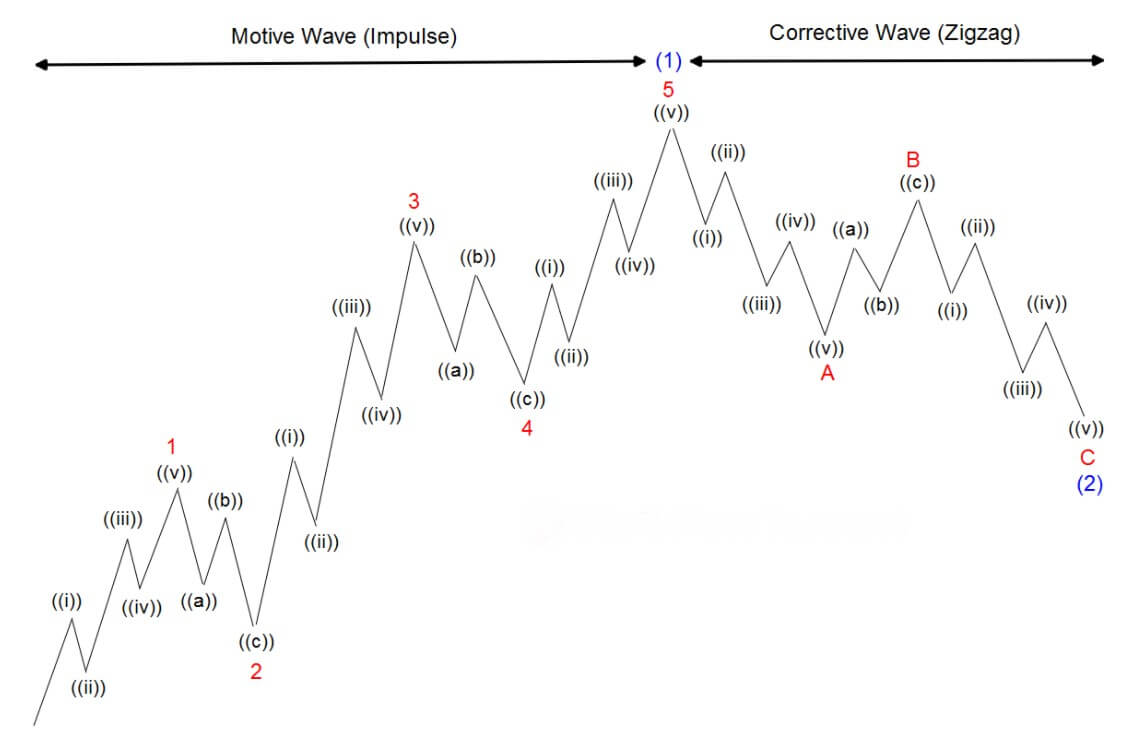
However, it does not end there. Within each wave in the impulsive and corrective waves, there is a set of other impulsive and corrective waves. And in that each smaller set of impulsive and corrective waves, there exists another miniature set of impulsive and corrective waves. This top-down approach goes on and on, forever.

The Top-down Approach

The Top-down approach can be considered as a synonym for fractals. In the Elliot wave theory, each wave is made of sub-waves and so on. In an uptrend, the 5-wave impulsive pattern faces upside. In these five waves, waves 1, 3, and 5 are towards the overall trend, while waves 2 and 4 against the trend.

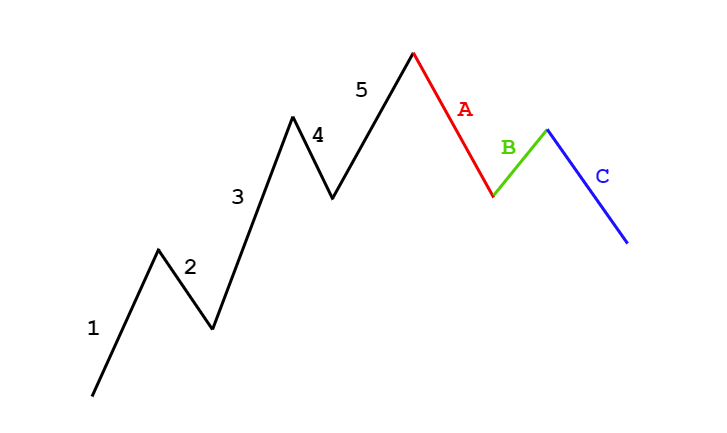
In the same uptrend, the corrective wave pattern faces against the trend, where waves A and C face against the trend (downwards), and wave B faces towards the trend (upwards). In this sequence, there are five waves towards the overall trend (with two minor pullbacks) and three against the trend (with one minor pullback).

According to the fractal theory, each push up and push down has the above sequence. For instance, if we extract wave 1 and wave 2, then wave 1 will be made up of a 5-wave impulsive pattern, and wave 2 will be made up of a 3-wave corrective pattern. In conclusion, the combination of two waves (1 and 2) results in a set of 5-3 wave pattern. Refer to the below figure to get a clear understanding.

The Ordering and Labelling of Elliot Waves

We know that every wave can be broken into smaller waves and so on. But referring to these waves becomes the challenging part. So, to make simplify the labeling of these waves, Elliot has assigned a series of categories to the waves in terms of its size (from largest to the smallest).

Conclusion

We saw that every Elliot wave is made up of another miniature Elliot wave, and this break-down goes forever. But, according to Elliot, the degree identification is not a necessary factor in Elliot wave analysis. As a trader, our goal is not to assign the right degree to the wave pattern but to just understand the timeframe in which it is occurring. In the end, all that matters is the basic analysis of the wave theory. The identification of degree always remains secondary. Cheers.

[wp_quiz id=”71844″]
Categories
Forex Course

108. What Are Corrective Waves & How To Comprehend Them?

Introduction

In the last lesson, we discussed the impulsive waves and 5-wave pattern corresponding to it. A trend is made up of the combination of the 5-wave pattern and the 3-wave pattern. The 5-wave impulsive pattern moves along the original trend, while the 3-wave corrective pattern moves against the trend. In this lesson, we shall discuss the corrective wave and then interpret the 5-3 waves.

Corrective waves

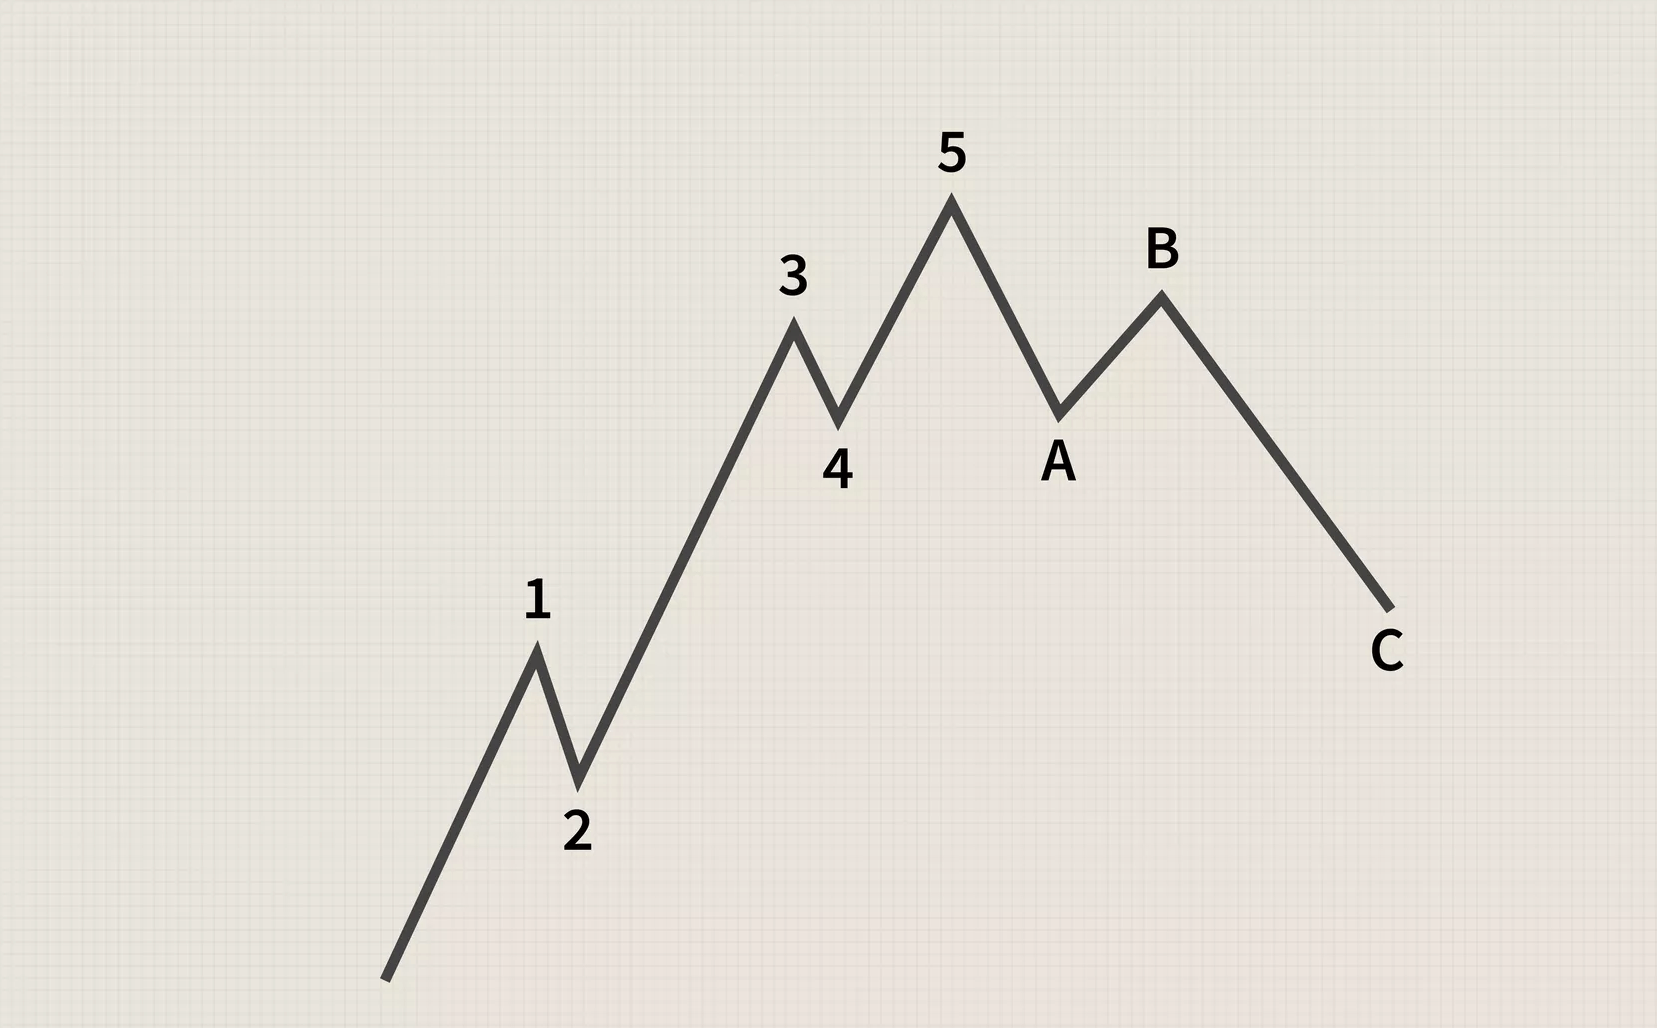
In case of an uptrend, the impulsive waves are towards the upside, and the corrective waves are towards the downside. Continuing with the example mentioned in the previous lesson, the corrective waves are represented in the below figure.

In the above figure, waves a, b, and c represent the corrective waves. The overall trend of the market is up, but corrective waves are against it. In other terms, the 3-wave corrective wave can be considered as pullback for the uptrend.

Note: The 3-wave corrective wave is also referred to as the ABC corrective wave pattern.

Reverse Corrective Wave Pattern

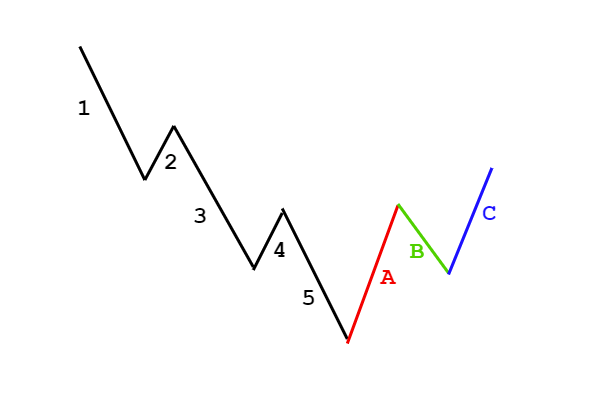
The Elliot wave theory is applicable to both uptrend and downtrend. So, for a downtrend, the impulsive wave faces downwards following the overall trend, while the corrective wave faces upwards. Below is a figure representing the 5-3 wave pattern for a downtrend.

Types of Corrective Wave Patterns

The above illustrated corrective wave is not the only type of corrective wave that occurs. According to Elliot, there are twenty-one 3-wave corrective wave patterns, where some are simple and some complex. However, a trader need not memorize all of them at once. The following are three simple corrective waves that are most occurring in the market.

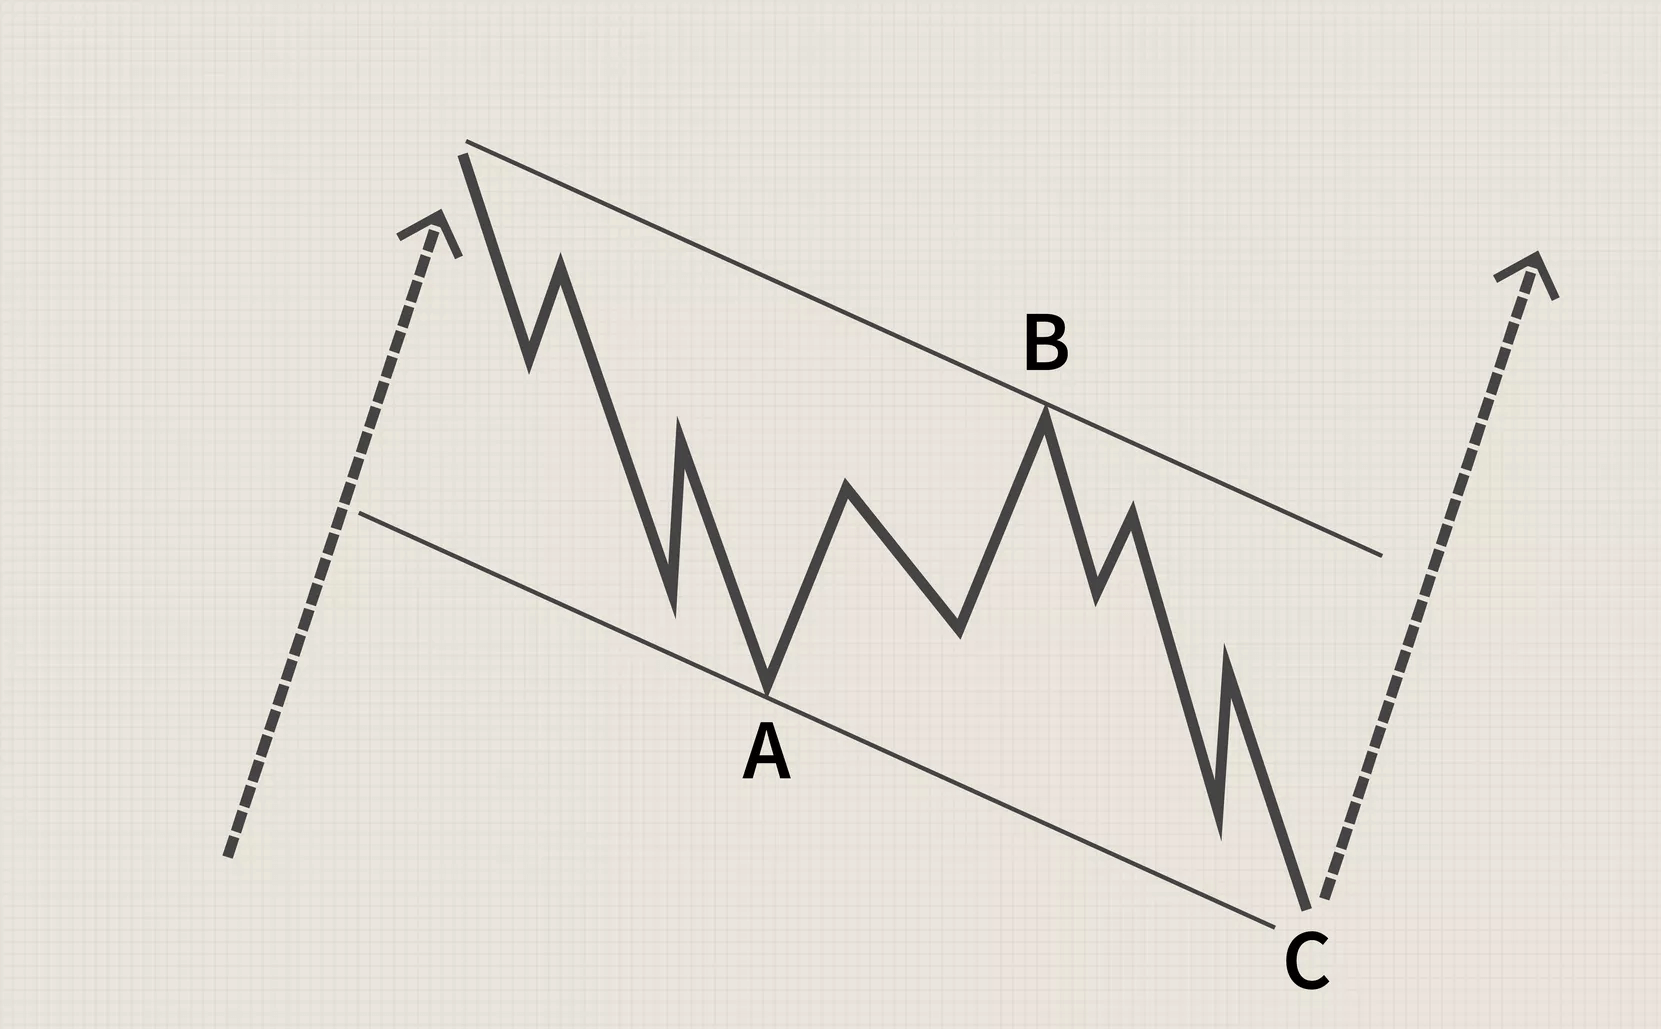
The Zig-Zag Formation

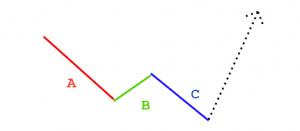
The zig-zag formations are very steep compared to the regular one and are against the predominant trend. In the three waves, typically, wave B is the shortest compared to wave A and wave C. Note that, the Zig-Zag pattern can happen twice or thrice. Also, the zig-zag patterns, like all other waves, can be broken into 5-wave patterns.

The Flat Formation

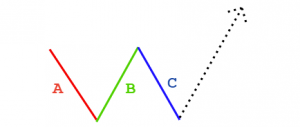
As the name suggests, in flat corrective wave patterns, the 3-wave pattern is in the sideways direction. That is, the wave C does not go below wave B, and wave B makes a high as much as wave A. Sometimes, the wave B goes higher than wave A which is acceptable as well.

The Triangle Formation

The Triangle formation is a little different from the other corrective patterns. The difference is that these patterns are made up of 5-waves that move against the overall trend. These corrective waves can be symmetrical, ascending, descending, or expanding.

These were some of the most used corrective patterns used by traders. These must be known to technical traders by default. In the next lesson, we shall discuss another important concept related to the Elliot Wave theory.

[wp_quiz id=”71613″]
Categories
Forex Course

107. Comprehending The Impulsive Waves In Elliot Wave Theory

Introduction

In the previous lesson, we got started with understanding the fundamentals of the Elliot Wave theory. An introduction to impulsive waves and corrective waves was also discussed. This lesson shall go over the concept of impulsive waves.

There are two types of waves in the Elliot theory, impulsive and corrective. And as a whole, Elliot stated that a trending markets move in 5-3 wave patterns. The 5-wave pattern corresponds to the impulsive wave, and a 3-wave pattern corresponds to the corrective wave. And the combination of the 5-wave and 3-wave patterns form a trend.

Formation of Impulsive Wave

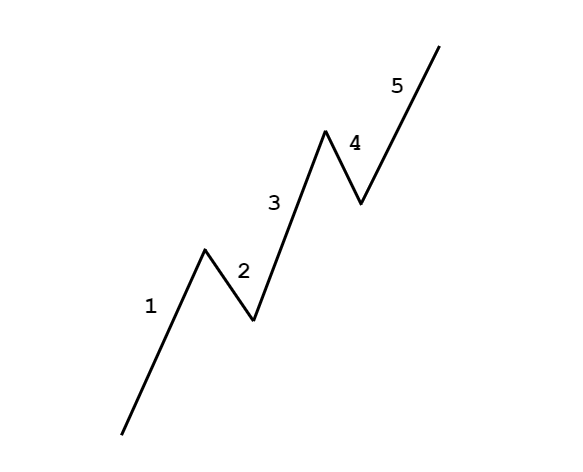
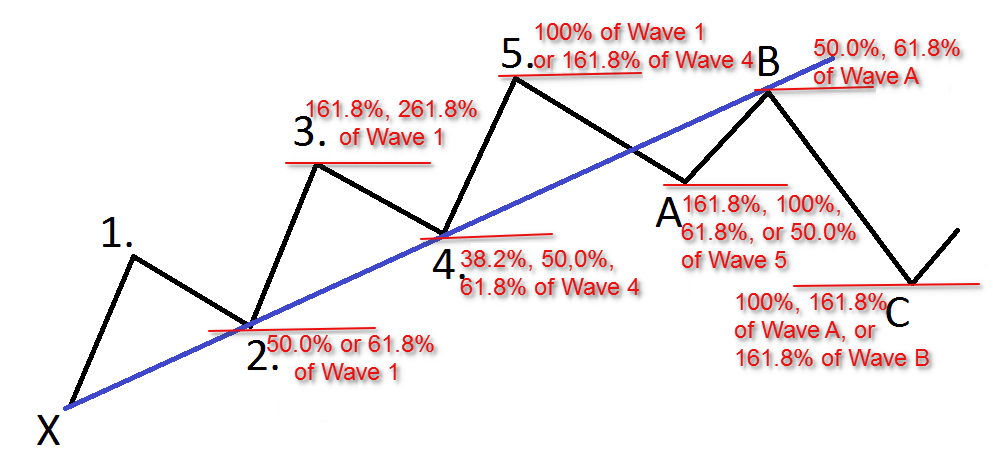
The impulsive waves are formed by five waves numbered from 1 through 5. Wave numbers 1, 3, and 5 are motive, i.e., they are the waves that go along the overall trend, while wave numbers 2 and 4 are corrective waves that go against the overall trend. Below is a diagram that represents the 5-wave impulsive pattern.

This is the impulsive wave that is formed in all types of instruments. It claimed that this wave patterns form not only in stocks but on currencies, bonds, gold, oil, etc. as well. Now, let’s interpret each wave in the impulsive wave pattern.

🌊 Wave 1 – This is the first up move in the market. This is typically caused by a handful number of people who think that the currency is at a discounted rate and is the right time to buy.

🌊 Wave 2 – This move is against the previous move. There is a dip in the market as the initial buyers are booking profits, thinking it is now overvalued. However, it does not go down until the previous lows because it is also considered to be at a discount for other traders.

🌊 Wave 3 – Wave 3 resembles the wave 1. This wave is usually the longest and the strongest in terms of momentum. This is because, as the price goes higher and higher, the mass public begins to buy along with the institutional players. Hence, it is stronger than wave 1.

🌊 Wave 4 – After a strong up move (wave 3), some traders start to book profit, assuming the security has become expensive. However, this down-move is not quite strong because there are traders who still believe in the bullishness and hence see this as a discounted price.

🌊 Wave 5 – Wave 5 is when most people start to buy security. This is solely due to panic and is considered to a rat trap. Wave 5 is when the security has reached the news. All traders and investors on the news channels advice the public to buy.

But, in reality, this is when the security is considered to be overpriced. The big investors and institutions begin to short and square off their positions. And the liquidity for it is provided by the mass public.

All these waves together form the 5-wave impulsive pattern. We hope you were able to comprehend this concept of impulsive waves. If not, shoot your questions in the comment section below, and don’t forget to take the below quiz.

[wp_quiz id=”71436″]
Categories
Crypto Videos

How To Profit Trading Crypto With Elliot Wave Part 1


Elliot waves Crypto trading guide – part ½

The theory behind the Elliott wave principle is based around the price movements, which typically do not move in a straight line, but rather in a series of waves. Every action has an equal and opposite reaction, which is the case both in life and in any financial market (including cryptocurrencies). When the price goes up, a contrary downward movement will follow eventually.

Price action in any financial marketplace is often divided into separate trends as well as corrections. Price going up or down will showcase the direction of a trend, while the corrections will move against the trend. Ralph Nelson Elliott was the man that first discovered the repeating patterns that are better-known as impulsive and corrective waves. He noticed that these trend-following impulsive waves tend to respond in five waves. Even on a smaller scale, these impulsive waves can continue to repeat themselves inside the larger Elliott wave. This “waves within waves” theory is labeled as “wave degrees.”

Elliot waves – explained

Human social nature shows repetitive patterns due to the manner of human psychology, which is completely predictive. As mentioned above, Elliot waves have two different phases: the trend and corrective phases. The first phase forms three advancing waves of 1, 3, and 5. The corrective waves are comprised of 2 and 4.
During the corrective phase, two receding ways labeled A and C will almost always be present, as well as a counter wave labeled B.
The rules behind the trend waves are:
Wave 2 will never move below the starting point of wave 1. Wave 3 is never the shortest wave
Waves 2 and 4 might sometimes alternate in form, meaning that they will sometimes be presenting themselves in a zigzag or flat motion.
One of the trend waves will be much longer than the other two waves. The third wave will almost always be the longest out of the three.

Rules for the corrective waves are:

Wave B ends at or below the starting point of Wave A. Wave C ends below Wave A
In the crypto market, corrective waves often claim more than 60% of the all-time high price (which is at the top of the 5th wave)
Once we know what Elliot waves are and how to read them, we can move to the trading strategies. Check out part 2 of our Elliot wave crypto trading guide to learn more.