Categories
Forex Course

112. Summary – Elliot Wave Theory

Introduction

Over the last six lessons, we discussed the Elliot Wave Theory from understanding the basics of applying it in the financial markets. In this article, we shall have a quick summary of the previous learnings.

The Elliot wave theory was discovered by a professional accountant named Ralph Nelson, who claimed that markets don’t move in random directions, but recurring swings called waves. Most importantly, Elliott stated that the waves are fractals. That is, each swing or wave in the market can be broken into smaller and smaller waves of the same type.

The market moves in the 5-3 Elliot pattern. This pattern is appliable on uptrend and downtrend. Also, it occurs in every timeframe.
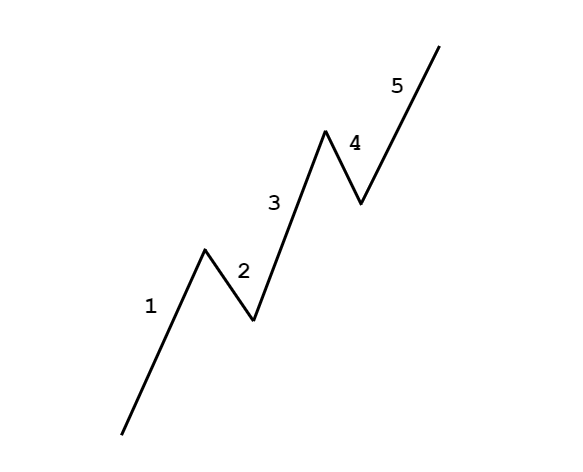
Impulse Waves

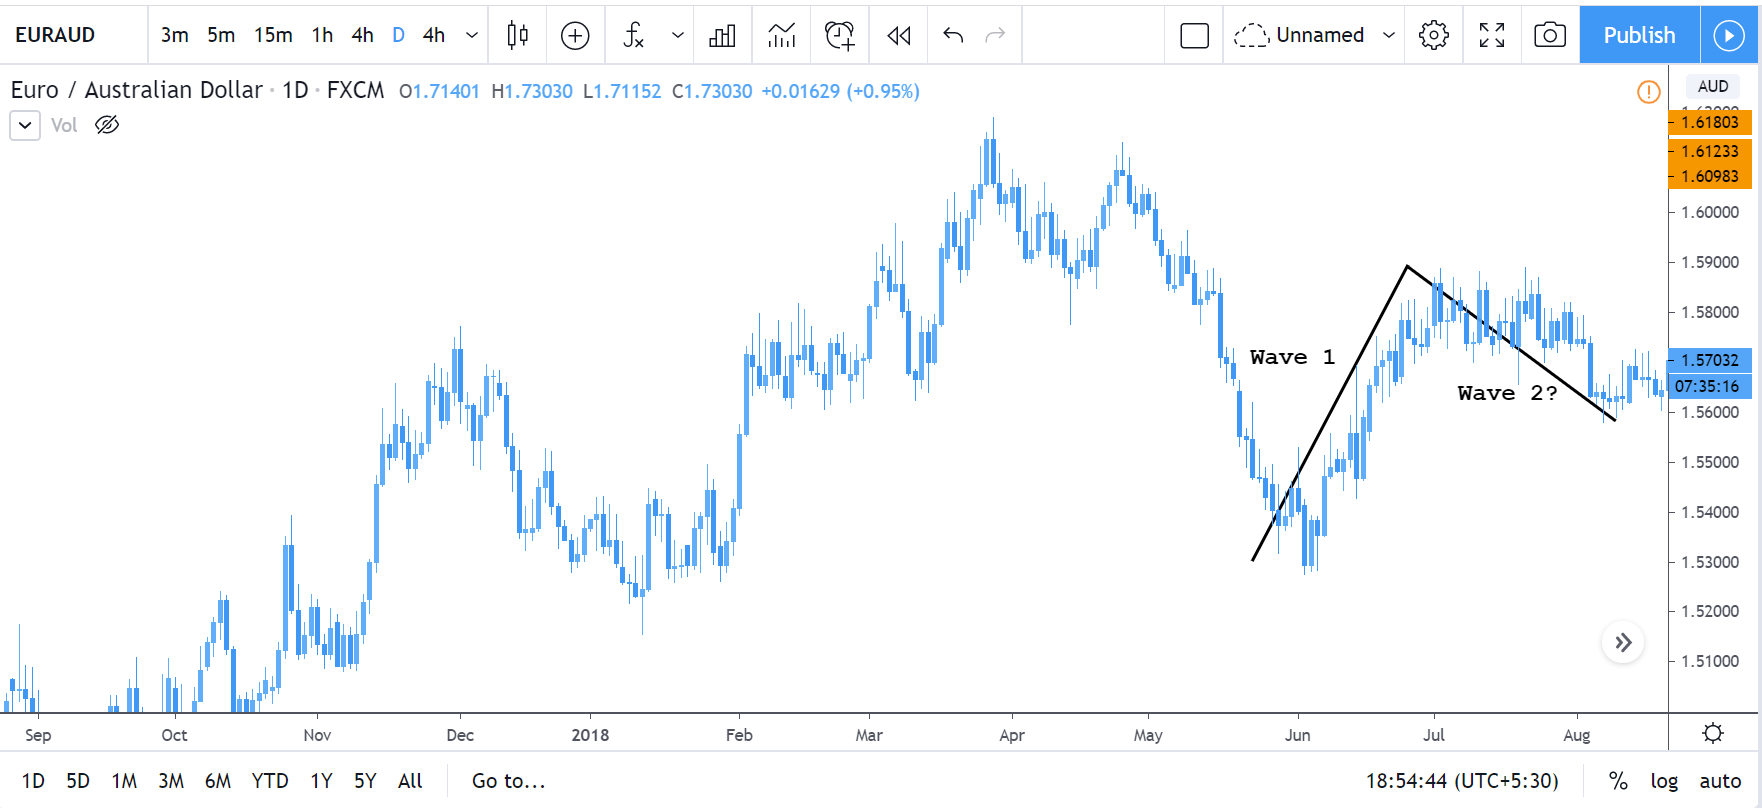
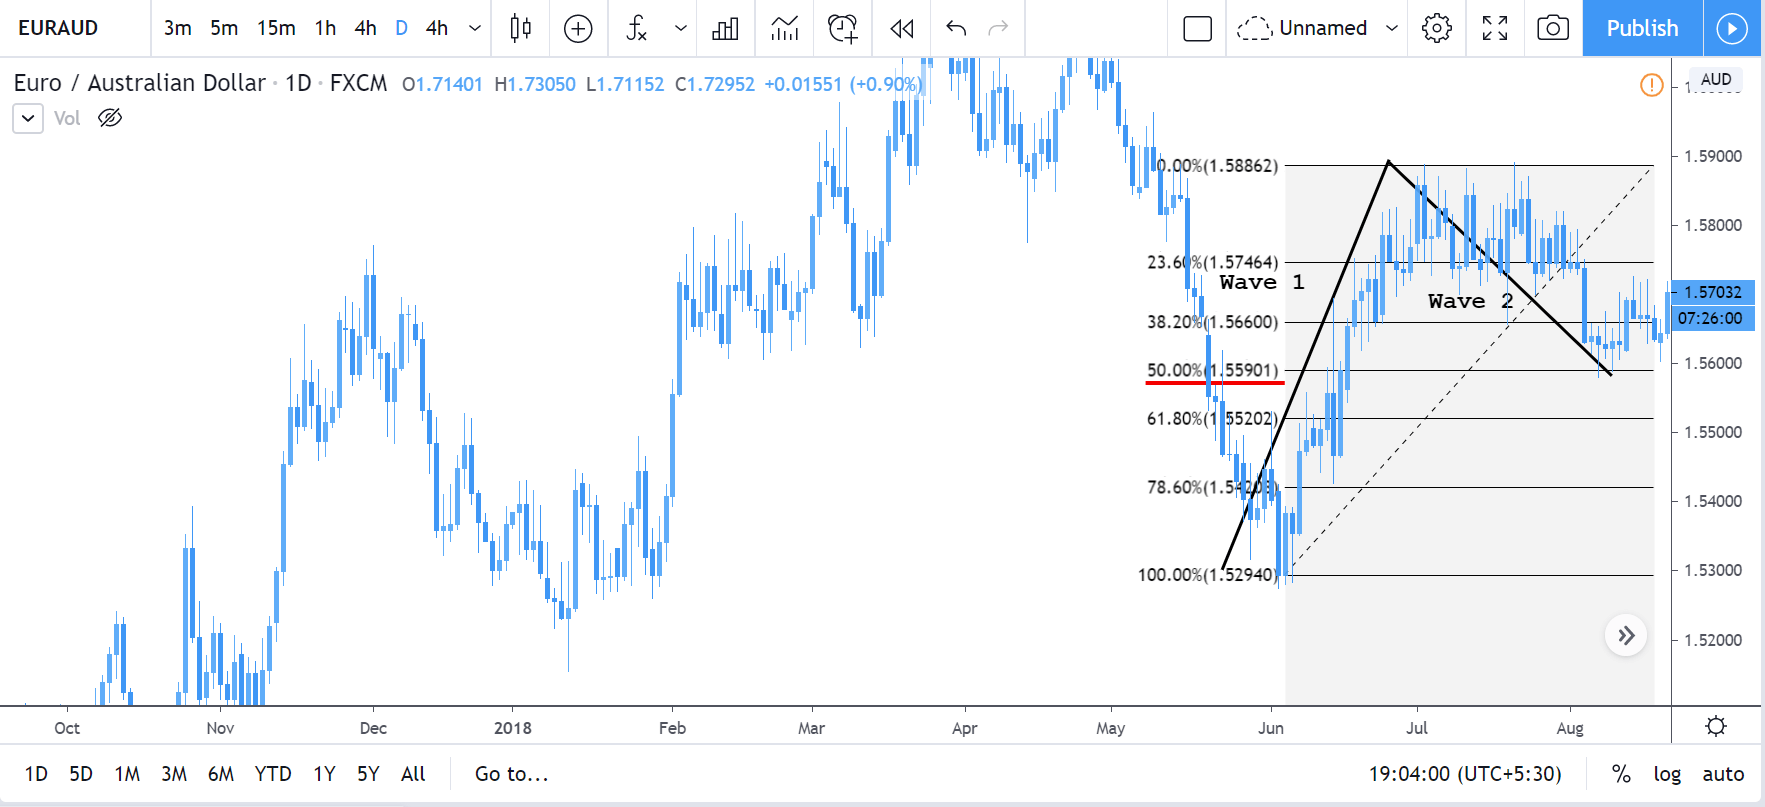
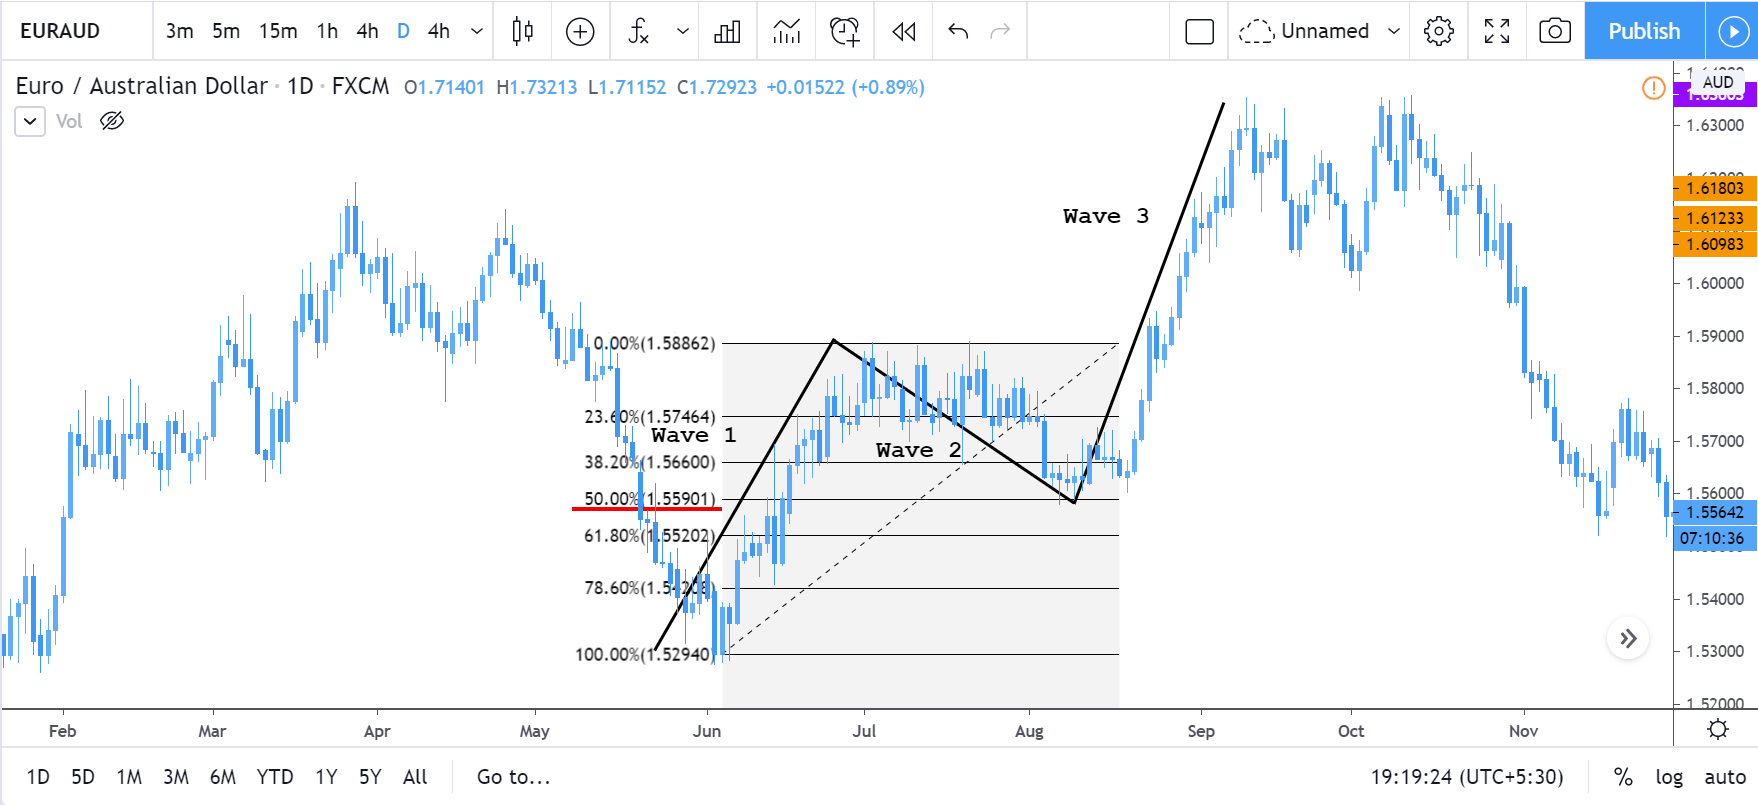
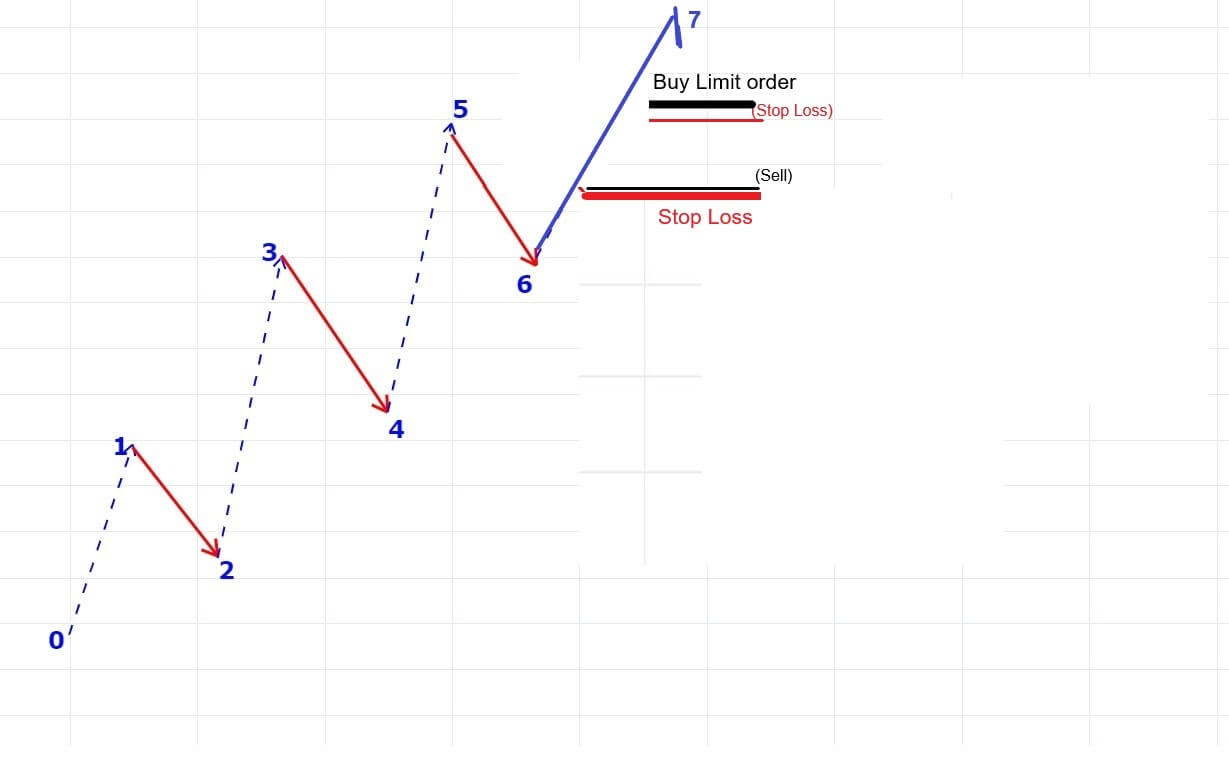
In the 5-3 wave pattern, 5 refers to the impulse waves. The 5-wave pattern is a trending wave pattern that moves along the overall trend. It is made up of 5 waves where Wave 1, 3, and 5 are impulse waves towards the trend, while waves 2 and 4 are retracements to the impulse waves. Out of the three impulse waves, wave 3 is usually the strongest and the longest and is ideal for trading.

  • Wave 1 is where only a small number of people take positions.
  • Wave 2 is where the institutional traders and some smart retail traders enter.
  • Wave 3 is where the mass public enter, while smart & professional traders exit their positions.
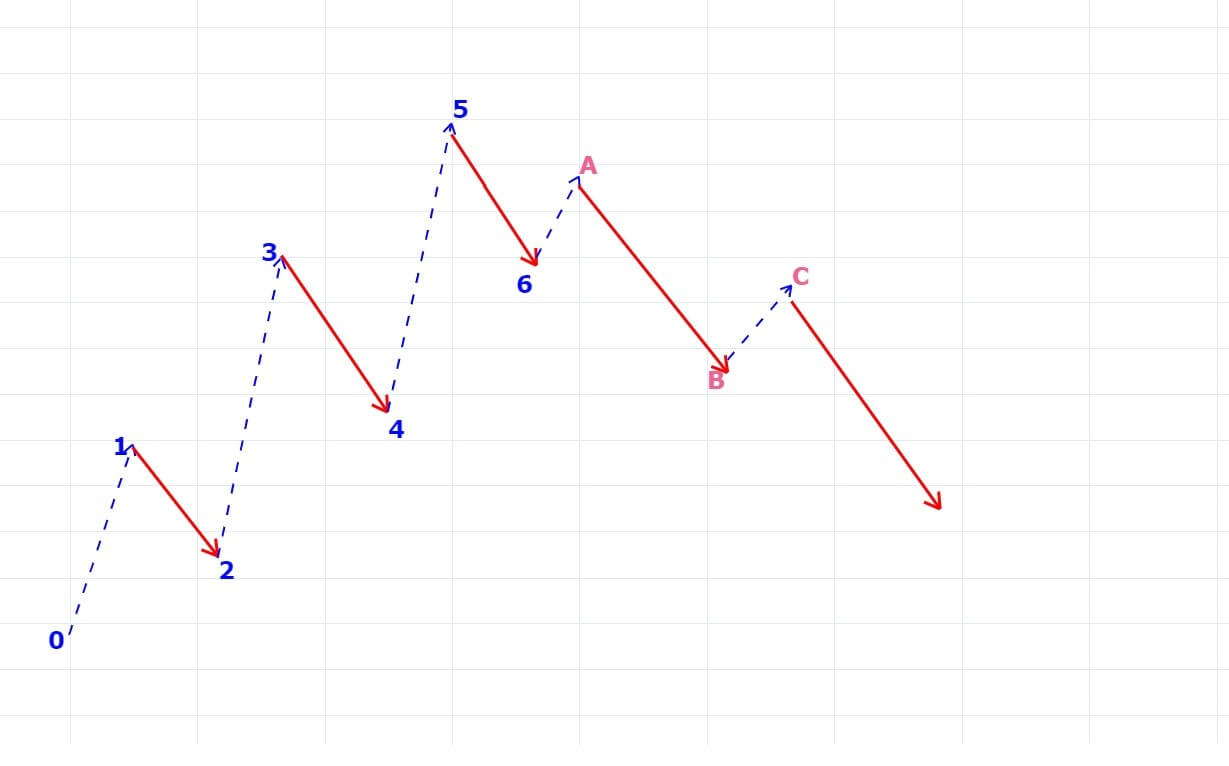
Corrective Waves

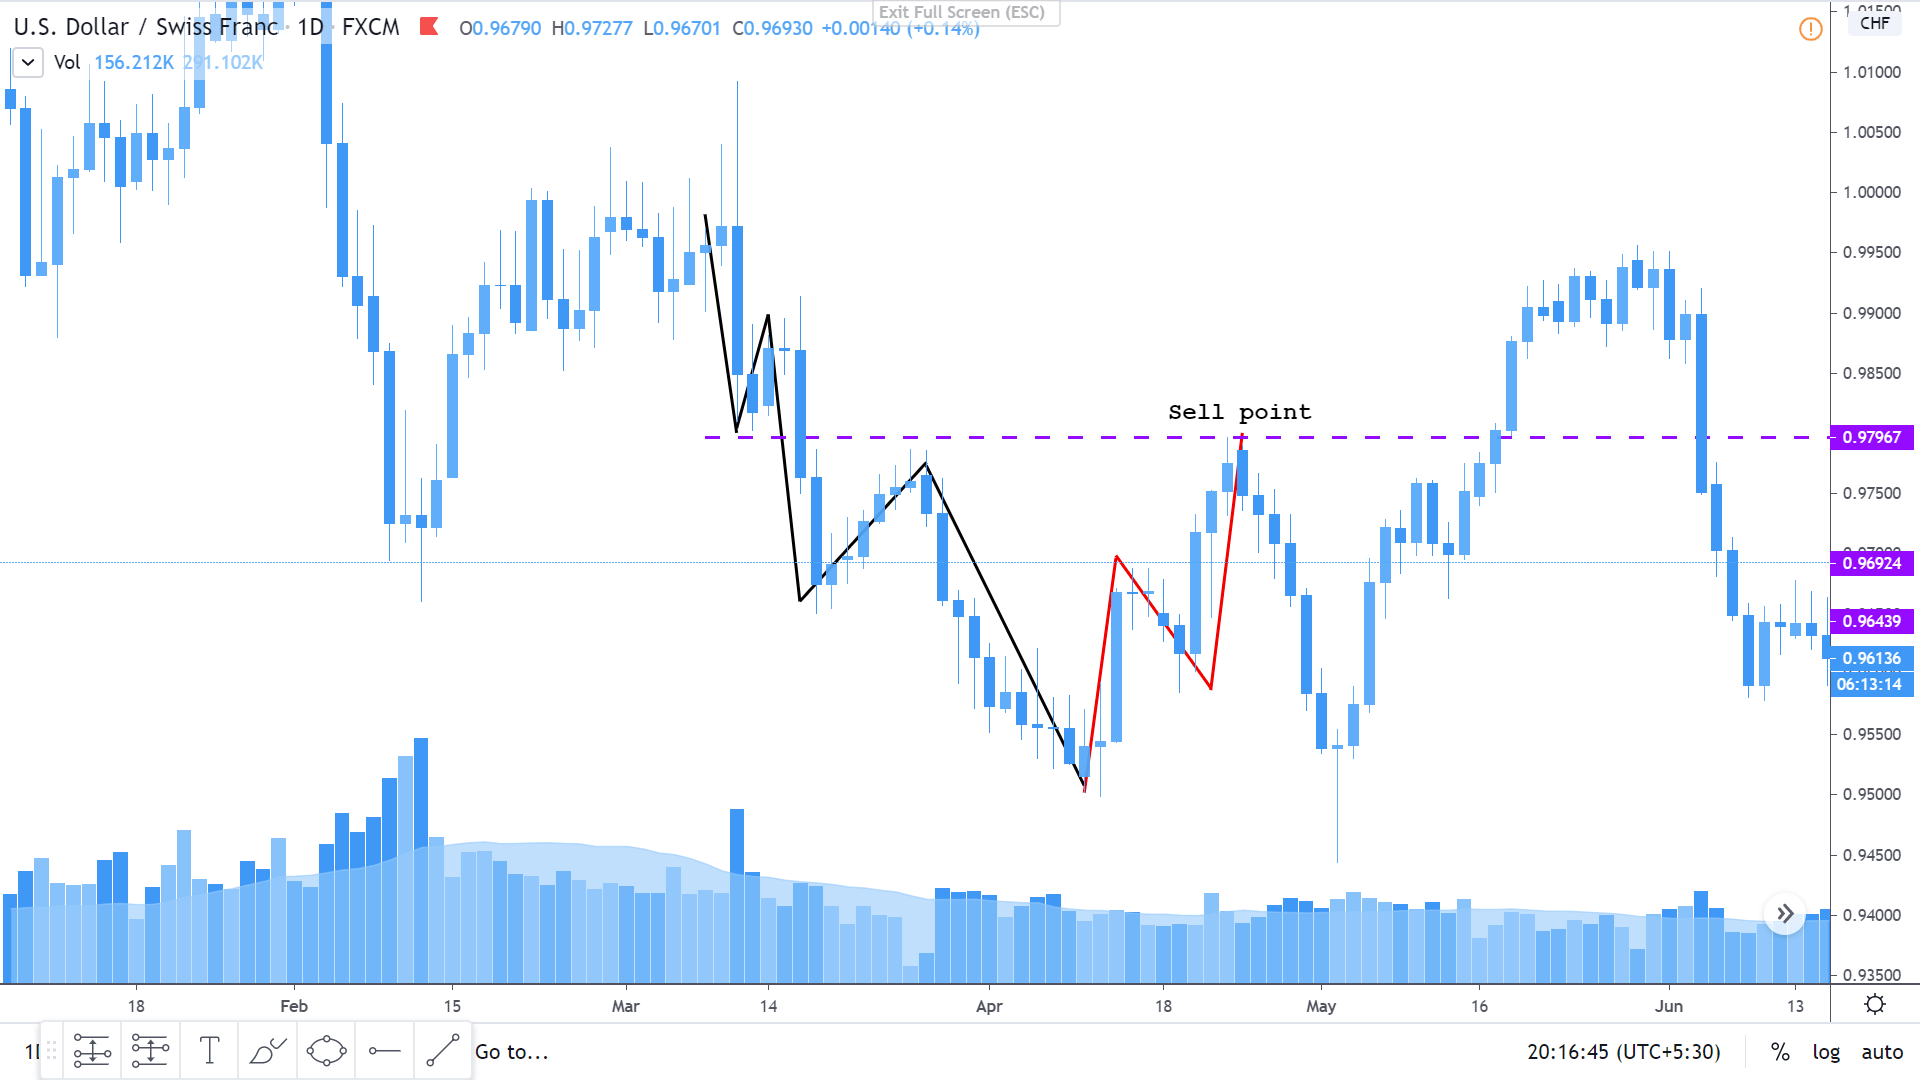
For every trending market, there is a pullback. And this retracement corresponds to corrective waves. The corrective waves are a 3-wave pattern that moves against the overall trend. It is denoted as wave ABC or abc, depending on the timeframe. The first corrective wave begins after the end of the impulse wave. Note that, the corrective wave pattern should not go beyond the area of wave 1 impulse wave. If it does happen, the waves must be counted from the beginning.

There are 21 types of corrective patterns based on their design. The three basic ones include

  • The Zig-Zag Formation
  • The Flat Formation
  • The Triangle Formation

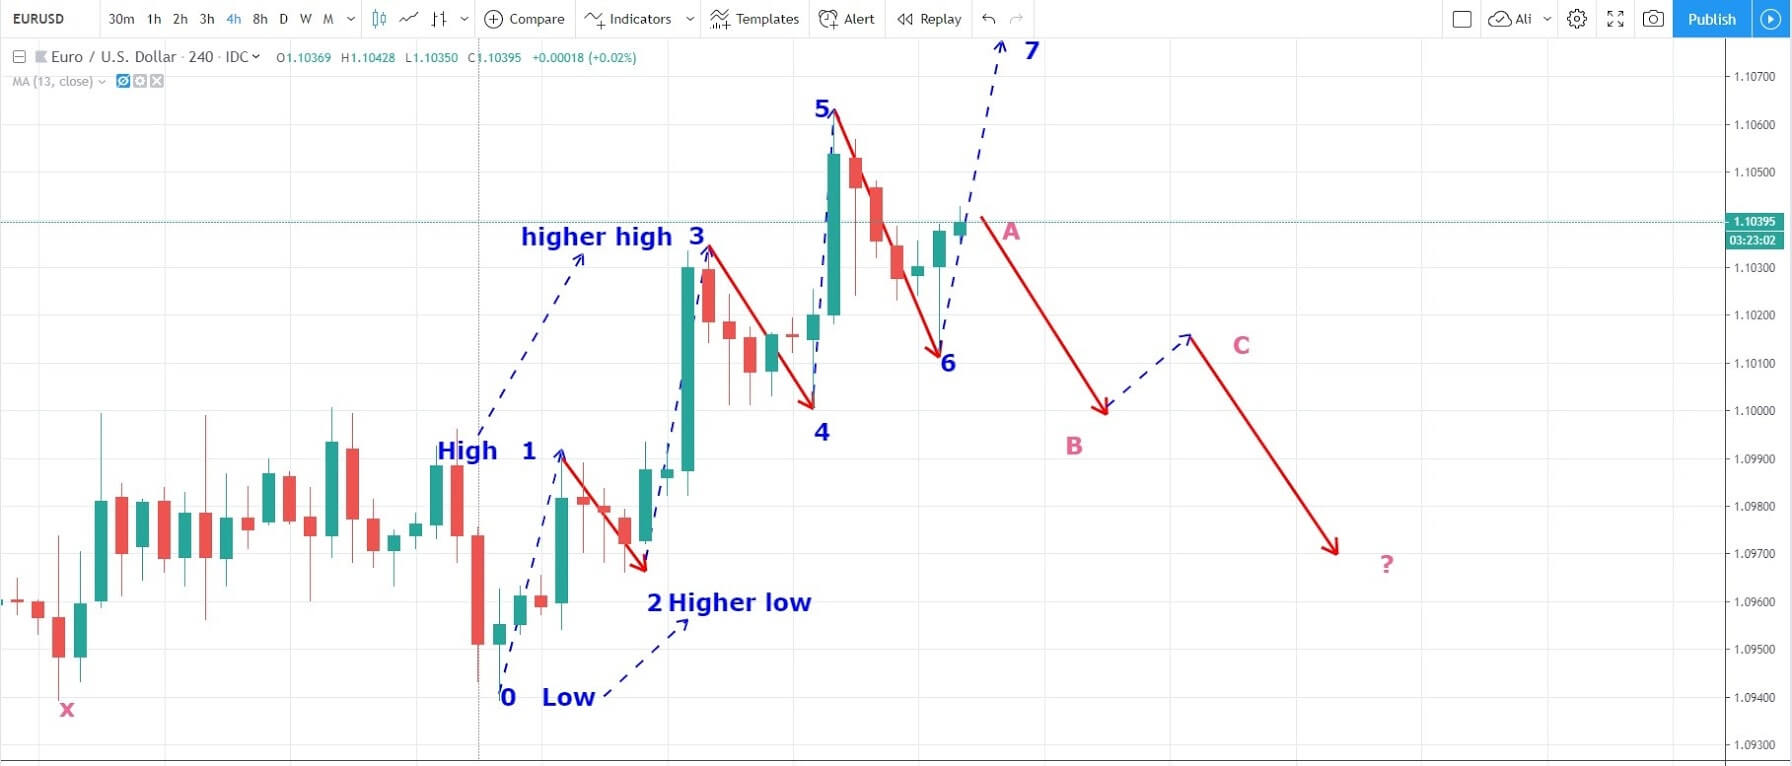
Rules in Elliot Wave Theory

There are three rules in the Elliot wave pattern to confirm the legitimacy of the pattern. The strategies will hold true only if the following strategies are satisfied.

  • Rule 1: Wave 3 must never be the shortest impulse wave.
  • Rule 2: The Wave 2 must hold above Wave 1.
  • Rule 3: Wave 4 must never cross in the price area of Wave 1.

Even if one of the rules is not satisfied, waves must be recounted from the start.

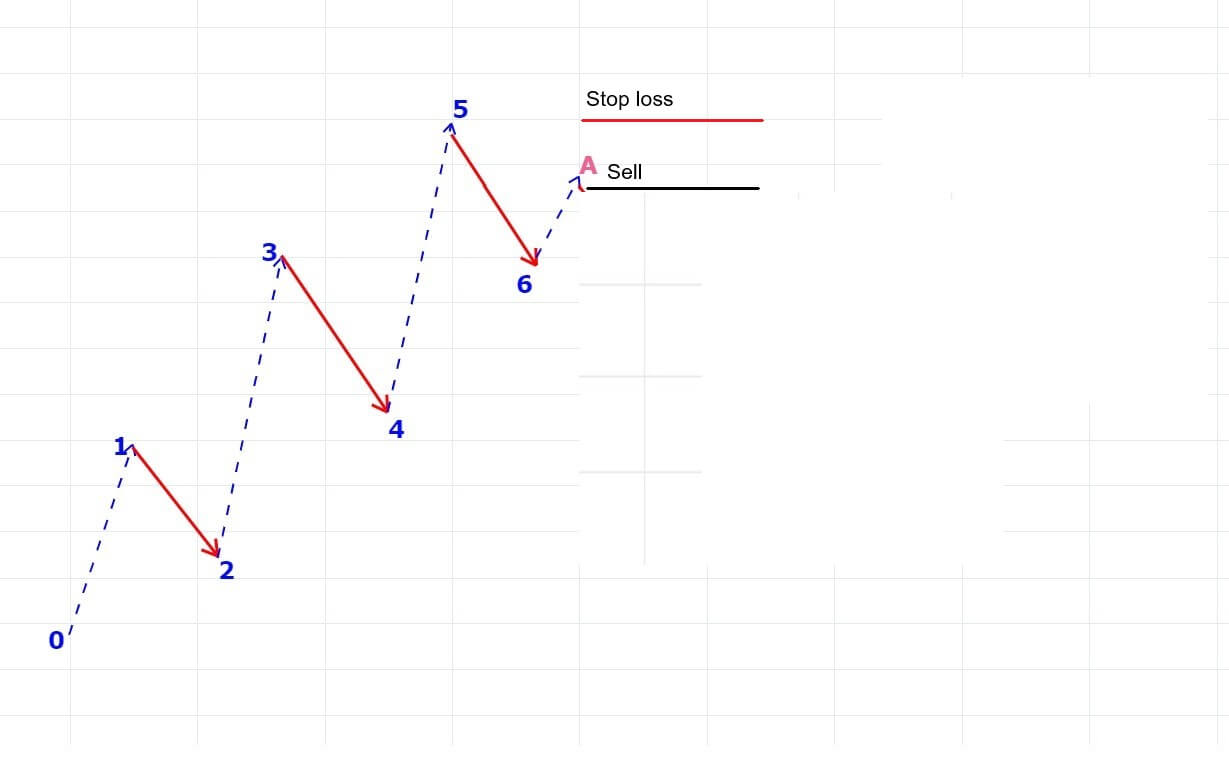
We have also discussed different ways of trading the Forex market using the Elliot wave theory, and that lesson can be found here.

Final words

The Elliot Waves are a great tool in determining the direction of the market. One can get a clear understanding of if the market is trending or retracing. Accordingly, one can take a trading decision by adding other tools which will help in precise entries.

We hope you found the Elliot Wave theory course informative and useful. Do try this out for yourselves as well. Happy trading!

Categories
Forex Course

111. Trading Forex Market Using Elliot Wave Theory

Introduction

In all the previous lessons, we understood the terminology and interpretation of the popular Elliot Wave theory. Now we are well-versed with the subject to apply it to the forex market.

The Elliot Wave Theory is a wide concept and can be traded in several different ways. In this lesson, we shall analyze the forex currency pairs using Elliot wave concepts by combining it with some price action.

The best way to trade the Elliot waves

We know that according to the Elliot wave theory, there are two types of waves. There is an impulsive wave pattern made of 5 waves, and a corrective wave made of 3 waves. The impulsive wave is towards the trend, while the corrective wave is basically a pullback for the overall trend.

As a trader, we need to look for trades that payout well along with less risk. So, it is not ideal to trade all the impulsive waves and corrective waves.

Trade setup 1

The setup is to trade the impulsive waves. In the 5-wave impulsive pattern, three waves are along with the trend and two against it. Out of those three impulse waves, the ideal wave to catch is Wave 2. This is because, the Wave 2 is usually the strongest out of the three impulse waves, which significantly reduces the risk on the trade.

Trade Example

After the market makes the first wave, the price starts to pullback. But while the market is retracing, we won’t know where the market will hold and complete its second wave. So, we make use of other tools to determine where the market will resume its trend.

Consider the below price chart. As represented, the market made its first wave. Then, wave 2 began, where the market started to retrace. But, note that, at this point in point, we cannot confirm the end of wave 2. So, to determine the completion of wave 2, we shall be applying the Fibonacci retracement.

In the below chart, the fib retracement has been applied. We can see that the market began to hold at the 50% level. This hence confirms that wave-2 leg has come to an end. Thus, we can prepare to go long in anticipation of wave 3.

In the following chart, we can clearly see that the market held at the 50% fib level and ended up making a higher high, i.e., wave 3.

Trade setup 2

This is the type of setup where we consider the complete 5-3 wave pattern. In the below chart, the 5-wave impulsive pattern is represented with the black trend lines, while the 3-wave corrective pattern is represented by the red trend lines. Since in an Elliot wave pattern, the high of the third corrective wave must be below low of the first wave in the impulsive wave pattern, we can trigger the sell at the area shown in the chart.

This hence concludes our discussion on the Elliot Wave theory. In the next lesson, we’ll summarize this topic for your better understanding and then pick another interesting course.

[wp_quiz id=”72249″]
Categories
Forex Course

110 – The Key Rules in the Elliot Wave Theory

Introduction

The Elliot Wave theory is a subjective topic. The key to trading Elliot waves is to find and comprehend the waves correctly. By understanding the wave theory correctly, we will be able to figure out which side of the market we have to be on. For doing so, there are a few rules we can lay on the Elliot waves while confirming the legitimacy of a wave. They are based on waves in the 5-3 wave pattern. And most importantly, these rules must never be broken.

The Three Golden Rules of Elliot Wave Theory

Rule 1: Wave 2 must be above wave 1

Wave 1 is the impulse wave, which is towards the trend, while wave 2 is a smaller corrective wave against the trend. So, to hold the definition of an uptrend, the second wave must never go below the first wave. In other terms, there should be a higher low in the price.

Rule 2: Wave 3 must never be the shortest impulse wave

Wave 3 is the second push towards the overall trend. This wave represents the move where all big players buy into the market. Hence, this wave is the strongest and the longest. According to the rule, the wave 3 can be shorter than either wave 1 or wave 5, but not BOTH.

Rule 3: The Wave 4 must stay above the wave 1

Wave 4 is the second corrective wave in the 5-wave pattern. And this wave should never cross below the area of wave 1. In technical terms, the low of Wave 4 must be higher than the high of Wave 1.

This sums up the rules that need to be mandatorily followed while trading the Elliot Waves. So, even if one of the rules is not satisfied, then the Elliot wave pattern must be counted from the beginning, and the current must be discarded.

Guidelines for trading Elliot Waves

Now that you are clear about the rules, here are some guidelines for trading the Elliot waves. Note that these are guidelines and not rules. Hence, they are not a necessary condition to trade Elliot waves.

🌊 When Wave 5 is the longer impulse wave, then wave 5 can approximately be as lengthy wave 1.

🌊 It is useful in targeting the end of Wave 5. Traders also determine the length of the Wave 1 and add it with the low of Wave 4 and use it as a possible target.

🌊 Wave 2 and Wave 4 will usually be different forms. For instance, if Wave 2 was a sharp correction, then Wave 4 will be a flat correction and vice versa. With this, chartists can determine the time of correction of Wave 4

🌊 After a strong Wave 5 impulse wave advance, the 3-wave ABC correction pattern could come down only until the low of Wave 4.

These are the guidelines traders must understand and interpret in their own meaningful way. With this, we have come to the stage where we can apply the concepts and trade the Forex market. So, stay tuned for the next lesson.

[wp_quiz id=”71849″]
Categories
Forex Course

107. Comprehending The Impulsive Waves In Elliot Wave Theory

Introduction

In the previous lesson, we got started with understanding the fundamentals of the Elliot Wave theory. An introduction to impulsive waves and corrective waves was also discussed. This lesson shall go over the concept of impulsive waves.

There are two types of waves in the Elliot theory, impulsive and corrective. And as a whole, Elliot stated that a trending markets move in 5-3 wave patterns. The 5-wave pattern corresponds to the impulsive wave, and a 3-wave pattern corresponds to the corrective wave. And the combination of the 5-wave and 3-wave patterns form a trend.

Formation of Impulsive Wave

The impulsive waves are formed by five waves numbered from 1 through 5. Wave numbers 1, 3, and 5 are motive, i.e., they are the waves that go along the overall trend, while wave numbers 2 and 4 are corrective waves that go against the overall trend. Below is a diagram that represents the 5-wave impulsive pattern.

This is the impulsive wave that is formed in all types of instruments. It claimed that this wave patterns form not only in stocks but on currencies, bonds, gold, oil, etc. as well. Now, let’s interpret each wave in the impulsive wave pattern.

🌊 Wave 1 – This is the first up move in the market. This is typically caused by a handful number of people who think that the currency is at a discounted rate and is the right time to buy.

🌊 Wave 2 – This move is against the previous move. There is a dip in the market as the initial buyers are booking profits, thinking it is now overvalued. However, it does not go down until the previous lows because it is also considered to be at a discount for other traders.

🌊 Wave 3 – Wave 3 resembles the wave 1. This wave is usually the longest and the strongest in terms of momentum. This is because, as the price goes higher and higher, the mass public begins to buy along with the institutional players. Hence, it is stronger than wave 1.

🌊 Wave 4 – After a strong up move (wave 3), some traders start to book profit, assuming the security has become expensive. However, this down-move is not quite strong because there are traders who still believe in the bullishness and hence see this as a discounted price.

🌊 Wave 5 – Wave 5 is when most people start to buy security. This is solely due to panic and is considered to a rat trap. Wave 5 is when the security has reached the news. All traders and investors on the news channels advice the public to buy.

But, in reality, this is when the security is considered to be overpriced. The big investors and institutions begin to short and square off their positions. And the liquidity for it is provided by the mass public.

All these waves together form the 5-wave impulsive pattern. We hope you were able to comprehend this concept of impulsive waves. If not, shoot your questions in the comment section below, and don’t forget to take the below quiz.

[wp_quiz id=”71436″]
Categories
Forex Videos

Forex Hedging Using The Elliot Wave Setup – How To Win Trades Whatever The Outcome!

Hedging using the Elliot Wave setup

Continuing with our hedging strategy series. Today we are going to look at setting up two trades. One Which involves using the Elliott wave Theory of technical analysis, and should this prove ineffective, we will also be setting up a secondary hedging, or insurance based trade, in the event that our first trade does not go according to technical analysis.

While hedging comes in many forms and strategies, the methodology behind this type of hedging is that we want to carefully set up a trade based on tried-and-tested technical analysis, and where, in this particular case, price action may be set for a sharp reversal, but turns unexpectedly, in which case we will be able to catch the move in the opposite direction. In which case theoretically we win no matter which way price moves. Therefore this strategy works best when markets have consolidated or reached highs or lows, which seem right for reversal or continuation in price action but where the consolidation squeeze should cause a burst in volume in either direction.

Example A


Example A, Let’s quickly remind ourselves of the theory of the Elliott Wave, which consists of an impulse wave that is usually composed of 5 sub-waves that move in the same direction followed by a corrective wave composed of three subways that move against the previous trend.

Example B


Example B, Here we can see the Elliot wave in action. After a consolidation period, we can see the Elliott wave as denoted by 1 2 3 4 5 6 pattern, with higher highs and higher lows and where we would expect price action to begin to fade with our three-part full pull back as denoted by the A B C technical pattern we have drawn as an estimation onto our chart.
Therefore, if the Elliot Wave theory holds true in this case at position A, we would see a decent in price action in line with our A B C expectation, and if not, we would expect a price action continuation up to position 7 in continuation of the original upward trend.

Example D


Example D, This is the first part of our hedging strategy in which case we are going to go shorts at position A, which represents her 50% pullback between position 6 and 5, and at which point should be the beginning of the three-wave counter move in the opposite direction of the trend upwards should the Elliott wave Theory hold at this point we will capture some decent down movement, especially if this setup is used on a 15 in 30 or 60 minutes chart.
We must set our stop loss at a couple of pips above position 5, which would mean that the Elliott wave theory has not held out on this occasion, and that price could be set in a continuation upwards of the original trend. However, should position 5 on your chart be a round number and what is also called a big figure number such as 1.3400 which you might see in the USDCAD pair, or 1.300 in the EURUSD pair at the time of writing, then price action might find this as a level of resistance and fall anyway. But as the theory would be negated, we would suggest you consider this and think about exiting the trade and waiting for another Elliot Wave set up. In either case, stop losses should not be more than 20-30 pips.

Example E


Example E is our hedging strategy. In the events that the Elliott wave fails and price action continuous, we must set a buy limit order a couple of pips above the previous trade’s stop loss in order to capture the move from position 6 to position 7 and beyond. If possible, we should monitor this move closely, because as an insurance policy, we need to at the very least make the same amount of pips.i.e. 20 to 30 that we lost in the first trade.