Categories
Crypto Videos

Fractals In Crypto Trading – Add This Tool To Make Solid Gains!

Cryptocurrency Fractal Trading Guide

Bullish and Bearish Fractals

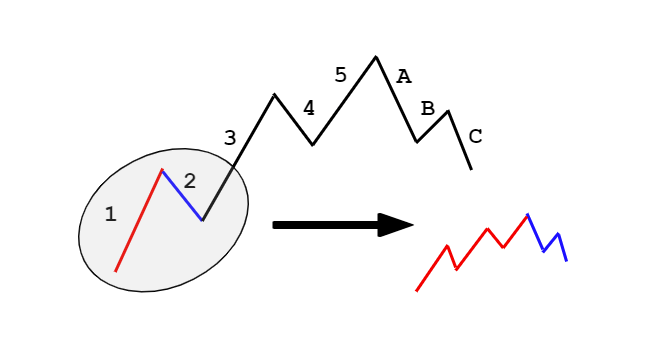
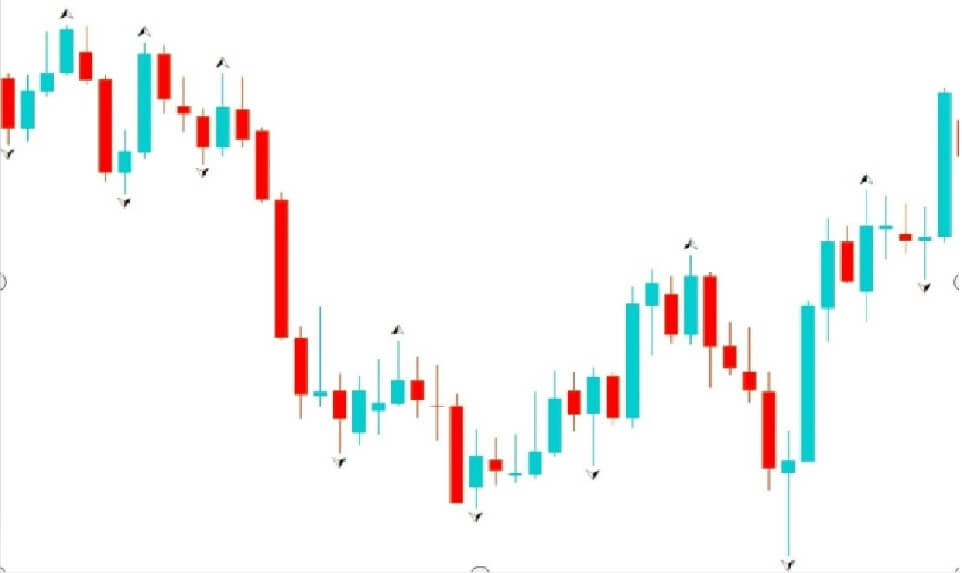
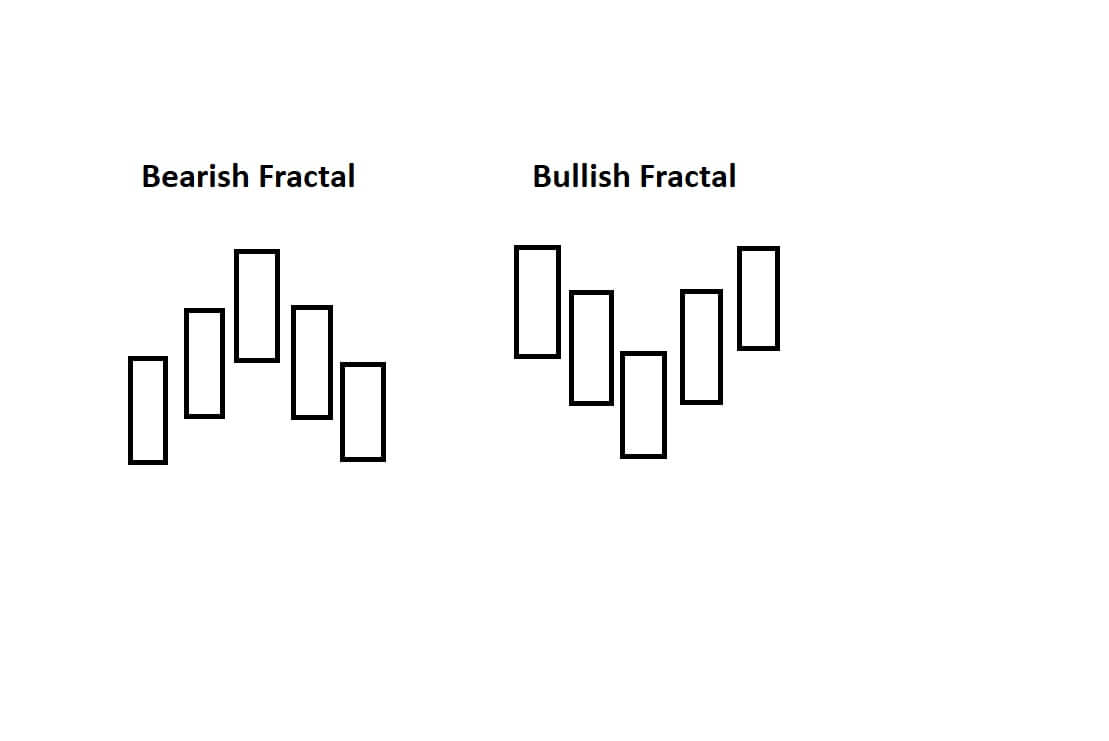
A fractal is a recurring pattern that occurs in larger price moves in technical analysis. In this case, it is a five candle trend reversal pattern, and there are bullish and bearish fractal versions. A bullish fractal reversal pattern has:

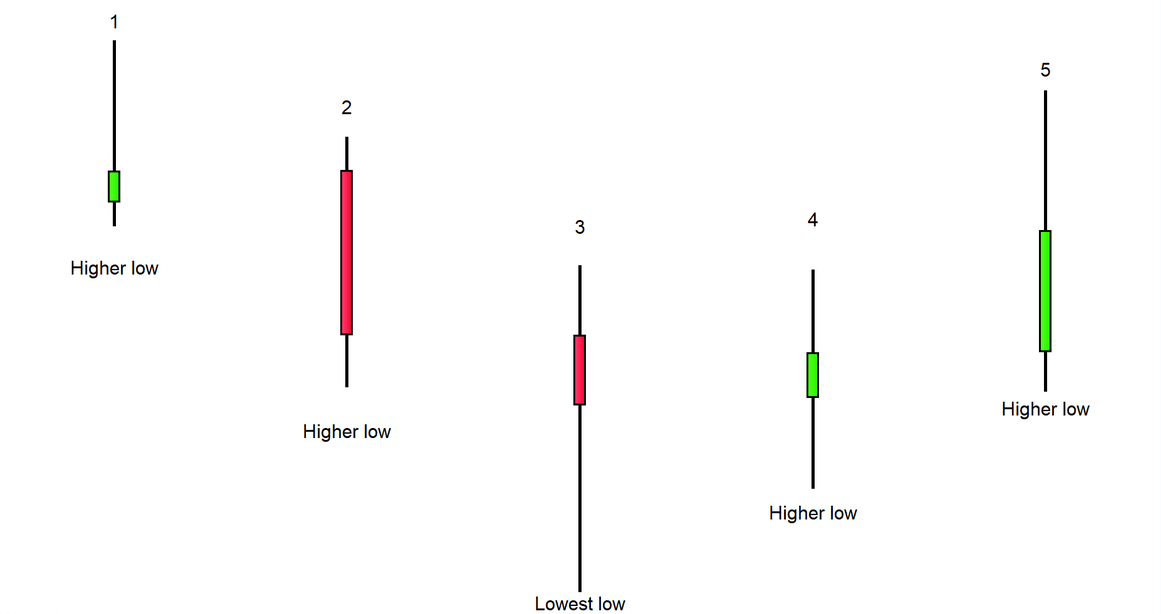
The third candle in a five-candle series has the lowest low
The first two candles have higher lows than the middle candle
The last two candles have higher lows than the middle candle

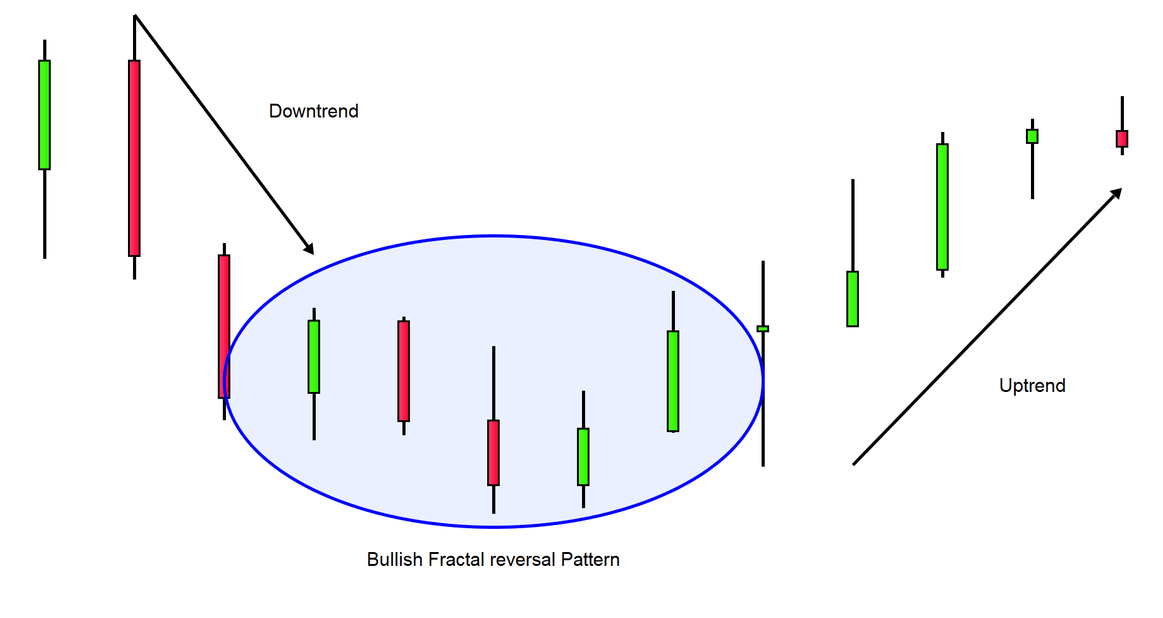
A bullish fractal reversal pattern signifies the end of a downtrend and the beginning of a new uptrend. Traders can use this pattern in two ways:
as a long entry signal or
as a signal to exit an existing short position

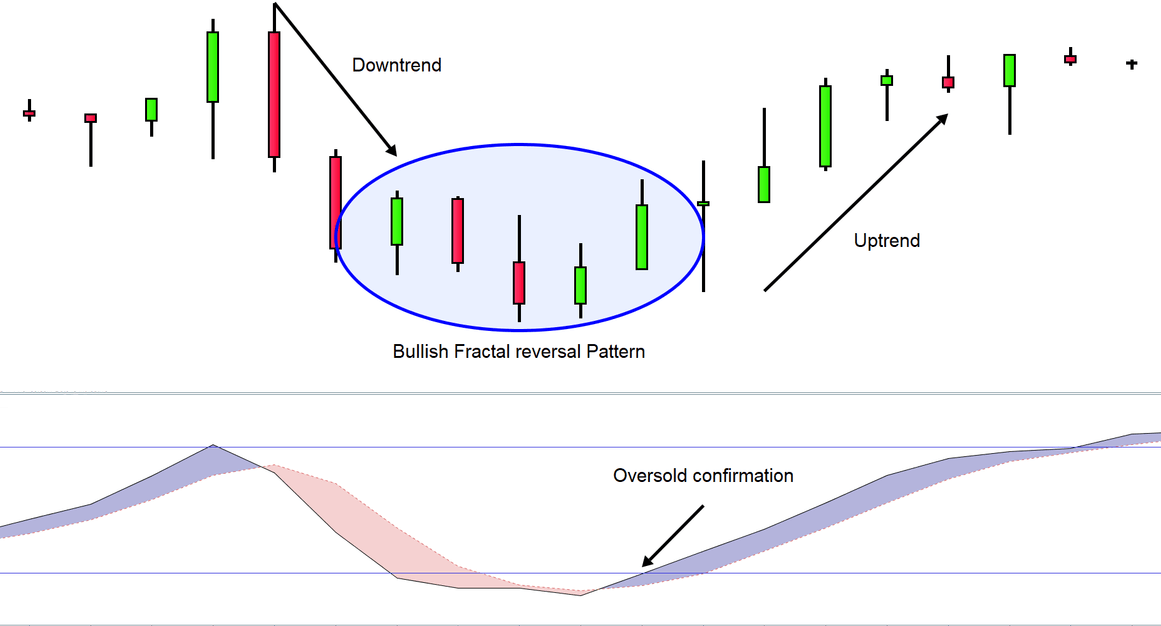
Many traders will use fractal signals alongside oscillators such as the stochastic or RSI for a confirmation of a bullish signal.
On the other hand, a bearish fractal reversal pattern has:

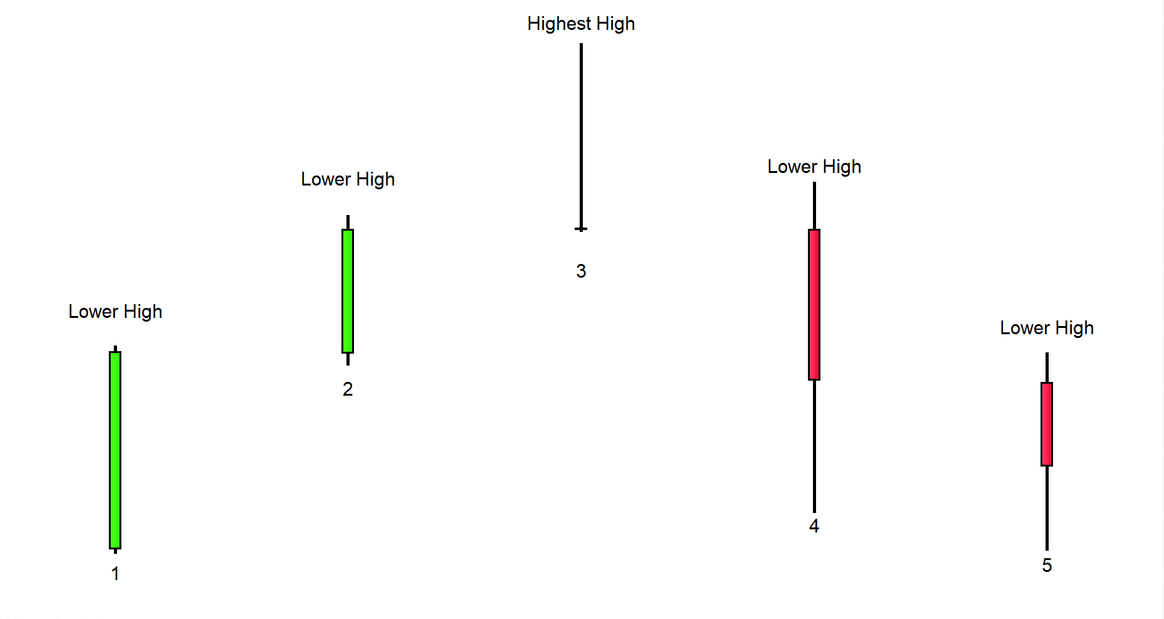
The third candle in a five-candle series has the highest high
The first two candles have lower highs than the middle candle
The last two candles have lower highs than the middle candle

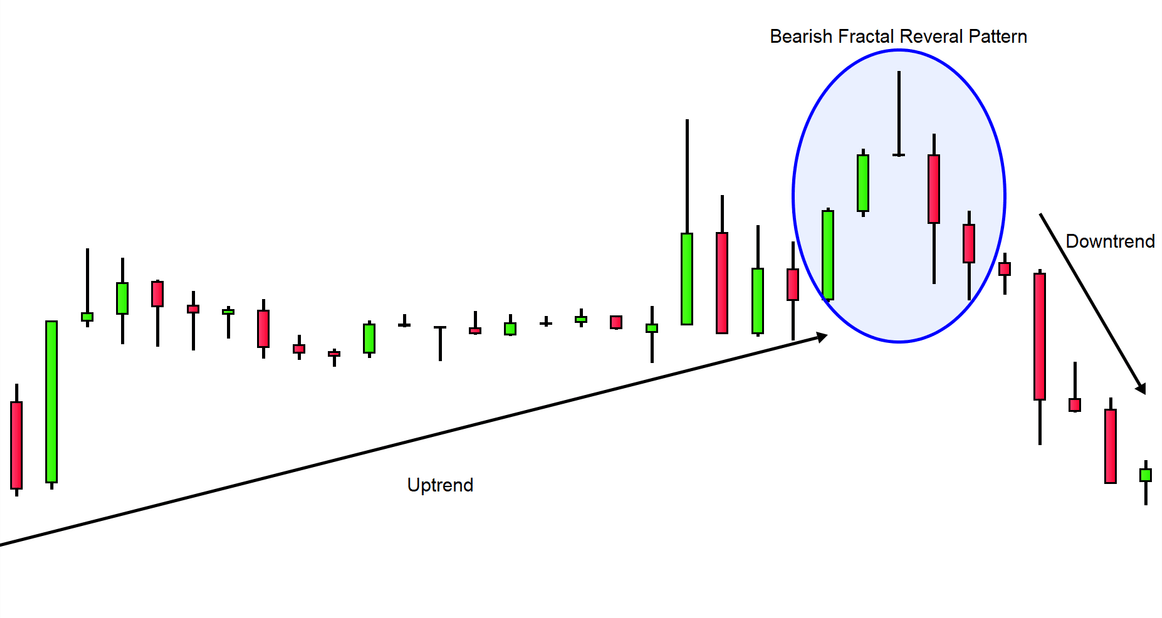
A bearish fractal reversal pattern signifies the end of an uptrend and the beginning of a new downtrend. Traders use this pattern in two ways:
as a short entry signal or
as a signal to exit any existing long position
Fractals – multiple time frame analysis
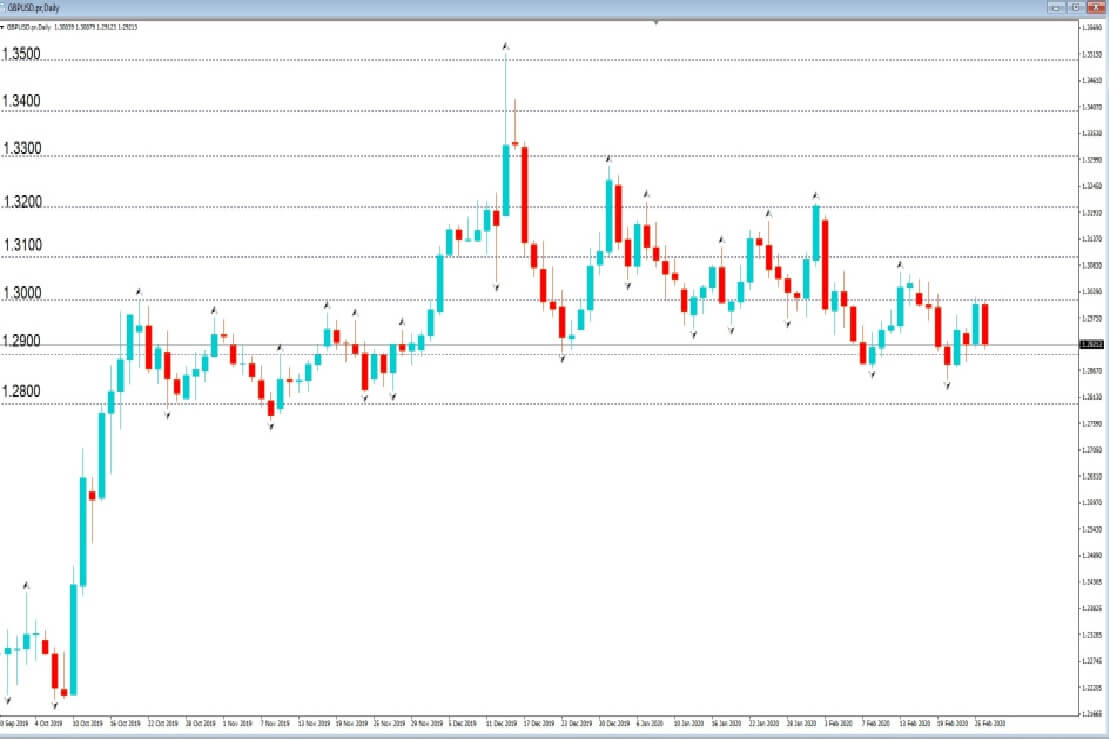
Fractals are also very useful when it comes to multiple time frame analysis. Traders may use fractionalized times frames to create trading ideas.
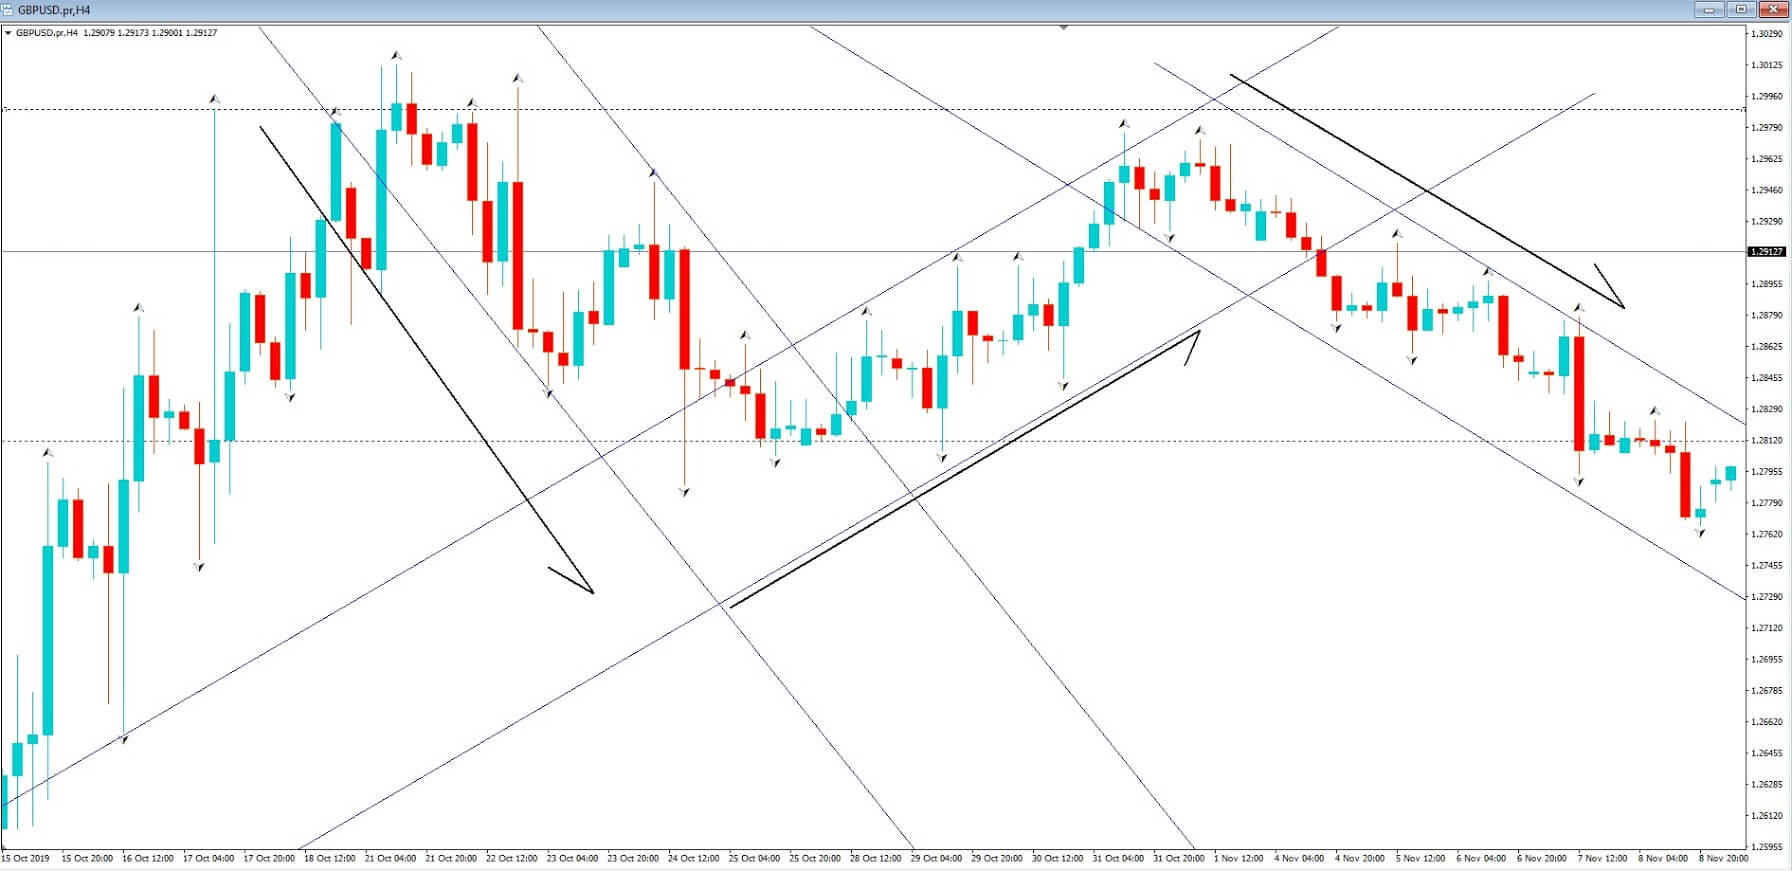
As an example, a trader may use a daily or weekly time frame to get a better view of the overall market stance. However, they should decide their entry and exit points by looking at smaller time frames such as 1-hour or 15-minute charts.
A simple fractal trading strategy may look like this:
A trader identifies a major trend direction on a daily chart
They then use a 1-hour chart to identify their entry and exit points
Entry signals on the smaller time frame are considered only if they align with, the larger time frame trend
Signals against the larger trend are not considered trading signals but rather a suggestion to exit current positions
Conclusion
Using fractals as a trading tool can be beneficial in terms of analyzing daily randomness. Fractals can be used in many ways, so each trader needs to find the variation that suits them. While some traders may like using fractals, others may not. That being said, fractals are certainly a useful addition to any traders’ toolkit.

Categories
Forex Course

109. Fractals – Elliot Waves within an Elliot Wave

Introduction

The 5-3 wave pattern is made up of the combination of 5-wave impulsive pattern and a 3-wave corrective pattern. The 5-wave pattern is inclined towards the predominant trend, while the 3-wave pattern is always against the trend. It is basically a pullback to the overall trend.

However, it does not end there. Within each wave in the impulsive and corrective waves, there is a set of other impulsive and corrective waves. And in that each smaller set of impulsive and corrective waves, there exists another miniature set of impulsive and corrective waves. This top-down approach goes on and on, forever.

The Top-down Approach

The Top-down approach can be considered as a synonym for fractals. In the Elliot wave theory, each wave is made of sub-waves and so on. In an uptrend, the 5-wave impulsive pattern faces upside. In these five waves, waves 1, 3, and 5 are towards the overall trend, while waves 2 and 4 against the trend.

In the same uptrend, the corrective wave pattern faces against the trend, where waves A and C face against the trend (downwards), and wave B faces towards the trend (upwards). In this sequence, there are five waves towards the overall trend (with two minor pullbacks) and three against the trend (with one minor pullback).

According to the fractal theory, each push up and push down has the above sequence. For instance, if we extract wave 1 and wave 2, then wave 1 will be made up of a 5-wave impulsive pattern, and wave 2 will be made up of a 3-wave corrective pattern. In conclusion, the combination of two waves (1 and 2) results in a set of 5-3 wave pattern. Refer to the below figure to get a clear understanding.

The Ordering and Labelling of Elliot Waves

We know that every wave can be broken into smaller waves and so on. But referring to these waves becomes the challenging part. So, to make simplify the labeling of these waves, Elliot has assigned a series of categories to the waves in terms of its size (from largest to the smallest).

Conclusion

We saw that every Elliot wave is made up of another miniature Elliot wave, and this break-down goes forever. But, according to Elliot, the degree identification is not a necessary factor in Elliot wave analysis. As a trader, our goal is not to assign the right degree to the wave pattern but to just understand the timeframe in which it is occurring. In the end, all that matters is the basic analysis of the wave theory. The identification of degree always remains secondary. Cheers.

[wp_quiz id=”71844″]
Categories
Forex Course

106. Introduction to Elliot Wave Theory

Introduction

Elliot Wave Theory is one of the most popular strategies applied by traders. This theory works exceptionally well if read correctly. In the early 1930s, there was this professional accountant named Ralph Nelson Elliot. He was a stock market expert who analyzed the data of stocks closely for 75 years’ timeframe. He thought that markets move in random chaotic directions but later realized that they don’t. After years of analysis and research, he published a book titled The Wave Principle. This book explained in detail about the theory he had proposed.

Elliot Wave Theory

According to Elliot, the market moves in repetitive cycles. The cause for these cycles is the emotions of mass retail investors, primarily due to psychological factors. It was seen that the upward and downward swings in prices caused by the collective psychology of traders always showed a repetition in the same manner. These swings were referred to as ‘waves.’

So, if traders have a clear understanding of these repetitive cycles, one can predict future price movements. In fact, traders can identify points precisely where the market is going to reverse.

Basic Terminologies

There quite a lot of terms involved in the Elliot Wave Theory. For now, we shall the two most fundamental terms and understand others in the later lessons.

Wave

Elliot proposed that trends are formed as a result of the psychology of investors. He proved that swings formed by this mass psychology were a recurring pattern. And these swings were termed as waves. Elliot’s theory, to an extent, resembles the Dow theory, which also mentions that prices move in ‘waves.’

Fractals

Generally speaking, fractals are structuring whose split parts are like a similar copy of the whole. These structures repeat themselves even on an infinite scale. Apart from individual stocks, Elliot discovered that stock indices showed the same recurring structures. So, he moved to the futures market to analyze if the theory worked there as well.

Predicting the Market with Elliot Waves

Elliot studied the stocks in detail and concluded that predictions could be made using the characteristics of wave patterns. It is known that for a trending market, there is a pullback or correction for it. It is usually said that “what goes up, must come down.” That is, price action is divided into trends and corrections. Trends represent the main direction of the market, while corrections are against the trend.

The Elliot wave theory also uses a similar principle. There is an Impulsive wave that moves in the same directions as the larger/main trend. It always shows five waves in its pattern. Then there is a corrective wave that travels in the opposite direction of the larger trend. On a smaller scale, under each impulsive wave, five other waves can be found again. And such a pattern repeats by going into smaller and smaller scales.

Wondering what the above figure represents? To interpret it, stay tuned for the next lesson.

[wp_quiz id=”71282″]
Categories
Forex Videos

Forex Fractals Can Spot Reversals So You Can Break The Brokers!

Fractals


Although, at times, the forex market seems to be unpredictable, candlesticks, as denoted by price action, and various technical indicators, create a series of patterns which repeat themselves time after time. And while to the untrained eye, these patterns may look completely confusing, by mastering technical analysis skills. Eventually these patterns tell you an awful lot about where the price is likely to go to in the future.

One such repeating indicator is called the fractal. The fractal indicator was invented by a trader called Bill Williams. It is calculated from a 5 bar reversal pattern and indicates a trend reversal.

Example A


Example A is a diagram of price action as shown by the Japanese candlesticks and whereby the arrows are fractal indicators denoting a potential reversal in price action. Confusingly the arrow points in one direction; it actually predicts a possible trend reversal in the opposite direction. So an up arrow denotes a bearish trend reversal, and a down arrow denotes a bullish trend reversal.

Example B


Example B: A fractal indicator consists of five or more price bars. And the set of rules which apply to them are as follows: A bearish pattern reversal point occurs when there is a bar with the highest high, set in the middle of two bars with lower highs on each side. A bullish fractal pattern reversal point occurs when there is a bar with the lowest low with two bars on either side with higher lows. The patterns shown here are typically what you would expect to see, with the fractal indicator printed above and below the middle bars.
Fractals tend to work better on higher time frames because on the lower time frames, they will throw up a lot of noise and be more confusing than they are worth.

Example C


Example C, However when used in combination with price action and also the key price action levels, such as whole round numbers such as the double 00’s, such as the 1.2800 or 1.2900 levels in our GBPUSD example, they help us to determine if price action is observing these key areas and therefore can be a second confirmation for entry and exit points, the first being price action itself.
Fractals are essentially a lagging indicator and provide us with a delayed signal to enter the market. However, Although it lags behind price action because it identifies trend reversals, it is particularly useful in longer time frames, especially above 15 minutes, where trends tend to continue for a period of time once the pattern has presented itself.
Find because the fractal indicator does tend to pop up on the chart quite often, it is best to use it in conjunction with other indicators as double confirmation.

Example D


In example D of a 4-hour chart of the GBPUSD pair, we can see the fractals are very often adhering to the resistance and support levels on our trend lines while price action is moving down, up and down again on the char, while also supporting the whole numbers.
Experiment with them on your particular trade setup, and we feel sure that you will find a useful way to incorporate them into your trading methodology.