Categories
Forex Course

202. The Effects Of Bond Yields On The Forex Asset Classes

Introduction

Bonds are referred to as loans provided to big organizations, including national governments, corporations, and cities. Each bond includes a substantial amount of loan. This is because the massive operational scale of the units requires them to take money from multiple sources. Bonds are a form of fixed-income investments.

Bond Yields

Bond yield is defined as the measure of profit that you will make by investing in a bog. The less you pay for the particular bond, the more will be your profit, and the higher your yield will be. Similarly, the more money you invest in a bond, the lesser will be the profit, and subsequently, the lower will be your yield.

Bonds are traded within the foreign exchange market known as the currency pairs. It is defined as the relative rate between the currency of one country and the currency of another one. When a currency pair is traded, the traders are also acquiring one currency and selling the other.

A majority of the currency exchange transacted in the spot market. In this currency market, each participant is required to deliver their respective currency within two business days. Moreover, currency trade that involves the delivery of a currency over two days is executed on the forward market.

This market includes the costs of owning a currency relative to owing the other. And the costs are displayed in the forward’s points that are added or subtracted to the spot rate in order to produce the forward rate. Furthermore, the forward points are measured by subtracting one bond yield from the other.

How Bond Yield Impacts The Currency Movement?

Experienced foreign exchange traders will be able to identify the relationship between the value of the currency, stock prices, and bond yield. The movement in the currency value reflects the actions of foreign investors between stocks and bonds.

Additionally, the relationship between bond yields makes government bond yield serve as a valuable indicator for assessing the opinion on the effectiveness of the U.S. Federal Reserve in inflation control.

Considering that inflation is an imperative aspect that determines currency values, the data extended by the treasury is very important. Granted, the bond yield centres on inflation, as it is associated with growth.

[wp_quiz id=”97495″]
Categories
Forex Fundamental Analysis

What Should You Know About ‘Social Security Rate For Companies’ Forex Fundamental Indicator?

Introduction

Social Security Program is one of the most extensive Government programs in the world that pays out billions of dollars to its citizens each year. Social Security is a macroeconomic program intended to act as a safe-net for active workers of the United States. Changes related to this program tends to affect the majority of the population. Hence, understanding its role and impact on the living conditions of people can give us a better insight into how such programs work.

What is Social Security Rate For Companies?

Social Security Program: The Social Security Program is designed to facilitate retirement benefits, survivor benefits, and disability income for the citizens of the United States. It is run by the federal agency known as Social Security Administration. Social Security is the word used for the Old-Age, Survivors, and Disability Insurance (OASDI) program.

The program was born on August 14, 1935, where President Franklin D. Roosevelt signed the Social Security Act into law of the United States. Since then, the program has continuously evolved and changed significantly over the years. It is a government insurance program designed to act as a safety net for the working population in the United States.

To be eligible for the Social Security retirement benefits, the worker must have an age of 62 at a minimum and should have enrolled and paid into the program for ten years or more. Workers who wait till later ages like 66 or 70 receive higher and higher benefits accordingly.

Apart from the worker himself, a divorced spouse can also be eligible for benefits provided she has not remarried, and their marriage lasted over ten years. Similarly, children of retirees can also be eligible until the age of 18, which can be longer in the case of disability or child being a student.

Social Security Tax: It is the tax levied upon both the employer and employee to fund the Social Security Program (SSP). It is collected as a payroll tax as mandated by the Federal Insurance Contributions Act (FICA) and the Self-Employed Contributions Act (SECA).

Social Security Rate: For the year 2020, the Social Security Rate is 12.4% that is evenly divided between the employee and the employer. It implies the Social Security Rate for Companies is 6.2%.  Social Security Tax is levied on the earned income of employees and self-employed taxpayers. Employers generally withhold this tax from the employee’s paycheck and forward it to the Government.

It is also worth mentioning that there is a tax cap to the Social Security Fund. For 2020, the Social Security tax cap is $137,700, meaning any income earned above 137,700 is not subject to the Social Security tax.

How can the Social Security Rate For Companies numbers be used for analysis?

Social Security is regressive, meaning it takes a more significant percentage of income from low-income earners than their higher-income counterparts. It occurs because of the tax cap, as mentioned earlier, due to which higher-income earner’s portion of income is not subject to this tax deduction.

The collected funds are not stored for the currently paying employee; instead, they are used for the retirees currently eligible for collection. Some have raised concerns on this way of approach when the baby boomer generation starts to collect its benefits, then the ratio of paying to the collecting people would be tipped off. It would mean that more people are collecting benefits than the people paying into it.

Hence, a common worry in the 21st century is the insolvency of the Social Security Funds due to the increased life expectancy of people and decreasing worker-retiree ratio. Proposed solutions to this from analysts were to increase the current rate to keep the program funded. Still, politicians are hesitant to endorse it due to fear of backlash or negative sentiment outburst from the public.

The 2020 report from the OASDI trustees projects that the retirement funds would be depleted by 2035 and disability funds in 2065. When that occurs, the taxes would not be enough to fund the entire Social Security program, and the Government needs to fill this gap. It may result in higher taxes on workers, fewer benefits, higher age requirements, or a combination of these.

For companies, an increase in Social Security Taxes directly cut down their profit margin, and hiring is more expensive. As a result, companies would be forced to keep employees only when required to avoid losses. Hence, Tax rates have a cascading effect on business profitability for companies as well as employment rates for the United States. When Social Security Taxes increase, the income offered to the employees is also affected, which can discourage personal consumption and spending for the working citizens.

Impact on Currency

The Social Security Rate for the Companies and the employees are revised every year. For consecutive years it tends to remain constant and tends to change in small incremental steps over a few years at a time. Hence, the volatility induced in the currency markets is almost zero to negligible most of the time unless significant changes occur. The changes also would be priced in through news updates into the market long before we receive official statistics.

Hence, Social Security Rate is a low-impact indicator and can be overlooked for more frequent statistics for the FOREX markets.

Economic Reports

The U.S. Social Security Administration provides the complete historical data of the Social Security tax rates for both the employee and employer on its official website. The Organization for Economic Co-operation and Development (OECD) also maintains the same for its member countries on its official website.

Sources of Social Security Rate For Companies

Social Security Rates for companies can be found on the Social Security Administration website.

Social Security Rates for employees can be found on the OECD’s official website.

Social Security Rates for companies (similar policies with different names) across the world can be found on Trading Economics.

How Social Security Rate for Companies News Release Affects Forex Price Charts

By law, companies are required to contribute half of the social security rate that their employees contribute. In the U.S., this rate for companies in 7.65% for each employee on the payroll for up to $ 137,700 per employee. This rate is reviewed annually and has remained unchanged in the U.S. for the past 25 years. For forex traders, this release of this rate in the U.S. is considered a non-news event since it is not expected to impact the forex market.

The screen capture below shows the current social security rate for companies in the U.S. taken from Trading Economics.

The latest review of the U.S. social security rate was on October 10, 2020, at 4.00 PM ET, and the press release can be accessed here.

Now, let’s see how this news release made an impact on the Forex price charts.

EUR/USD: Before social security rate release October 10, 2020, 
just before 4.00 PM ET

As can be seen on the above 15-minute EUR/USD chart, the pair is on a weak downtrend before the news release. This downtrend is evidenced by the candles forming slightly below the 20-period Moving Average between 12.00 PM and 3.45 PM ET. Furthermore, the Moving Average appears to be flattening.

EUR/USD: After social security rate release October 10, 2020,
at 4.00 PM ET

As expected, there was no market volatility after the news release about the social security rate for 2020. The chart above shows a 15-minute “Doji” candle forming after the news is released. The pair later traded on a neutral pattern as the 20-period Moving Average flattened. The news release about the social security rate for companies did not have any impact on the price action of the EUR/USD pair.

Let’s quickly see how this new release has impacted some of the other major Forex currency pairs.

GBP/USD: Before social security rate release October 10, 2020, 
just before 4.00 PM ET

Before the news release, the GBP/USD pair is on a steady uptrend, as shown by the chart above. An hour to the release, the uptrend became subdued, and the pair adopted a neutral pattern.

GBP/USD: After social security rate release October 10, 2020, 
at 4.00 PM ET

After the news release, the pair forms a 15-minute “Doji” candle. It continues to trade in the neutral pattern observed earlier.

AUD/USD: Before social security rate release October 10, 2020, 
just before 4.00 PM ET

 AUD/USD: After social security rate release October 10, 2020, 
 at 4.00 PM ET

The AUD/USD pair shows a similar neutral trading patter as the EUR/USD and GBP/USD pairs before the news release. This trend is evidenced by the 15-minute candlesticks forming around a flattening 20-period Moving Average between 1.00 PM and 3.45 PM ET. After the news release, the pair forms a 15-minute “Shooting star” candle and continues to trade in the same neutral pattern as before.

From the above analyses, it can be seen that the news release of the social security rate for companies does not have any impact on the price action.

Categories
Forex Course

106. Introduction to Elliot Wave Theory

Introduction

Elliot Wave Theory is one of the most popular strategies applied by traders. This theory works exceptionally well if read correctly. In the early 1930s, there was this professional accountant named Ralph Nelson Elliot. He was a stock market expert who analyzed the data of stocks closely for 75 years’ timeframe. He thought that markets move in random chaotic directions but later realized that they don’t. After years of analysis and research, he published a book titled The Wave Principle. This book explained in detail about the theory he had proposed.

Elliot Wave Theory

According to Elliot, the market moves in repetitive cycles. The cause for these cycles is the emotions of mass retail investors, primarily due to psychological factors. It was seen that the upward and downward swings in prices caused by the collective psychology of traders always showed a repetition in the same manner. These swings were referred to as ‘waves.’

So, if traders have a clear understanding of these repetitive cycles, one can predict future price movements. In fact, traders can identify points precisely where the market is going to reverse.

Basic Terminologies

There quite a lot of terms involved in the Elliot Wave Theory. For now, we shall the two most fundamental terms and understand others in the later lessons.

Wave

Elliot proposed that trends are formed as a result of the psychology of investors. He proved that swings formed by this mass psychology were a recurring pattern. And these swings were termed as waves. Elliot’s theory, to an extent, resembles the Dow theory, which also mentions that prices move in ‘waves.’

Fractals

Generally speaking, fractals are structuring whose split parts are like a similar copy of the whole. These structures repeat themselves even on an infinite scale. Apart from individual stocks, Elliot discovered that stock indices showed the same recurring structures. So, he moved to the futures market to analyze if the theory worked there as well.

Predicting the Market with Elliot Waves

Elliot studied the stocks in detail and concluded that predictions could be made using the characteristics of wave patterns. It is known that for a trending market, there is a pullback or correction for it. It is usually said that “what goes up, must come down.” That is, price action is divided into trends and corrections. Trends represent the main direction of the market, while corrections are against the trend.

The Elliot wave theory also uses a similar principle. There is an Impulsive wave that moves in the same directions as the larger/main trend. It always shows five waves in its pattern. Then there is a corrective wave that travels in the opposite direction of the larger trend. On a smaller scale, under each impulsive wave, five other waves can be found again. And such a pattern repeats by going into smaller and smaller scales.

Wondering what the above figure represents? To interpret it, stay tuned for the next lesson.

[wp_quiz id=”71282″]
Categories
Forex Fundamental Analysis

What Impact Do ‘Building Permits’ News Release Have On The Forex Market?

Introduction

The building permits monthly reports is one of the major indicators closely watched by economists and Fundamental analysts. It is also one of the most misunderstood numbers even by experienced traders. Understanding the difference between building permits report, housing starts report, and housing completion reports and what they imply is key here. It is important to understand the building permits report because it plays a key role in predicting GDP growth.

What is a Building Permits Report?

Building Permit Report

It is an official authorization by the local governing body to allow construction of a new building or the reconstruction of an old one. An individual owning land cannot simply build a house or a commercial store without any approval from the concerned legal authorities. The building which has obtained its permit implies that it has received the planning permission by the local state planning department.

The governing body dictates construction rules and regulations, which will be specific to that geographical location. For example, a state which is vulnerable to earthquakes is likely to have a mandate which dictates that building should be able to tolerate a certain level of seismic activity. A coastal region-building permit might require the builders to construct the building to tolerate high-velocity winds etc.

Housing Starts Report

It is a monthly report which tells the number of houses that have started their construction activity recently and are at the beginning stage of the construction process.

Housing Completion Report

It is also a monthly report which tells the number of houses that have reached their finishing stage with the majority of the construction work completed recently.

How is the Building Permits Report obtained?

In the United States, the United States Housing Sector monitors building permits. The Housing Sector releases the U.S. Housing Starts report from which the United States Census Bureau releases the monthly building permits report. The report is released every month in the second or third week for the previous month (eighteenth working day to be precise).

As per the Census Bureau, the organization conducts a voluntary mail survey, to which the officials give a response with their reports and figures from which they generate the final report. They cover almost the entire country through the individual permit offices, which in most cases, are the municipalities. Based on geographical locations, the reports can be categorized for area-specific analysis. 

Is the Building Permits Report important?

The number of building permits applied is genuine, as it costs around 500 to 2000 dollars on the type of building, which can be a residential home or a commercial store. All the numbers are, in actuality, going to translate into real newly constructed buildings.

Construction of a building involves a lot of economic activities like the hiring of the labor force, preparing raw materials, purchasing construction items, hiring engineers, etc. Because of the scale and nature of the activity, more money gets circulated into the economy. A large increase in the number of building permits can indicate an increase in employment, increased consumption of goods and services, flourishing businesses, etc.

Construction permits also indicate that the population has enough funds or has the necessary means, which is usually bank loans. Most people construct a home through a mortgage, which implies that banks are ready to lend money; this again implies that money was injected into the economy to stimulate economic activity.

An increase in building permits can also mean that the population has more confidence in their economic prospects and trust the solvency of the plan. Since the construction of a home or a commercial store involves a significant amount of money, we can also give an insight into the nation’s liquidity and health of the economy. An increase in building permits also gives us an idea about the country’s lending environment, i.e., whether the health of the banking sector for the monetary base of the nation will expand or contract, which can be inflationary or deflationary respectively.

How can the Building Permits be Used for Analysis?

The data set goes back to the 1960s, which is a fairly decent range to rely on its correlation with economic activity with good confidence. The U.S. Census Bureau publishes building permits report, housing starts report, and housing completion report. Among these, the building permits report is the most closely watched reports as it indicates an upcoming economic activity. Whereas the housing starts report tells us about the current economic activity, while the housing completion report tells us of the past economic activity.

An increase in the building permit report tells that the construction sector people are confident about an increase in demand for house sales, which implies more money will be in circulation soon. Conversely, decreased building permits report tells us that the economy is slowing down or contracting due to which people are not ready to buy new houses or do not have sufficient funds to afford the cost.

The building permits report is an advanced indicator, whereas the housing starts report is a current indicator, and the housing completion report is a trailing indicator. The building permit indicates first of an upcoming economic surge or plunge while the housing starts report reflects the current economic condition, and the housing completion report shows the effect of a past economic surge or plunge.

It is noteworthy to mention that the housing completion follows the housing starts numbers, and the housing starts number follow the building permits numbers. An increase in the building permits will automatically result in a rise in the housing starts number in the subsequent months, and a few more months later, the same numbers will appear in the housing completion report. Hence, understanding which reports implies what economic activity is key here.

Sources of Building Permits Reports

We can browse through the historical building permits survey reports on the official website of the United States Census Bureau here. You can also find the construction-related statistics here.

Impact of Building Permits news release on the price chart 

In the first part of the article, we understood the importance of Building Permits in a country, which is a key indicator of demand in the housing market. The ‘Building Permits’ indicator, also known as ‘Building Approvals’, is one of the most impactful events in the forex market.

Traders and investors around the world pay a lot of attention to this data and keep close on its numbers. The ‘Building permits’ data is released on a monthly basis and is said to cause a fair amount of volatility in the currency pair. In the following section, we shall see how the data of ‘Building Permits’ affects the price charts and notice the change in volatility.

For illustrating the impact of the news, we will be analyzing the latest month-on-month ‘Building Permits’ data on Australia and measure the impact of the same. A higher than expected reading is considered to be positive for the economy, while a lower than expected reading is considered to be negative. In this case, the ‘Building Permits’ of Australia was reduced to -15.3% from +3.9%, which is a reduction of a whopping 19.2%. One would already imagine this to be very bad for the Australian economy but let us see what it meant for currency traders.

AUD/CAD | Before The Announcement

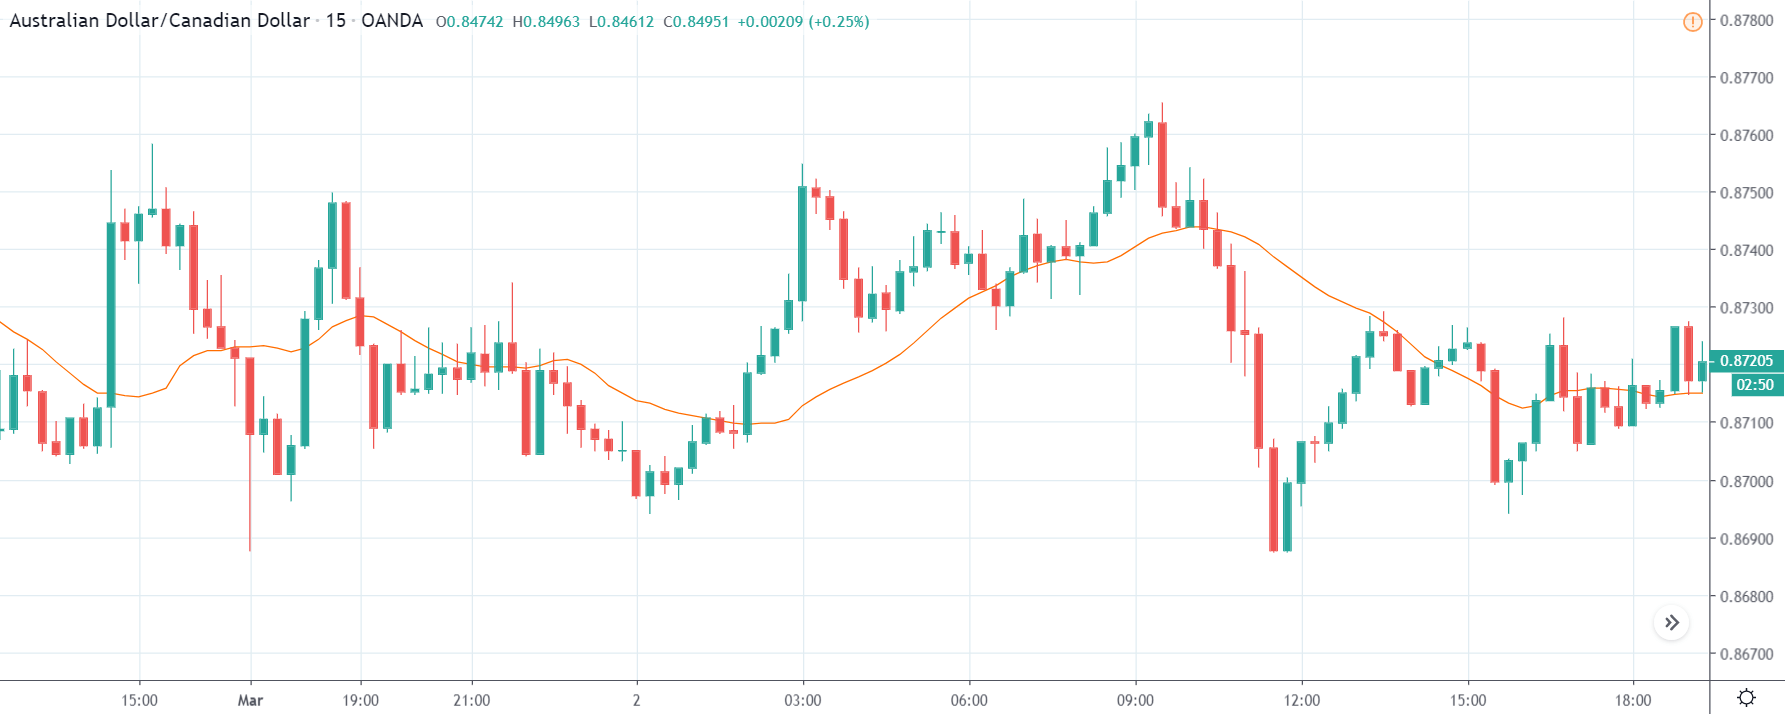
We shall begin with the AUD/CAD currency pair, where the above chart shows market action before the news announcement. We see a decrease in volatility as the announcement is nearing as the market players are eagerly waiting for the ‘Building Permits’ data. We already have an idea from what is forecasted by economists that the data is going to much worse than before due to a fundamental factor that has affected the Australian economy. Instead of predicting what the numbers are going to be, it is better to wait for the actual news release and trade based on the shift in momentum.

AUD/CAD | After The Announcement

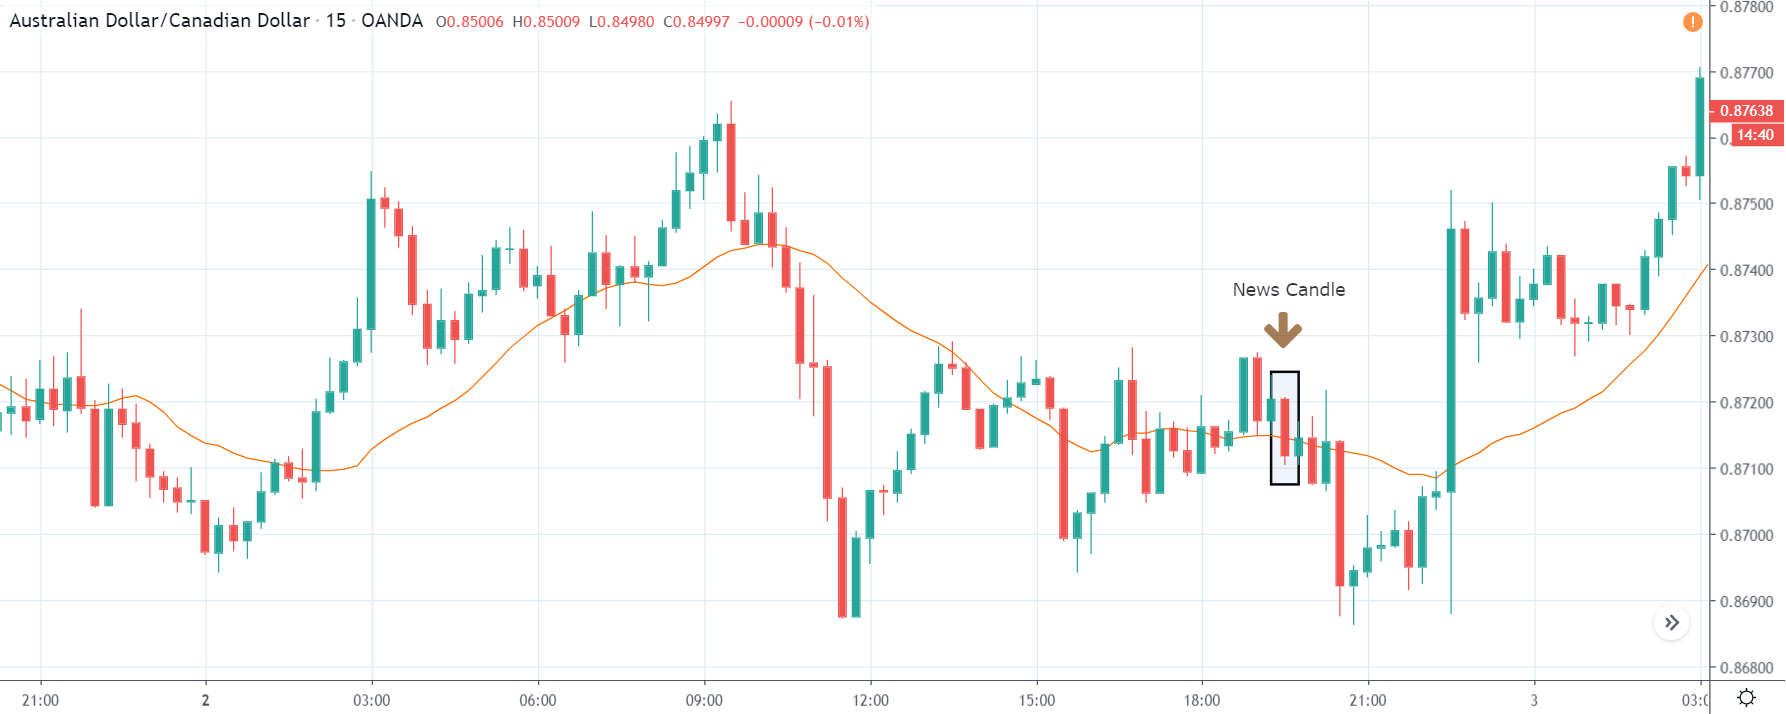
In the above chart, after ‘Building Permits’ data is released, the market collapses, and the price goes below the moving average. The market reaction was as expected, where there was a sudden increase in volatility on the downside. The data shows that there was the least confidence in the housing market of Australia in the month of February. As the market falls and given that the ‘Building Permits’ data was very bad, we can ‘short’ the currency pair with certainty.

A few hours later, we see that the market shot up and reversed completely.  This move was influenced by the announcement of ‘Interest Rate’ by the Reserve Bank. We need to always be aware of such events, especially when we are already in a trade. This teaches us the importance of trade management, which crucial for every trade.

AUD/CHF | Before The Announcement

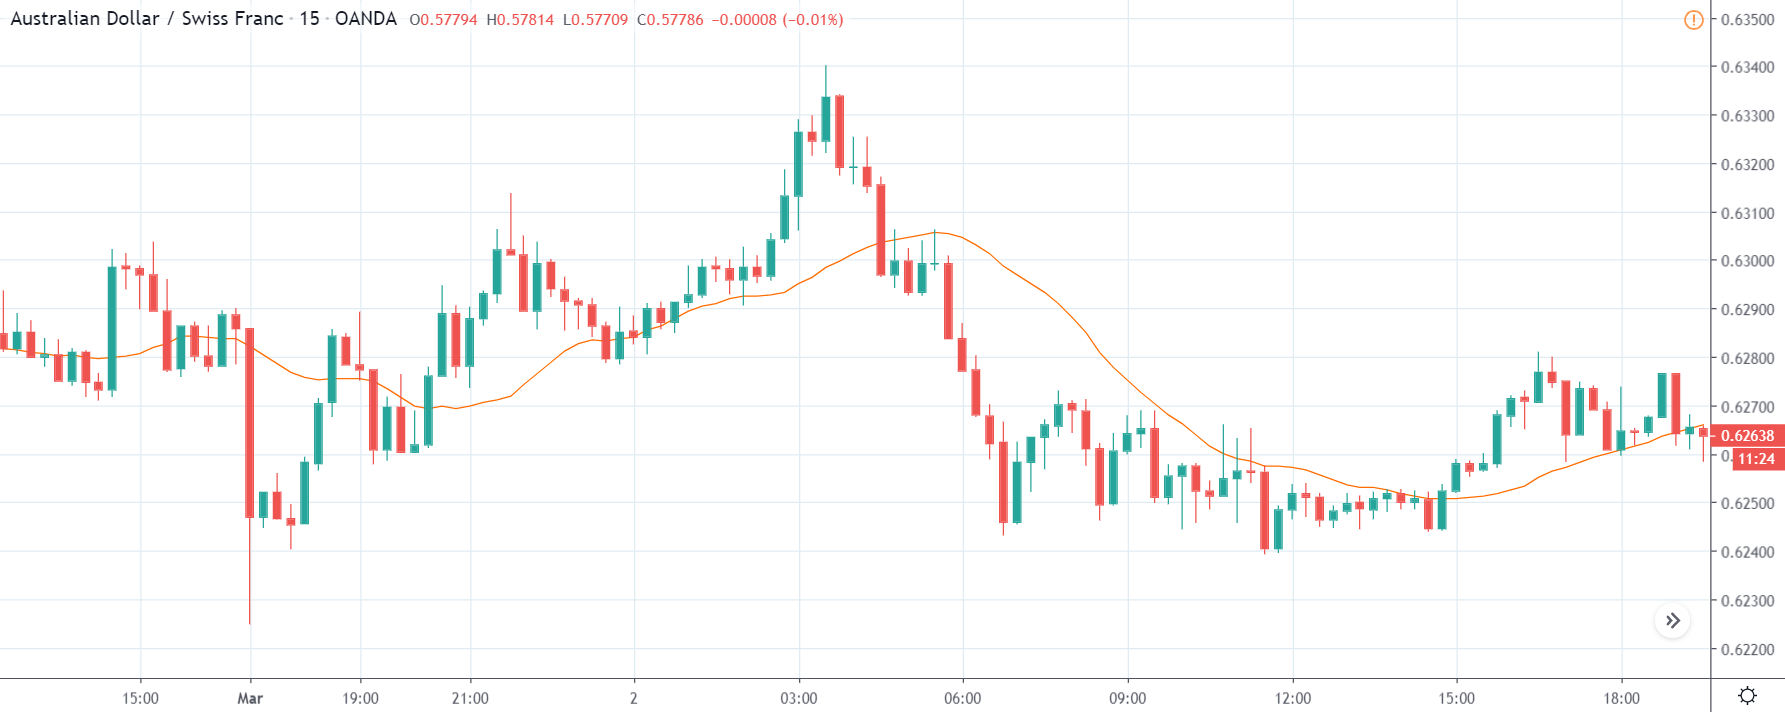
AUD/CHF | After The Announcement

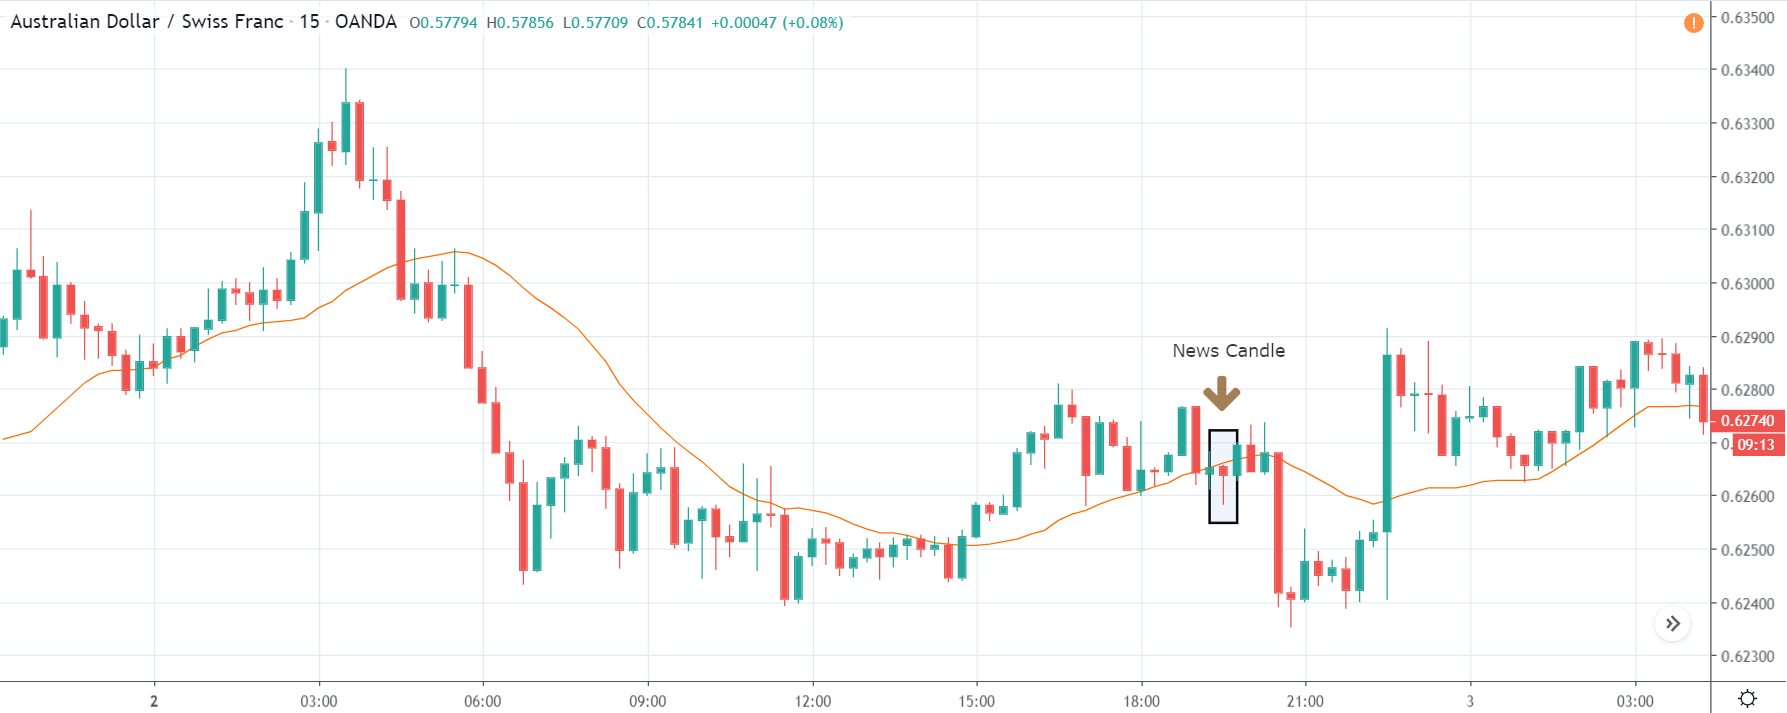
The above images represent the AUD/CHF currency pair, where it seems like the market has factored in weak ‘Building Permits’ data before the news announcement. After a big downward move, the market has retraced from the ‘lows,’ which is the ideal use case for going ‘short.’

Also, at present, the price is below the moving average, which shows the weakness of the Australian dollar. After the data is released, the price goes lower but leaves a spike on the bottom, and we see increased volatility on both sides. But this shouldn’t scare us, and we need to stick to our plan of going ‘short’ in the currency pair as the data was really bad.

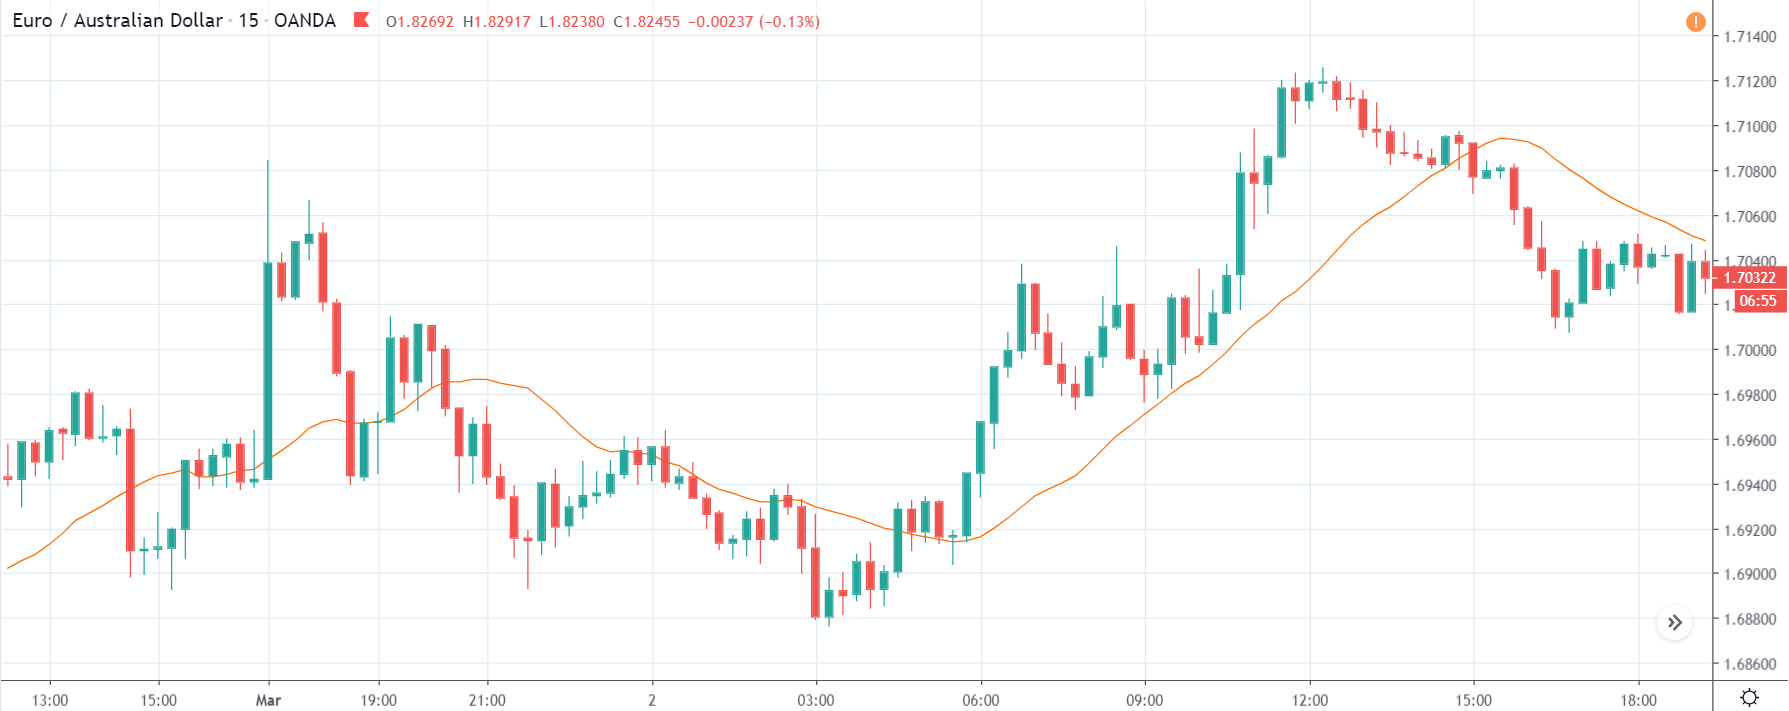
EUR/AUD | Before The Announcement

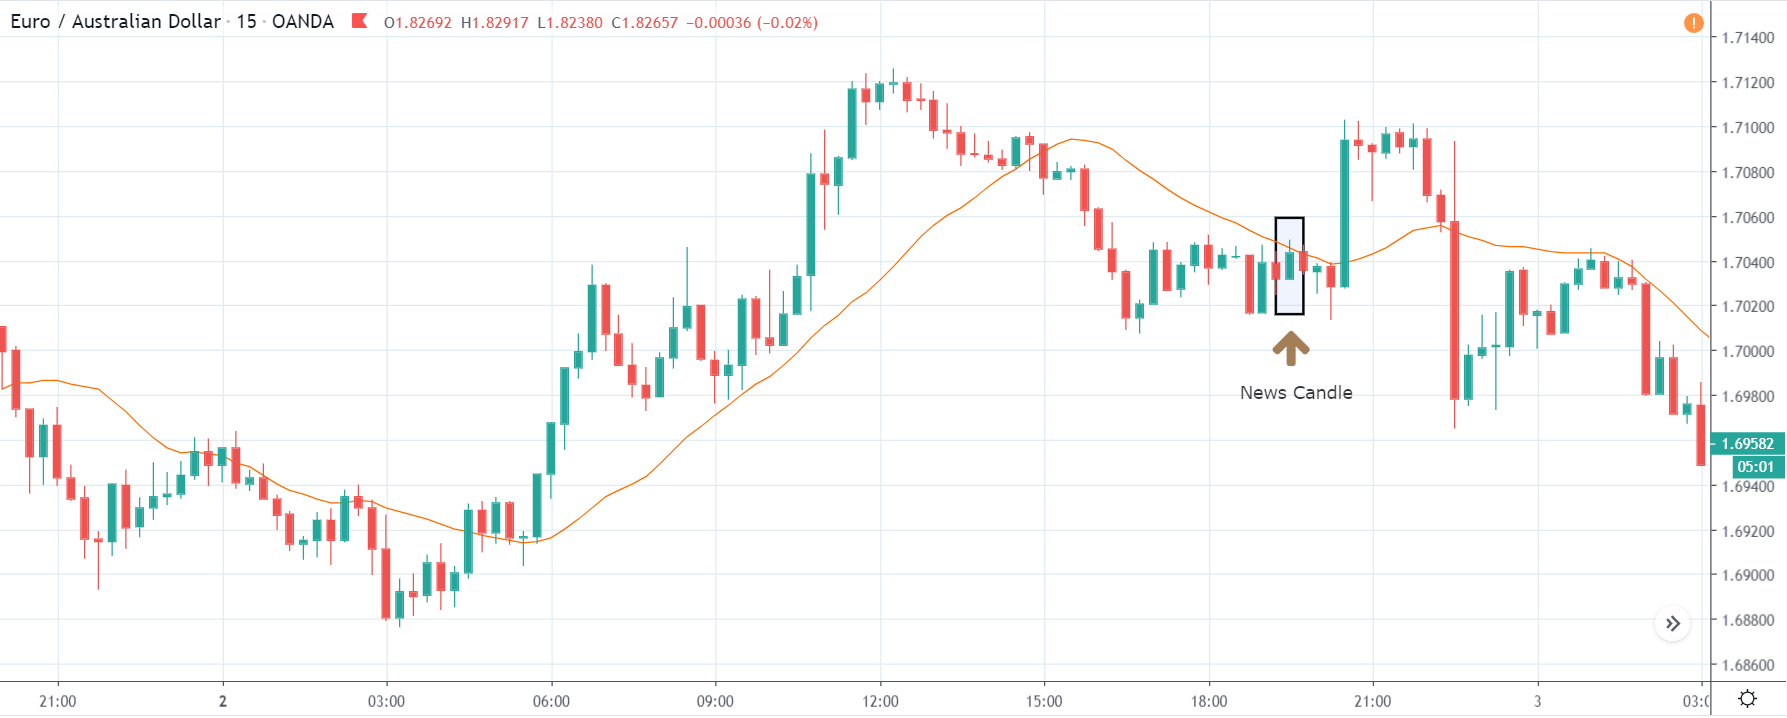
EUR/AUD | After The Announcement

In the EUR/AUD currency pair, the Australian dollar is on the right-hand side, which means a news release positive for the currency should take the price lower and vice versa. The characteristics of this pair are different from the above-discussed pairs since the price has retraced the major uptrend by a lot. This means the Australian dollar is very strong against the Euro.

Therefore, any news release that is negative for the Australian economy may not collapse the Australian dollar here. Therefore, it needs to be traded with caution. After the news announcement, the price does go up because of the weak ‘Building Permits’ data, but after a couple of candles, the price goes below the ‘news candle.’ We see that the news data does not have much impact on this currency pair and not suitable for trading based on news.

That’s about Building Permits and the impact of its new release on the price charts. Let us know if you have any questions in the comments below. Cheers.

Categories
Forex Course

18. What Should You Know About Trading The New York Session

Introduction

After the Asian and the London session, the big fishes enter into the market, i.e., the New York market. When London’s session is halfway through its trading, the New York markets make an entry into the market. Precisely, the New York session begins at 8:00 AM EST. This session is also referred to as the North American session. The liquidity during this session is pretty high.

As we have discussed the average pip movement in the Tokyo session and the London session, let us compare the pip movement by considering all the three sessions. The London session tops the table, which is then followed by the New York session and, finally, the Tokyo session.

Average Pip Movement

London session > New York session > Tokyo session

Now, let us see the average pip movement for some of the extensively traded currencies in the market.

How to trade the New York session

The New York session opens at 8:00 AM EST, which is during the London session. That is, there is an overlap between the two sessions. Since the world’s two largest markets are trading in the forex market, one can expect a high volume of orders flowing into the markets. Hence, this is an ideal time to enter the market as the spreads are quite low during this phase of time.

During the New York session, the economic news begins to drop. And as a matter of fact, 85% of the news is related to the US Dollar. So, news traders can keep a close watch on all the US Dollar pairs as the news typically moves the market drastically.

During the market open, the liquidity of the market is excellent, but as the noon approaches, it begins to drop. That is, during lunch hours, the market goes into a consolidation phase.

Another interesting fact to consider is, the market loses its momentum on Friday afternoon as the weekend begins for the Asian and the European markets. Hence, it is not a good idea to trade on Friday afternoons. Apart from momentum, it is possible for the markets to reverse its direction as the traders might look to square their positions off.

Which pairs should you have on your watchlist

The liquidity during the start of the session is excellent, as the London markets are open as well. So, during this time, you can choose to trade any pair. However, it is recommended to concentrate more on the major and minor currency pairs.

Several news events come in during this session. So, a news trader can take advantage of them, although a novice trader should stay away from pairs affected by such events, as it requires abilities unrelated to technical analysis.

Therefore, all in all, the New York session is a session that can be profitable for all types of traders. The volatility of the market during this session stands in between the London session and the Asian session. Hence, if you’re a novice trader, it is a good idea to start off with the New York session.

We have completed this short tutorial in the New York session. And in the next lesson, we shall go more precisely into when exactly to trade the Forex market. Let’s see if you have understood this lesson correctly by answering the questions below.

[wp_quiz id=”47122″]
Categories
Forex Course

15. All About Trading The Tokyo Session!

Introduction

Japan’s capital Tokyo, is the most majorly traded market in the Asian continent. That is, in Asia, the highest volume comes from the Tokyo market. In fact, it is considered the financial capital of Asia. Moreover, it is the third-largest trading center in the world.

The Tokyo session, also referred to as the Asia session, opens at 8:00 PM EST and is traded until 5:00 AM EST. In terms of Japan’s local time, the trading happens between 9:00 AM to 6:00 PM. As ‘Yen’ is the currency of Japan, 16.50% of all the Yen transactions take place during this time. And as far as all currency transactions are concerned, the value lies at 21%.

The one that matters the most during any session is the pip movement in different pairs. Below is a table which represents the average pip movement for some of the major currency pair.

Now, the average of the above currency pairs turns out to be around 53 pips. This number is less when compared to the New York session and the London session.

Some facts about trading the Tokyo session

During this session, the market is seen to fade away its momentum. That is, the market is seen to be quite flat. In technical terms, the market usually goes through a consolidation state. This session might not be the ideal session for the ones looking for large pip movement. However, this session can be great for scalpers.

Tokyo market typically is known to correct the overbuying and selling in the New York session. The market makes drastic moves during the NY session and comes to slows down its pace during the Tokyo session. Therefore, the liquidity during this session is quite feeble.

It is not just the central banks and hedge funds that move the market. Since Japan is the largest exporter in the world, a large number of transactions come from the exporters as well.

Also, the Bank of Japan is an active participant in the forex market during the Tokyo session. This is because it intervenes the curb appreciation in the Yen regularly.

Which currency pairs should you focus on?

The market conditions and situations tend to change from time to time, so it becomes uncertain to predict the exact movement of pairs. However, if we were to consider the average rates, we can keep an eye on the news from countries like Australia, New Zealand, China, and Japan. The news from these countries comes during the Tokyo session or just before its open. And the news usually pumps up the volatility and liquidity of the market. Hence, one can have a focus on AUD, NZD, and JPY pairs.

When the Tokyo session comes to an end, the London markets open, which causes overlap between the two sessions. So, to be part of the significant movements, keep an eye on GBP, EUR, and CHF along with AUD, NZD, JPY, and USD.

This is a brief review of the Tokyo session. We shall discuss the other sessions as well in the upcoming lessons. Take the below quiz to know if you have learned the concepts right.

[wp_quiz id=”46800″]
Categories
Forex Course

14.The Different Sessions In The Forex Market

Introduction

The forex market is traded all across the world. In fact, it is open 24 hours. And these markets are traded in countries when their national markets are open. There are about four major countries where vast lumps of cash flow in and out of the forex market and thereby keeping it very liquid and volatile. To trade professionally, having an idea of the different markets open and close is vital. Hence, in this lesson, we shall be going over the various sessions in the forex market.

Forex market trading sessions

Though all countries trade in the forex market, there are a few countries where the massive volume of trading takes place. The 24 hours trading in the forex market is divided into four sessions. These four sessions are given as follows:

• The Sydney Session 

• The Tokyo Session

• The London Session

• The New York Session

Moreover, the open and close of these sessions vary based on the season as well. One session falls between March/April to October/November, and the other starts from October/November and goes up to March/April. The former is the spring/summer session, and the latter is the Fall/Winter session.

Trade timings during Spring/Summer (in the US)

Trade timings during the Fall/Winter (in the US)

Note that the time represented is the local time (US) and the EST, and is different from every country’s standard time. However, the standard market timings for most countries lie within 7:00 AM and 6:00 PM.

Furthermore, there is an overlap between sessions. That is, during the overlap, the Forex market is traded by two regions simultaneously. For example,

The New York and the London session has an overlap between 8:00 AM – 12:00 PM EST

The Sydney and the Tokyo session overlaps between 7:00 AM and 2:00 AM

And the London and the Tokyo session overlaps between 3:00 AM to 4:00 AM.

These overlapping sessions are essential for traders because at that time is when more liquidity and volatility are created in currency pairs. This is so because traders from two markets operate simultaneously.

Hence, this completes the lesson on the different sessions in the forex market. And in further lessons, we shall discuss each one of the sessions in detail. For now, test your learning of this lesson by taking up the quiz below.

[wp_quiz id=”46553″]
Categories
Forex Market

An Overview Of The Forex Trading Industry

Introduction

Some of the most relevant markets include the Stock market, Futures market, Options market, and Foreign Exchange market. All these markets provide vast trading opportunities, and out of these, Foreign Exchange AKA FOREX is one of the most popular ones. Forex is nothing but the exchange and trade of different country’s currencies. The first Forex trading market was established in Amsterdam nearly five centuries ago, and this explains the rich history of this market.

The Forex market is the largest yet most accessible market in the world. Largest because the daily trading volume of the Forex market is above $5 trillion. To put that in perspective, the average daily trading volume of the NYSE (largest stock market in the world) is just above $20 billion. By this, we can understand the enormous size of this market. Out of this $5 trillion, retail trader transactions contribute 5% to 6%, i.e., about $400 billion. The rest of the transaction volume is from large institutions and businesses.

We also mentioned accessibility because traders have thousands of retail brokers around the globe to choose from. They can start trading currencies in this market with investments starting from just $100. Forex trading is open 24 hours a day and five days a week. It doesn’t operate on weekends. On weekdays, the market doesn’t get closed at the end of each business day, like how the stock market does. Rather the trading shifts from one financial center to others. Some of the major financial centers include London, Sydney, New York, and Tokyo.

What affects the Forex market?

One of the critical factors that most of the experienced traders pay attention to is the macro-economic trend. The forex market reacts to macroeconomic data more than the stock or commodity market. In a stock market, we have companies that are affected by micro-dynamics, which are specific to that company. But that’s not the case in the Forex market. This market is affected and moderated by GDP, unemployment rates, and inflation. The currency could react positively or negatively depending on the data, but after reacting, the trend will be maintained for a long time. The significant pairs to watch during such news releases are EUR/USD, USD/JPY, GBP/USD, and USD/CHF. The rate hikes from the U.S. Federal Reserve is also closely watched by traders around the world.

The rise of algorithmic trading

Banks and financial institutions are adopting algorithmic trading systems powered by technological advancement. Technology is changing traders’ approach towards the market. There is a boom in engineered computer programs that offer new ways of creating orders with faster trade execution. The automated systems have improved speed and precision. This technology is expected to eliminate trading bias and human errors that increase the risk in a trade. Algorithmic trading improves trend analysis that greatly helps beginners in reducing losses. Due to this, traders are getting more time to analyze markets and trends.

Future of Forex market

The Forex is continuously growing. Trading currencies is still not a mainstream profession in many of the third world countries. There are still many people who aren’t aware of the fantastic opportunities this industry has to offer. One of the important goals of the brokerage firms is to get more and more people involved in pursuing trading as a serious profession.

  • Market volatility will rise as newer strategies are being released and used by traders.
  • Strict regulation in the forex market will also attract conservative traders. However, some traders search for unregulated brokers since they provide inexpensive trading services.
  • Paid systems and strategies will continue to grow among wealthy investors.
  • Trading Forex is getting easier and extremely accessible with the advent of smartphone trading applications.

Bottom line

The Forex industry has changed significantly over the years. Many efforts are being made to create a legitimate trading environment as the industry has become more dynamic and ever-changing. Major European regulators are taking serious steps to tighten control of the Forex market. Besides, they are also introducing new rules to forbid high leverage trading to protect investor’s funds.

A known fact about Forex trading is that most traders fail. It is estimated that 96% of the people end up losing. To be in the succeeding 4%, one should have a disciplined approach to the way they trade. Some of the practices include starting with low capital, managing risk, controlling emotions, and accepting failures. If you follow these rules, you are on track to becoming a successful trader.

Also, education plays an essential role for someone to succeed in their Forex trading journey. We at Forex Academy designed a course just for our readers. By taking up this free course, one can learn everything about Forex trading even if they have zero experience. You can find all of our course articles here.

Got any questions? Let us know in the comments below.

Categories
Forex Course

2 – Preface To The Forex Market

Introduction

Forex AKA Foreign exchange is the largest market in the world where all the global currencies are traded. It can also be considered as a place where individuals, companies, and banks convert one currency into another. The entire Forex market is decentralized and is maintained by the banks across the globe. On average, the daily trading volume of the whole Forex market is more than $5 trillion. This explains the sheer size and liquidity of this market. Forex market is an essential part of the global economy and is active 24/5 (From Monday to Friday)

The Purpose

Typically, the exchange of goods and services happens for money, and this money is nothing but currency. The respective country’s governments determine the value of that currency. Hence the value of one country’s currency is never equal to that of another. This is the reason why we need foreign exchange to exchange one country’s currency to others. Forex market is essential for any of the global imports/exports to happen, for any employer who needs to pay salaries to their overseas employees, for a tourist who is traveling abroad, etc.

Forex trading

It refers to the buying and selling of currencies that belong to different countries. In Forex trading, the buying and selling of currencies happen at the same time. That is, if a trader is trading EURUSD pair, he/she is essentially selling the USD he has in order to buy Euros. Traders make a profit when they sell a currency at a higher price than the cost they paid to buy that particular currency. This entire process was complicated even a decade ago. But now, with the advent of technology, anyone can start trading by using a lot of online trading systems.

Currency Pairs

As discussed above, the buying and selling of currencies happen in pairs. There are three types of Forex currency pairs. They are Majors, Minors, and Exotics.

Major currency pairs are those where the USD is involved. These are the most frequently traded pairs in the market, and they make up to ~85% of the Forex transactions that happen in a day.

Examples: EUR/USD, USD/JPY, GBP/USD etc.

Minor currency pairs are those that don’t contain USD. They are also known as cross pairs. Euro, Pound, and Yen are the most popular currencies that make up the minor currency pairs.

Examples: EUR/CHF, AUD/JPY, GBP/CAD etc.

Exotic pairs are the ones where one is a major currency, and the other is a small or emerging currency.

Examples: USD/PLN, GBP/MXN, EUR/CZK etc.

Types of Forex markets

Spot market – The physical exchange of the currency pair takes place at the point of trade, i.e., as soon as the price is fixed between buyer and seller. The transaction is settled on the spot or at least within a short period of time.

Forward market – Here, a contract is made between the buyer and seller, where they agree upon a price to exchange the currency pair. This contract will be settled at a date in the future or within a range of future dates.

Futures market – Even in this type of market, a contract is fixed between the buyer and seller. A price is set on a future date delivery. The difference between Forward and Futures market is that in the latter, the contract is legally bonded between the parties.

That’s about the introduction to the Forex market. We hope you had a good read. In the next article, we will talk about some important Forex terms and phrases. Now, let’s see if you can get the below questions right.

[wp_quiz id=”41271″]