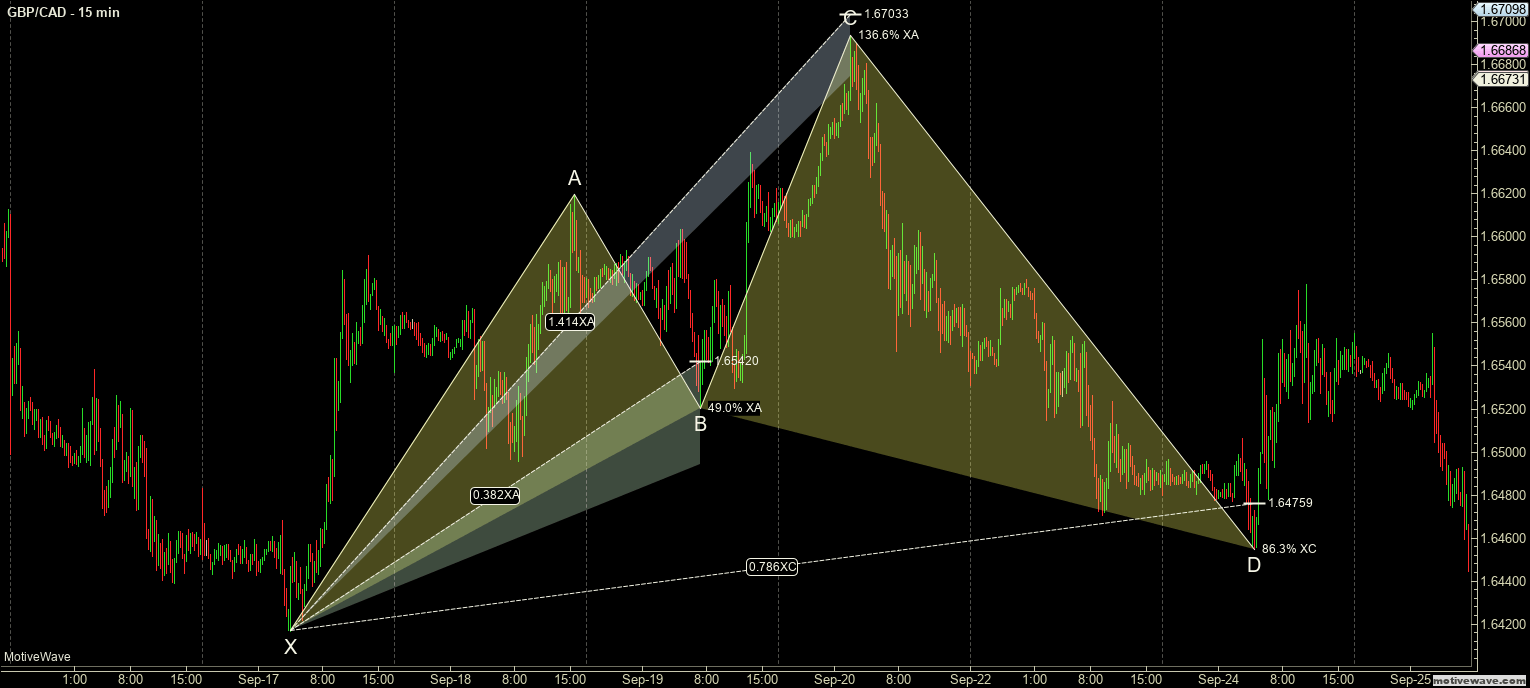
Gartley Harmonic Pattern Example: Cipher Pattern
Harmonics – Gartley Geometry
Out of the myriad of different approaches and methods of Technical Analysis, there seems to be one particular method that draws new traders to it more than Gartley Harmonics. People see these wonky triangles on a chart and automatically assume that because it looks so complicated and esoteric, they should probably learn these patterns right away. If that sounds like yourself, stop reading the remainder of this article and come back once you have learned the fundamentals of technical analysis. And certainly, don’t implement a new and complicated form of technical analysis like that harmonic geometry you’re your trading until you can look at a chart and tell what patterns exist just by glancing at it. Folks – I need to repeat this: Harmonic Geometry takes time to learn – this isn’t like learning about support and resistance. It’s not a topic that you can read about, understand, grasp, and learn in one weekend and then implement into your trading. The best way I could explain the time it takes to learn Carney’s harmonic structures is comparing it to the time it takes for a person to be able to look at a chart using the Ichimoku Kinko Hyo system and know, just by looking, if a trade can be taken and what the market is doing. That’s the best comparison I can find. Until you can look at a chart and within 10-20 seconds identify an important harmonic pattern on that chart – without having to draw it – then you should not use this in your trading. You need to become an expert in the analysis part before you start to trade with it.
I believe we should be calling these patterns Carney Harmonics or Gilmore Harmonics because Gartley never gave a name any designs – the genius work Bryce Gilmore and Scott Carney did that in his various Harmonic Trader series books. Scott Carney is the man who discovered and named a great many patterns and shapes that we see today. And Carney’s work is some of the most developed and contemporary work of Gann’s and Gartley’s that exists today. But the understanding and application of Carney’s and Gilmore’s patterns have been woefully implemented by many in the trading community. Any of you reading this section or who were drawn to it because of the words ‘harmonic’ or ‘Gartley’ must do two things before you would ever implement this advanced analysis into any trading plan:
- Read Profits in the Stock Market by H.M. Gartley – this is the foundation of learning and identifying harmonic ratios.
- Read Scott Carney’s Harmonic Trader series: Harmonic Trading: Volume 1, Harmonic Trading: Volume 2, and Harmonic Trading: Volume 3.
There are a series of other works by expert analysts and traders that address Gartley’s work and are worth reading, such as Pesavento, Bayer, Brown, Garrett, and Bulkowski. Do not consider their work merely supplementary – I find their work necessary to fully grasp the rabbit hole you are attempting to go down. Harmonic Patterns are an extremely in-depth form of analysis that encompasses multiple esoteric and contemporary areas of technical analysis. If you think finding the patterns and being able to draw them is sufficient to make a trading plan, you will lose a lot of money. Additionally, some words of wisdom from the great Larry Pesavento: An understanding of harmonics requires an in-depth knowledge of Fibonacci.
Harmonic Geometry, in a nutshell
In a nutshell, Harmonic Geometry is a study and analysis of how markets move and flow as a measure of proportion from prior price levels. These proportional levels are measured using Fibonacci retracements and extensions. When these patterns (triangles) complete, they create powerful reversal opportunities. Carney calls the end of these patterns PRZs – Potential Reversal Zones. The significant error that many new traders and analysts make when they find a complete pattern is the same problem many new traders make with any new tool, strategy, or method: they don’t confirm. Make no mistake: Harmonic Patterns are powerful. But like any analysis or tool, it is not sufficient to take a trade. Harmonic Pattern analysis is just one tool in your trading toolbox. And like any toolbox, you need multiple tools to tackle the various projects and goals you want to achieve.
Harmonic Trading Ratios
Contrary to popular belief, Gartley did not utilize Fibonacci levels or ratios in his work. Nonetheless, harmonic ratios are based on three classifications of harmonic ratios: Primary Ratios, Primary Derived Ratios and, Complementary Derived Ratios. As you develop a further understanding of the various patterns and their ratios, you will come to appreciate the very defined structure of this type of technical analysis.
Primary Ratios
- 61.8% = Primary Ratio
- 161.8% = Primary Projection Ratios
Primary Derived Ratios
- 78.6% = Square root of 0.618
- 88.6% = Fourth root of 0.618 or Square root of 0.786
- 113% = Fourth root of 1.618 or Square root of 1.27
- 127% = Square root of 1.618
Complementary Derived Ratios
- 38.2% = (1-0.618) or 0.618 squared
- 50% = 0.707 squared
- 70.7% = Square root of 0.50
- 141% = Square root of 2.0
- 200% = 1 + 1
- 224% = Square root of 5
- 261.8% = 1.618 squared
- 314% = Pi
- 361.8% = 1 + 2.618
Elliot Wave and Harmonic Geometry
Ellioticians are very aware of the strong connectedness that Gartley’s and Carney’s work has within Elliot Wave Theory. There are significant elements between the two types of technical analyses that create a mutual symbiosis. However, while they are very similar, it is crucial to understand that there are some significant differences between the two.
| Elliot | Gartley |
| Dynamic, Flexible. | Static, Definite. |
| Wave counts are more fluidly labeled. | Each move is labeled either XA, AB, BC, or CD. |
| Many variations and intepretations | No variation permitted. |
| Wave alignment varied and malleable. | Each price point alignment must be exact. |
The combination of Elliot and Gartley is powerful, and Gartley Harmonics can help confirm Elliot Waves. The following articles will describe, in further detail, specific Harmonic Patterns.
Sources: Carney, S. M. (2010). Harmonic trading. Upper Saddle River, NJ: Financial Times/Prentice Hall Gartley, H. M. (2008). Profits in the stock market. Pomeroy, WA: Lambert-Gann Pesavento, L., & Jouflas, L. (2008). Trade what you see: how to profit from pattern recognition. Hoboken: Wiley