Introduction
The Fibonacci tool was developed by Leonardo Pisano, who was born in 1175 AD in Italy. Pisano was one of the greatest mathematicians of the middle ages. He brought the current decimal system to the western world ( learned from Arab merchants on his trips to African lands). Before that, mathematicians were struggling with the awkward roman numerical system. That advancement was the basis for modern mathematics and calculus.
He also developed a series of numbers using which he created Fibonacci ratios describing the proportions. Traders have been using these ratios for many years, and market participants are still using it in their daily trading activities.
In today’s article, we will be sharing a simple Fibonacci Retracement Trading Strategy that uses Fibonacci extensions along with trend lines to find accurate trades. There are multiple ways of using the Fibonacci tool, but one of the best ways to trade with Fibonacci is by using trend lines.
With this Fibonacci trading strategy, a trader will find everything they need to know about the Fibonacci retracement tool. This tool can also be combined with other technical indicators to give confirmation signals for entries and exits. It also finds its use in different trading strategies.
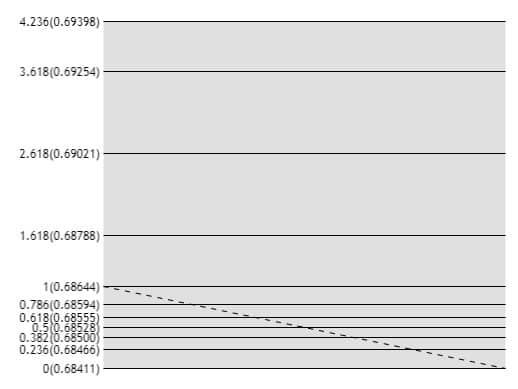
Below is a picture of the different ratios that Leonardo created. We will get into details of these lines as we start explaining the strategy.
Strategy Prerequisites
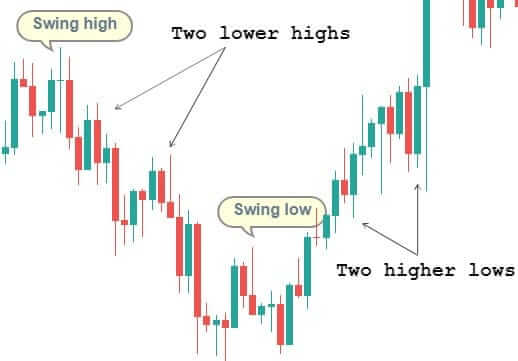
Most of the charting software usually comes with these ratios, but a trader needs to know how to plot them on the chart. Many traders use this tool irrespective of the trading strategy, as they feel it is a powerful tool. The first thing we need to know is where to apply these fibs. They are placed on the swing high/swing low.
- A swing high is a point where there are at least two lower highs to its right
- A swing low is a point where there are at least two higher lows to its right
If you are uncertain of what the above definitions meant, have a look at the below chart.
Here’s how it would look after plotting Fibonacci retracement on the chart.
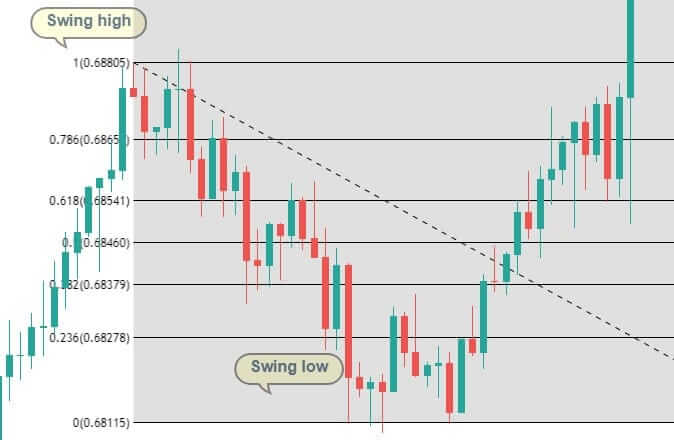
In an uptrend, it is drawn by dragging the Fibonacci level from the swing high all the way to swing low. In case of a downtrend, start with the swing high and drag the cursor down to the swing low. Let’s go ahead and find out how this strategy works.
The Strategy
This strategy can be used in any market, like stocks, options, futures, and of course, Forex as well. It works on all the time frames, as well. Since the Fibonacci tool is trend-following, we will be taking advantage of the retracements in the trend and profit from it. Traders look at Fibonacci levels as areas of support and resistance, which is why these levels could be a difference-maker to a trader’s success.
Below are the detailed steps involved in trading with this strategy
Step 1 – Find the long term (4H or daily time frame) trend of a currency pair
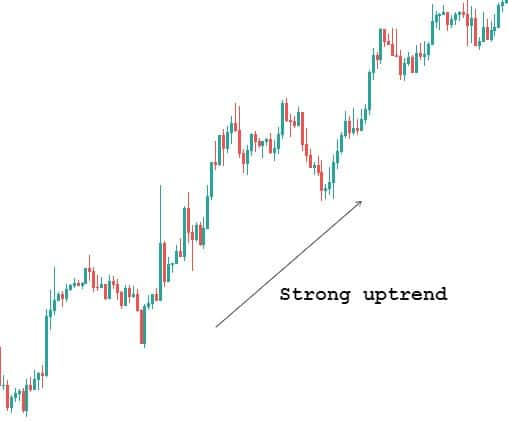
This is a very simple step but crucial, as well. Because we need to make sure if the market is either in an uptrend or a downtrend. For explanation purposes, we will be examining an uptrend. We will be looking for a retracement in the trend and take an entry based on our rules.
Step 2 – Draw a line connecting the higher lows. This line becomes our trendline.
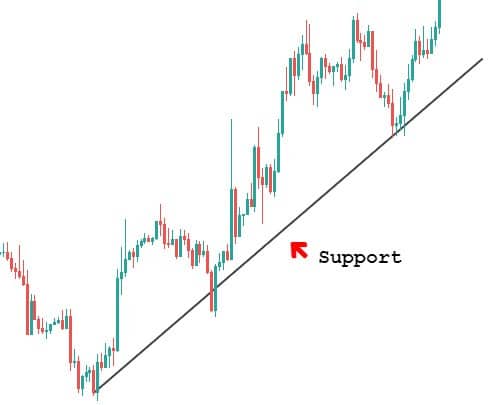
The trend line acts as support and resistance levels for us. In this example, we will be using it as support.
Step 3 – Draw the Fibonacci from Swing low to Swing high
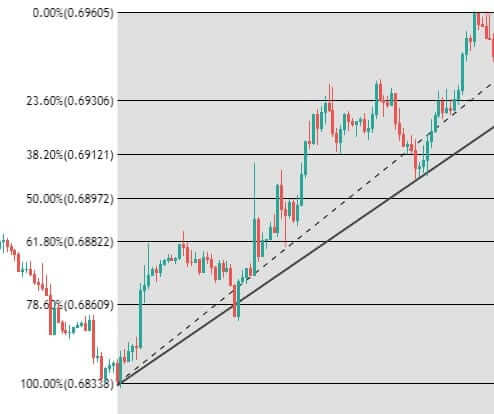
Use the Fibonacci retracement tool of your trading software and place it on swing low. Extend this line up to the swing high. Since it is an uptrend, we started with a 100% level at the swing low and ended with 0% at the swing high.
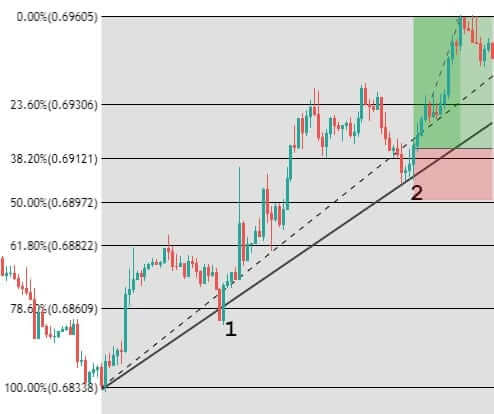
Step 4 – Wait for the price to hit the trend line between 38.2% and 61.8% Fibonacci levels.
In the below-given figure, we can see that the price is touching the trend line at two points (1 and 2). There is a significant difference between the two points. At point 1, the price touches the trend line between 78.6% and 100%, whereas, at point 2, the price touches the trend line between 38.2% and 61.8%.

The region between 38.2% and 61.8% is known as the Fibonacci Golden Ratio, which is critical to us. A trader should be buying only when the price retraces to the golden ratio, retracements to other levels should not be considered. Therefore, point 2 is where we will be looking for buying opportunities.
Step 5 – Entry and Stop-loss
Enter the market after price closes either above the 38.2% or 50% level. We need to wait until this happens, as the price may not move back up. However, it should not take long as the trend should continue upwards after hitting the support line.
For placing the stop loss, look at previous support or resistance from where the price broke out and put it below that. In this example, stop loss can be placed 50% and 61.8% Fibonacci level because if it breaks the 50% level, the uptrend would have become invalidated. The trade would look something like this.
Final words
The Fibonacci retracement tool is a prevalent tool used by many technical traders. It determines the support and resistance levels using a simple mathematical formula. Do not always rely only on Fibonacci ratios, as no indicator works perfectly alone. Use additional tools like technical analysis or other credible indicators to confirm the authenticity and accuracy of the generated trading signals. One more important point that shouldn’t be forgotten is not to use Fibonacci on very short-term charts as the market is volatile. Applying Fibonacci on longer time frames yield better results.
We hope you find this strategy informative. Try this strategy in daily trading activities and let us know if they helped you to trade better. Cheers!