Categories
Forex Course Guides

Forex Course 3.0 – Complete Guide

Hello everyone,

Firstly, we want to thank you guys for following us throughout the course so well. We feel privileged that we are helping you guys in becoming better traders. Especially in Course 3.0, we have discussed some of the most crucial aspects of technical trading, which are essential for every aspiring technical trader to know. We have seen the quiz results for all the course articles that you guys have taken, and that gave us a gist of how well you’ll be following the topics discussed.

However, for the people who want to revisit a few topics, we would like to make their lives easier. So we are putting up a list of topics that we have discussed in this course. Also, this article will act as a quick revision guide for all the basics involved in Technical Analysis.

In this course, we have started by discussing the concept of Candlesticks and its fundamentals. Then we learned how to trade various candlestick patterns along with their importance. Introduction to Fibonacci trading has been done, and we also have paired the Fib levels with various indicators to generate accurate trading signals. We extended that discussion to Moving Averages and its types. Finally, we have learned the principles of indicator-based trading, where at least 10 of the most popular indicators have been discussed.

Below are the corresponding links for each of the topics that we have discussed in this course.

Candlestick Charts

Concept of CandlesticksIntroduction | Anatomy | Fundamentals

Trading Candlestick PatternsSingle Continuous | Single Reversal | Dual Continuous                                                   Dual Reversal | Triple Continuous | Triple Reversal

Deeper InsightCandlestick Patterns Cheat Sheet | Candlestick + S&R
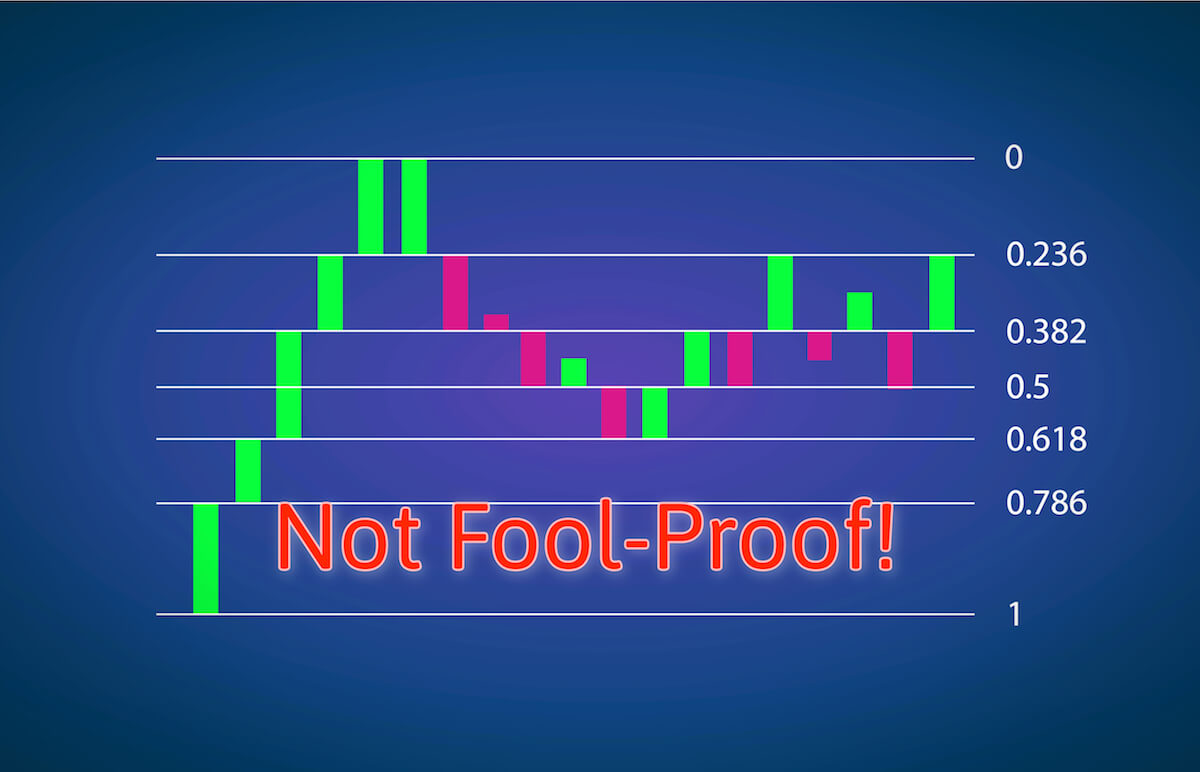
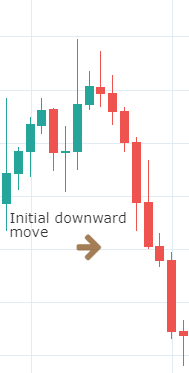
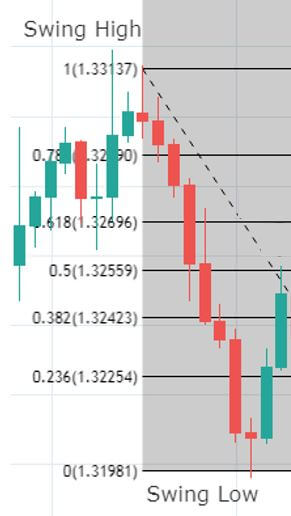
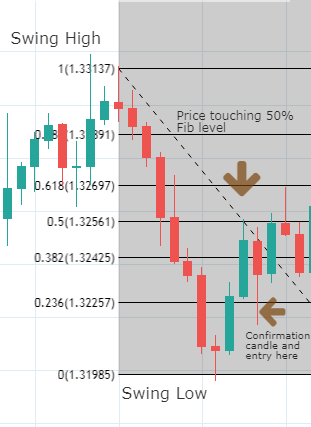
Fibonacci Trading

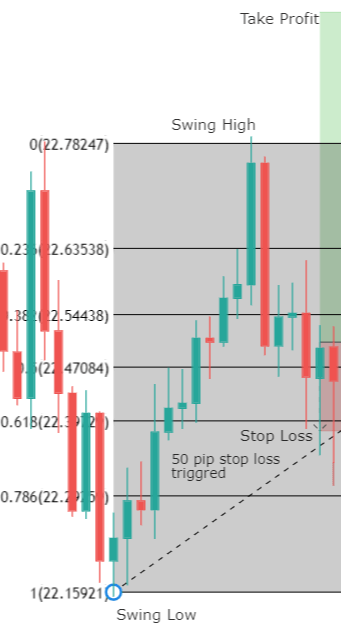
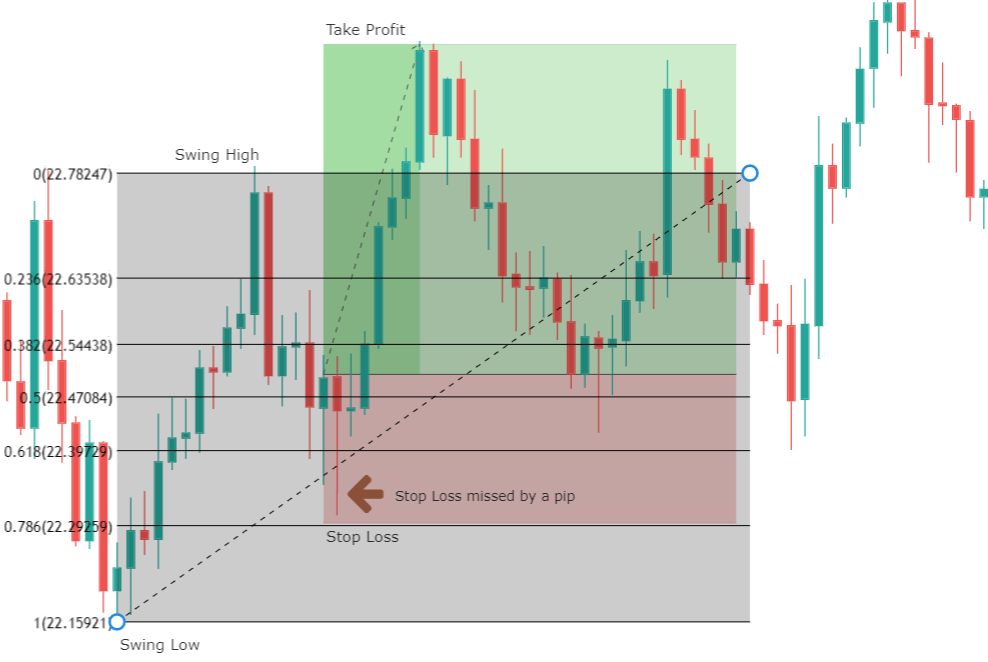
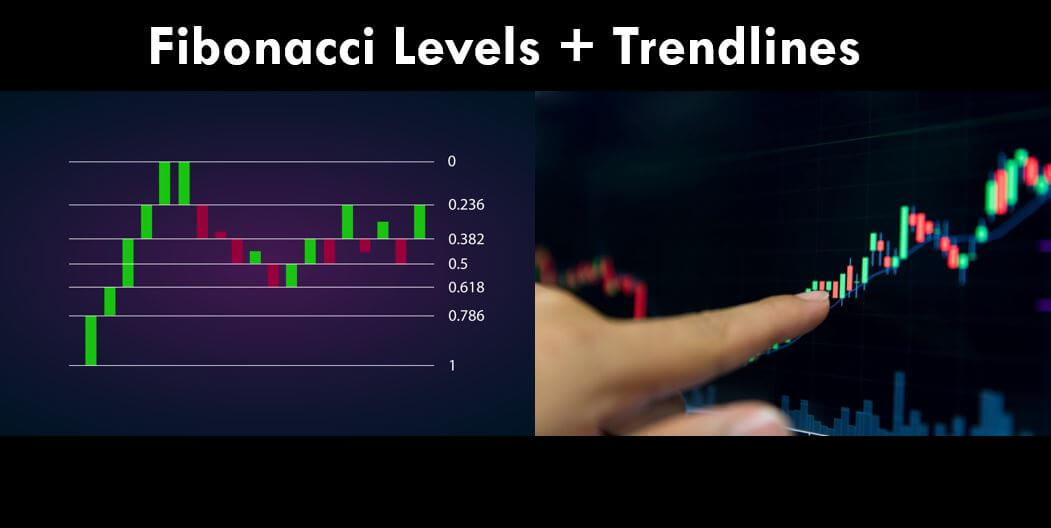
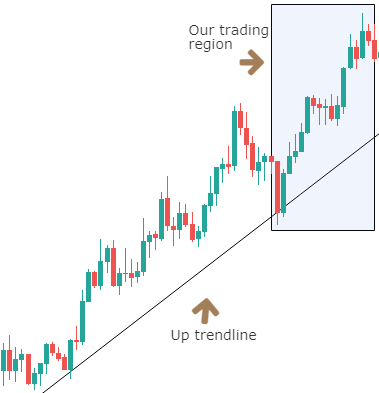
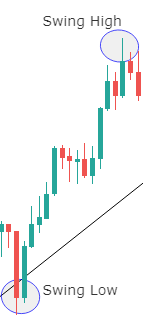
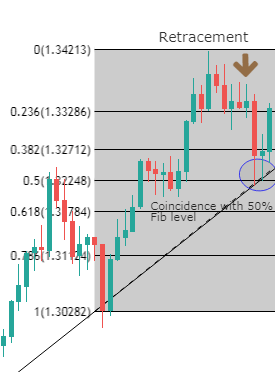
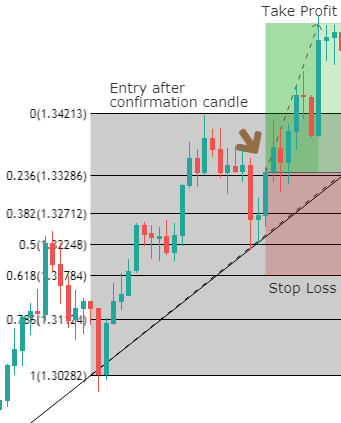
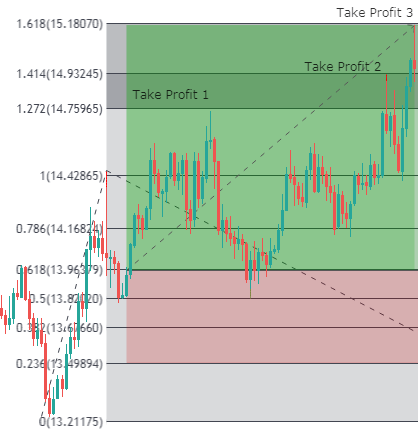
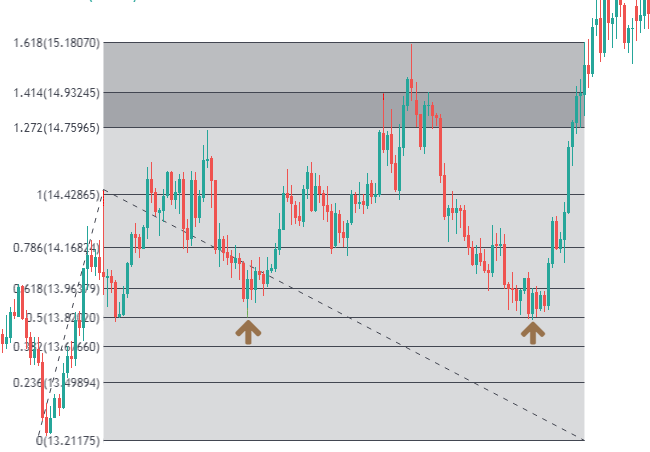
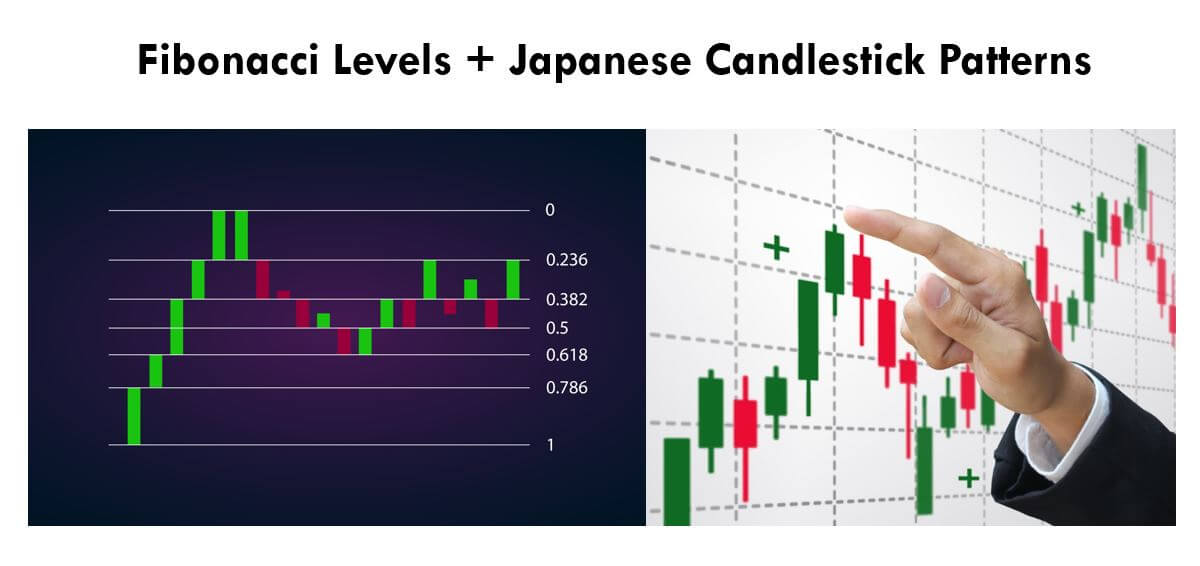
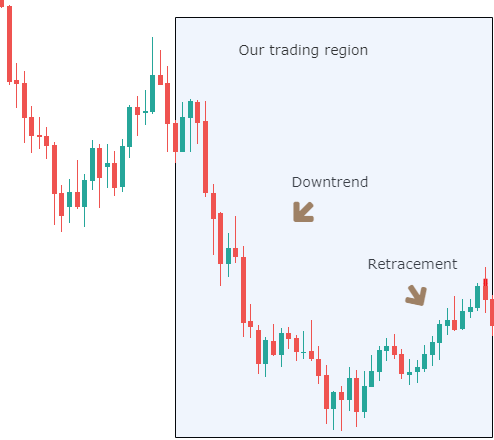
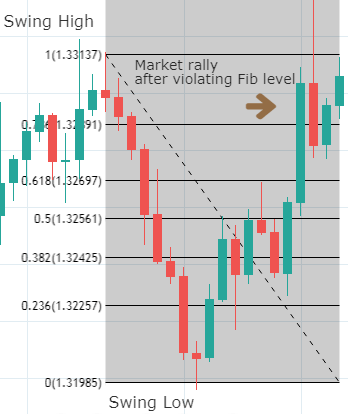
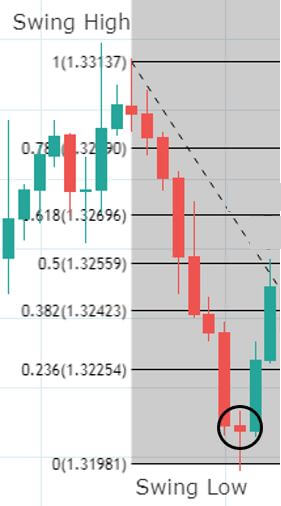
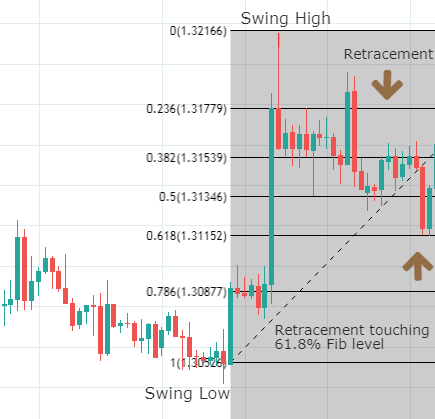
Introduction | Entry Using Fib Levels | Challenges of using Fib levels | Fib + S&R Candlestick Patterns + Fib Levels | Fib + Trendlines | Fib for TP & Fib for SL | Summary

Moving Averages

Introduction | SMA | EMA | SMA vs. EMA | MAs to identify the trend | MA Crossover Strategy | MA + S&R | Summary 

Indicator-Based Trading

Introduction | Pros & Cons | Bollinger Bands | RSI | MACD | Donchain Channel | RVI | TSI | Stochastic | Ichimoku Cloud | Parabolic SAR | ADX | ATR 

With this, we have ended our Course 3.0, and soon we will be starting our Course 4.0, where we will be discussing some of the advanced topics in Technical Trading. So stay tuned and watch this space for more interesting and informative content. Cheers!

Categories
Forex Course

69. Fibonacci Trading – Detailed Summary

Introduction

In the past eight lessons, we have learned many things about Fibonacci levels and ratios. We have understood various applications of these levels and identified many ways through which we can profit from these levels. In this article, we are going to summarize all the learnings related to Fibonacci. This article acts as a quick recap of what we have understood until now.

Taking a Trade Using Fibonacci Levels

Entering a trade using the Fibonacci levels is pretty straight forward. We have to wait for the price to retrace and reach the appropriate Fib levels. In an uptrend, these Fib levels are 50% and 61.8%. In a downtrend, these levels are 50% and 38.2%. Hence, both 61.8% & 38.2% are known as Golden Fib ratios. Once the price reaches these levels, you can enter a trade after getting a confirmation. A detailed explanation of this can be found in this article.

Pairing Fibonacci Levels With Other Technical Tools

Fibonacci levels can be used stand-alone to enter a trade. But it is always recommended to use other technical tools to be extra sure about your trades. This is because the Fib levels are not foolproof. That means the price may not respect these Fib levels 100% of the time. More about this can be understood here.

So, to be extra affirmative on what you are doing, make sure to combine the fib levels with other reliable indicators. Some of the tools we used to explain this concept are Support & Resistance levels, Trendlines, Candlestick Patterns, etc.

Using Fibonacci Levels For Risk Management

Not just for entires, Fibonacci levels can also be used for managing and exiting a trade. We know how important risk management is in trading. These levels will help us in managing risk and maximizing profit if used correctly. What we are trying to tell here is that Fib levels act as a perfect tool to place our Stop-Loss and Take-Proft orders accurately.

Fibonacci extensions must be used to decide the placement of various Take-Profit levels. To place accurate Stop-Loss, just used the Fib level, which is below the point of entry in an uptrend. Likewise, use the Fib level, which is above the point of entry in a downtrend. For a more detailed explanation, you can refer to the below articles.

Stop-Loss | Take-Profit

Downloading The Fibonacci Indicator

Fibonacci indicators these days are very well designed and readily available in the market for free. Almost all of the trading platforms are equipped with a Fibonacci indicator that can be accessed on to the charts with just a click. If you are using the TradingView platform, a comprehensive Fibonacci indicator is present in the left side panel. If you are a MetaTrader user, there are some default Fib indicators, but the best one is the Auto Fib, which can be downloaded here.

Other Applications Of Fibonacci Levels

The applications of the Fibonacci levels are not confined to the ones discussed above. There are many other places where these ratios & levels are used for various other reasons. For instance, to confirm almost all of the Harmonic patterns, we use Fibonacci levels. An example of one such article can be found here. In this example, we have confirmed the formation of the Butterfly pattern on the price charts by using Fibonacci levels alone. So every technical trader needs to know and learn how to use these levels to have the edge over financial markets.

That’s about Fibonacci levels. If you have any doubts, let us know in the comments below. In the upcoming course lessons, we will be discussing more technical tools like Moving Averages, Indicators, Oscillators, etc. Hence, stay tuned for more informative content.

Categories
Forex Course

68. Using Fibonacci Retracements To Place Appropriate Stop-Loss

Introduction

Until now, we have paired the Fibonacci levels with various technical tools to find appropriate trading opportunities. Some of them include support/resistance, trendlines, and even candlestick patterns. In the previous lesson, we also saw how to place appropriate ‘take-profit’ orders to maximize our profits. The uses of the Fibonacci levels do not end here. There is another incredible application of these levels, and that is to find the appropriate ‘stop-loss’ levels. ‘

As a trader, one should always use the ‘Stop-Loss’ orde as they are critical to avoid the risk of bearing huge losses. In some adverse situations, if this order is not used, it would result in a complete drain of trading capital where we can have the risk of losing everything in a single trade. Placing an appropriate stop-loss ensures that we do not expose ourselves to the unbearable risk.

However, placing the stop-loss order randomly might expose us to the risk of getting stopped out very early. So the proper placement of this order is crucial, and it can be hard for traders who aren’t experienced enough. So the Fibonacci tool can be a great help for us in determining accurate stop-loss levels.

Using Fibonacci Levels To Place Appropriate Stop-Loss Orders

In the below chart, we see a big initial move to the upside on which the Fibonacci levels are plotted using the Swing low and Swing high. Using the ‘Fibonacci strategy,’ we can notice a retracement that has reacted fairly well from the 61.8% Fib level, and now if the next candle is green, this could be a confirmation for us to go ‘long.’

We notice in the below chart that the next candle appears to be Green, and now with that confirmation, we can place our ‘buy’ trades with appropriate ‘stop-loss’ and ‘take profit.’ The traditional way of using a stop-loss order is to place it 50 pips away from the point of entry. Most of the novice traders use this method even today. This is said to be a layman’s approach with no suitable reasoning. When we use such methods, there is a high chance of we getting stopped out before the trade moves in our favor.

The below chart shows that how placing a 50 pip stop-loss can prove to be dangerous. We can see the stop-loss getting triggered by the immediate next candle after the entry was made.

Now let’s see how to place the stop-loss order using Fibonacci levels. The strategy is to place the stop-loss at the Fib level, which is below the Fib level from where the retracement reacts and gives a confirmation candle. Taking the above example, since the retracement touched the 61.8% Fib ratio and gave a confirmation candle, the stop-loss will be placed at the 78.6% Fib ratio. This seems to be very simple, yet most traders are not aware of this.

In the above chart, we can see how the price just misses our stop-loss placed at the 78.6 Fib level and later directly went to our take-profit. This shows the precision of stop-loss placement, which was established using the Fibonacci levels.

Conclusion

We must understand that stop-loss determination is a crucial step and has to be calculated mathematically using any reliable technical indicators. Indicators like Fibonacci have a mathematical approach in determining these levels. Make sure to use these levels before going to place your stop-loss levels next and let us know how they have worked for you. Cheers!

[wp_quiz id=”64961″]
Categories
Forex Course

66. Pairing The Fibonacci Levels With Trendlines

Introduction

In the previous articles, we learned how Fibonacci retracements give extra confirmations while trading the support & resistance levels. We also know that Fibonacci levels can be used as a confirmation tool to trade many candlestick patterns as well. Now we shall extend this discussion and understand how Fibonacci retracements can be traded using the trendlines.

Trendlines are a crucial part of technical analysis. They are primarily used to identify trends, be it up or down. Trendlines being such an important part of trading, when combined with the Fibonacci indicator, can produce trades that have the highest probability of winning. So let us see how this can be done.

Combining Fibonacci Levels & Trendlines

In the below chart, we have, firstly, identified an uptrend and drew a supporting trendline to it. The next step is to plot Fibonacci on the chart by identifying a swing low and a swing high. The marked area shows where all our trading is going to take place and the region in which we will find our swing low and swing high.

The traditional way of selecting a swing low is when the point intersects with the trendline, just as we have done in this case (below image). The swing high will be the point where the market halts and reverses for a while.

In the below chart, we have used the chosen a swing low and swing high to plot our Fibonacci indicator. In order to combine the Fibonacci with trendline, we must wait to see if the retracement from the swing high touches the 50% or 61.8% Fib level. After touching any of these levels, if the market gives a confirmation candle, it could be a perfect setup to go long. The retracement, in this case, touches the 50% level, which coincides exactly with the upward trendline. The next and final step is to look for a confirmation candle, if any.

We have gotten a confirmation sign from the market after the second green candle closes above the 23.6% Fib level (below image). Hence traders can now take risk-free positions on the ‘long’ side of the market with a stop-loss below the 61.8% Fib level and with an aggressive target above the recent high. This trade results in a risk to reward ratio of 1.5.

We should not forget that if the retracement does not take support at the 50% or 61.8% Fib level and goes further down, breaking all the levels, it could be a potential reversal sign. Thus the retracement that is coinciding with the trendline and reacting from 50% or 61.8% Fib level is the thumb of the rule of this strategy.

The above is a more widened image of the chart shows that the market continues to trend upwards, crossing our ‘take-profit‘ area. To take advantage of the market’s trending nature, we can place a trailing stop-loss order to maximize our profits.

Conclusion

When trends start to develop in the market, one should start looking for ways to go ‘long’ or ‘short’ by using necessary technical indicators that give a better chance of a profitable trade. The Fibonacci indicator is one such powerful tool to help traders find potential entry points. We hope you understood this concept clearly. Let us know if you have any questions in the comments below. Do not forget to take the quiz before you go. Cheers!

[wp_quiz id=”64779″]
Categories
Forex Course

67. Using Fibonacci Extensions To Place Accurate Take-Profit Orders

Introduction

We have discussed the many applications of the Fibonacci levels in our previous course lessons. Now its time to explore the scope of these levels in the most integral part of trading, which is money management. We are all familiar with the ‘take-profit’ order and also know how crucial it is to determine the same before entering a trade.

There are numerous ways to determine the ‘take-profit‘ levels to maximize our profits, but the Fibonacci levels are said to be extremely accurate. In this article, we will validate the accuracy of the Fibonacci indicator in determining the ‘take-profit’ levels.

Placing Accurate Take-Profit Order Using Fib Levels

To find a trade, we need first to establish a significant trend. The primary trend could either be a continuation of a previous trend or beginning of a new trend after a market reversal. In the below chart, we can observe the market reversal to the upside. We must wait for its retracement; if the retracement follows all the rules of our Fibonacci strategy (discussed in the Fibonacci article), we can proceed to take the trade.

In the below image, we can notice a pullback coming in from the swing high. We will be evaluating this swing high using the Fibonacci levels. The Fibonacci levels used in this particular strategy for determining the accurate ‘take-profit’ placement are different from the usual Fibonacci levels we used in all the previous articles.

We are going to use ‘Fibonacci Extensions’ instead of retracements here. These extensions can be plotted on to the charts by using an indicator that can be found in most of the trading platforms. We use the Tradingview platform for our charting purpose, and this indicator can be found on the drawing panel of TradingView. It is available in the sub-menu of the Fibonacci tool folder and named as ‘Trend-Based Fib Extension.

To plot Fibonacci extension on the chart, first, click on a significant low, then drag the cursor and click on the recent high. Finally, drag the cursor back to the swing low. We can also highlight the Fib ratios by clicking on the retracement levels. Don’t forget to include the Fib ratios on the chart that are above 100%, as our take-profit methodology is based on those ratios.

The below chart shows how the Fibonacci Extensions are plotted on the chart using the swing low and swing high. We also see from the chart that the retracement is exactly reacting from the 50% Fib levels, which could a sign of trend continuation. But to be sure, it is prominent to have a confirmation candle at this place.

We get a bullish confirmation candle in the direction of the dominant trend, after which a potential trade entry can be made to the ‘buy’ side.

Right after entry, it is essential to determine our take-profit and stop-loss areas. Here is the part where we will be using our Fibonacci Extensions. The strategy is to take some profits at 127%, and then at 141% and remaining profits at 161%.

The take-profit points are clearly shown in the below chart. One can see that the market falls exactly after touching the respective Fib extension levels. By following this method, one can maximize their gains by taking profits at every subsequent point. The risk to reward ratio in this trade is also outstanding.

The below chart shows that the market continues to take support at the 50% fib level and eventually breaks out above our final take-profit order. The trend has completely reversed from a downtrend to an uptrend.

Conclusion

The Fibonacci tool can be used to find potential exit points in a trade with a great degree of accuracy. Hence, rather than taking a simple approach to determining the target points of the trade, we must make use of Fibonacci Extention levels to maximize our grains. Please remember that these extensions are not guaranteed levels too. So it is important not to depend upon them completely. Cheers!

[wp_quiz id=”64724″]
Categories
Forex Course

65. Combining Fibonacci Levels With Candlestick Patterns

Introduction

In the previous lessons, we understood how Fibonacci levels could be combined with trendlines to generate confirmation signals. After discussing many applications of the Fibonacci indicator, we are now ready to explore some complex strategies using these levels. In this lesson, we will be discussing how the Fibonacci levels can be used with Japanese candlestick patterns.

The candlestick patterns are an intrinsic part of trading, and we cannot ignore them. We have learned many candlestick patterns in the previous lessons, and you can find them starting from here. We have also learned that these patterns can not be used stand-alone, and we should be using any reliable indicators to confirm the signals generated by these patterns. So we will be using Fibonacci retracements to confirm the opportunities generated by the chart patterns.

For the explanation purpose, let’s discuss one of the most reliable candlestick patterns – Dark Cloud Cover. To know more about this pattern, you can refer to the second part of this article. We will be trading the market today by combining both Fibonacci levels and the Dark Cloud Cover pattern.

Strategy – Dark Cloud Cover Pattern + Fibonacci Levels 

For explaining the strategy, we considered a downtrend, on which we will be plotting our Fibonacci indicator and later evaluate its retracement. The below chart shows the same with a trading region in which we will be identifying our swing high and swing low. We will also see if the retracement shown in the chart is going to react at the important Fib levels.

In the below chart, we can see the market has moved down quite swiftly from the swing high to swing low. This shows the strength of the underlying downtrend. Trading a retracement of a strong and big move on any side is always preferable. The next step is to plot the Fibonacci levels on the chart.

After the Fibonacci indicator is rightly plotted as shown in the below chart, let’s see what happens at the important Fibonacci levels, such as 50% or 61.8% level. In the chart below, we see that the last Red candle of the retracement exactly touches the 50% level and closes midway of the previous Green candle.

These two candles together remind us of one of the very well known candlestick patterns – The Dark Cloud Cover. More importantly, this pattern is formed exactly at the 50% Fib level. So if we get a confirmation to the downside, it could result in a perfect setup to go short on this pair.

In the above picture, we can clearly see the formation of a bearish confirmation candle. So we can confidently take short positions in the market by placing a stop-loss near the 61.8% level with a target below the recent low.

The above chart shows how the trade works in our favor by hitting our pre-determined ‘take profit.’ We can see that, right after the entry was made, the market moves so fast in the direction of the trend producing continuous red candles. This shows the accuracy of candlestick patterns when combined with indicators like Fibonacci. Since the market is still in a strong downtrend, aggressive traders can take profit at the second or third swing low of the trend, after crossing the initial ‘take-profit.

Conclusion

From the previous articles, we have seen how the Fibonacci tool can be used with support resistance levels, trendlines, and now even candlestick patterns. By this, we can be assured that the Fibonacci tool is potent and should never be underestimated. Instead, we recommend you to widen its usage in technical analysis to identify more accurate trading opportunities.

[wp_quiz id=”64541″]
Categories
Forex Course

63. Reasons Why We Should Never Completely Depend On Fib levels?

Introduction

In the previous article, we learnt how exactly to trade using the Fibonacci levels. There are many other ways through which Fib levels can be traded. Some of them include trading these levels using S&R, Trendlines, and even candlestick patterns. Before learning all of these ways, we must know that these levels are not guaranteed and cannot be traded stand-alone. So in this article, let’s discuss why one should be very careful while trading Fibonacci retracements.

Fibonacci Levels Will Not Be Respected Always

Every technical level ultimately breaks at a certain point in time, and that is the case with Fibonacci levels as well. In the previous article, we had learnt that Fibonacci levels also act as potential support and resistance areas. So these levels do break just as how S&R levels break. Therefore we must keep in mind that these levels are not foolproof.

Let’s understand this with the help of an example. But before that, make sure to read our article on ‘How to trade Fib retracements’ to understand this better. You can find that lesson here.

In the price chart below, we can see an initial big move to the downside. So basically, here we must wait for the retracement, and that retracement must touch the Fibo levels. Let’s see what happens in the next step.

We saw the retracement (below chart) of the downward move, and we have placed the Fib levels from swing high to swing low since it is a downtrend.

Then we can see the retracement reaching the 50% Fib level and holding there. Ideally, at this point, the retracement must stop, and the market’s original downtrend should continue. Also, we should be placing our ‘sell’ trades as the Red confirmation candle can clearly be seen.

But, to our surprise, we observe that the price did not respect our strategy, and the market shot up to the north, violating all the Fibonacci levels, as shown in the below chart.

While Fibonacci retracement levels give us a high probability of the trade working in our favor, like any other technical analysis tool, they don’t always work. One can never be entirely certain that the price will respect the 50% or 38.2% or any Fibonacci level for that matter.

If you are an experienced technical trader, you wouldn’t have placed a sell trade in the above scenario. It was clear that the sellers are losing momentum. The formation of a bearish Doji candle at the bottom (below chart) is another confirmation of a trend reversal.

So we should be looking at the bigger picture, or we should take the help of any other technical tools to confirm the signals generated by the Fibonacci levels. Never completely depend on them.

Conclusion

Apart from the things that we discussed above, there is another issue while using these Fib ratios, which is determining the appropriate swing low and swing high. Everyone looks at charts differently. They trade at different time frames and have their own fundamental reason for buying or selling the currency pair.

Swing high for one trader might likely be different than swing high for another. And when the Fib ratios are placed incorrectly, of course, the trading signals generated won’t be accurate. Also, the prerequisite for Fibonacci trading is trending markets. When the market is in a consolidation or moving sideways, it is obviously not possible to trade with these ratios.

We hope you understood this lesson well. If you find this complicated or if you have any questions, please let us know in the comments below. Cheers.

[wp_quiz id=”64257″]
Categories
Forex Course

62. Using Fibonacci Retracements To Enter A Trade

Introduction

In the previous article, we understood the definition of Fibonacci and how the Fibonacci levels are derived. Now we shall see how to use these levels to enter a trade and formulate a trading strategy around it.

The strategy we are going to discuss can be used not just in the Forex market. It can also be used in different other markets such as Stocks, Commodities, Cryptocurrencies, and ETFs. This is essentially a trend trading strategy that takes advantage of a pullback in a trend. The Fibonacci levels later prove to be critical areas of support and resistance that most traders keep a close watch on. Let’s get started with the strategy.

Step 1: Identify an initial big move. We are going to trade its retracement.

A trend helps the traders to identify the direction of the market and to determine where the market will head further. A big price movement indicates that the market has reversed from its original direction and will possibly continue further in that direction.

In this example, we have identified a big move on the upside, and we shall see how to trade its retracement to join the trend. Let’s use Fibonacci levels to enter the trend at the right time.


Step 2: Use the Fibonacci tool and plot the levels on the chart

After placing Fibonacci levels on the chart, we need to wait for a retracement and see where it touches the Fib levels. The most desirable condition is when the price bounces off after touching the 50% or 61.8% fib ratio. These ratios are also known as Golden Fib ratios. In the below chart, we can see the formation of a bullish candle as soon as the Red candle reaching the 61.8% level.

In an uptrend, always make sure to plot the Fib levels from Swing Low to Swing High. Likewise, in a downtrend plot, the Fib levels on the chart from Swing High to Swing Low.

Step 3: Enter only after confirmation 

Typically, traders are taught to place their buy orders as soon as the price reaches the 61.8% level. Do not do that. Only place the trades after the appearance of at least a couple of bullish candles. In the below chart, the formation of a green candle at 61.8% gives us an additional confirmation that the trend is going to continue after the retracement. Traders can also confirm this buy signal by using reliable technical indicators. This is how the chart would look at the time of entering the trade.

Step 4: Take-Profit and Stop-Loss placement

It is important to place accurate Stop-Loss and Take-Profit orders to mitigate the risk and maximize profits. In this strategy, stop-loss is placed just below the 61.8% Fib level. If the price breaks this Fib level, the uptrend gets invalidated, and we can expect the beginning of a downtrend.

We can place the take-profit order at the nearest’ high’ of the uptrend and trail the stop-loss until it is triggered. The minimum risk to reward of this trade is 1:1, which is not bad. But since it is a continuation of the trend, we can wait until it makes a new high and take profits there. This will result in a 1:2 risk to reward trade.

Below is how the setup of the final trade looks like.

We can clearly see the price respecting the Fibonacci levels, and the trade here went exactly the way we predicted.

Conclusion

Fibonacci retracements are a part of the trend trading strategy that most traders observe during an uptrend. Traders try to make low-risk entries in the direction of the trend using these Fibonacci levels. It is believed that the price is highly likely to bounce from the Fibonacci levels back in the direction of the initial trend. These Fib levels can also be used on multiple time frames. When this tool is combined with other technical indicators, we can predict the outcome of the trade with a greater degree of accuracy.

[wp_quiz id=”63028″]