Categories
Forex Course

65. Combining Fibonacci Levels With Candlestick Patterns

Introduction

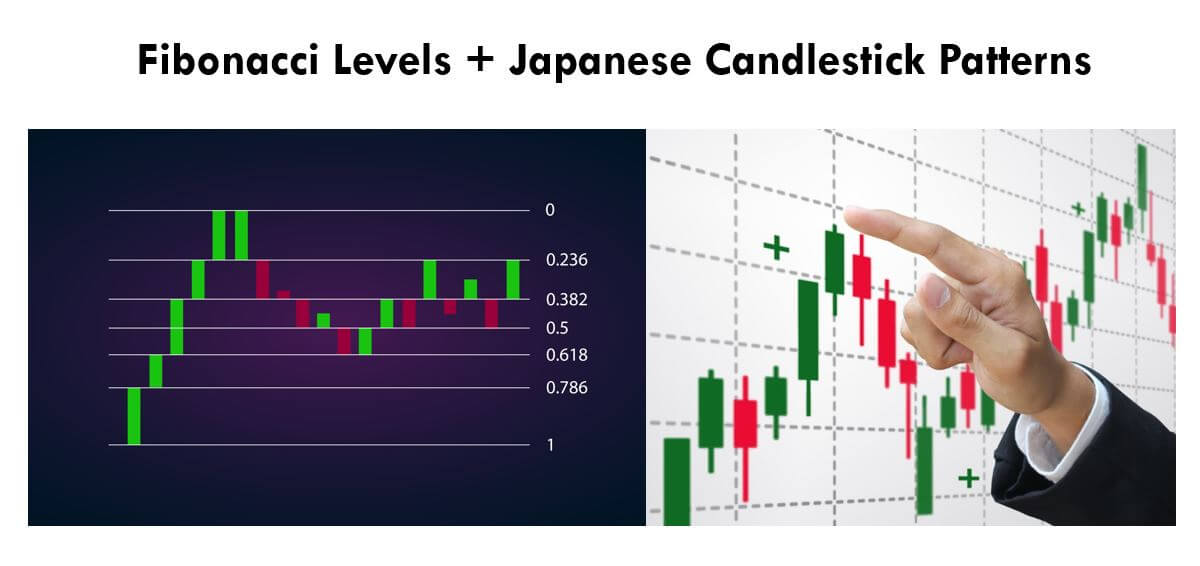
In the previous lessons, we understood how Fibonacci levels could be combined with trendlines to generate confirmation signals. After discussing many applications of the Fibonacci indicator, we are now ready to explore some complex strategies using these levels. In this lesson, we will be discussing how the Fibonacci levels can be used with Japanese candlestick patterns.

The candlestick patterns are an intrinsic part of trading, and we cannot ignore them. We have learned many candlestick patterns in the previous lessons, and you can find them starting from here. We have also learned that these patterns can not be used stand-alone, and we should be using any reliable indicators to confirm the signals generated by these patterns. So we will be using Fibonacci retracements to confirm the opportunities generated by the chart patterns.

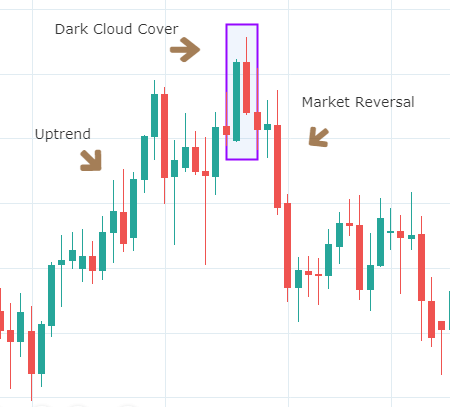
For the explanation purpose, let’s discuss one of the most reliable candlestick patterns – Dark Cloud Cover. To know more about this pattern, you can refer to the second part of this article. We will be trading the market today by combining both Fibonacci levels and the Dark Cloud Cover pattern.

Strategy – Dark Cloud Cover Pattern + Fibonacci Levels 

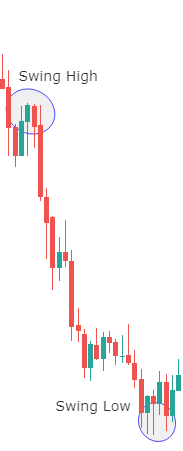
For explaining the strategy, we considered a downtrend, on which we will be plotting our Fibonacci indicator and later evaluate its retracement. The below chart shows the same with a trading region in which we will be identifying our swing high and swing low. We will also see if the retracement shown in the chart is going to react at the important Fib levels.

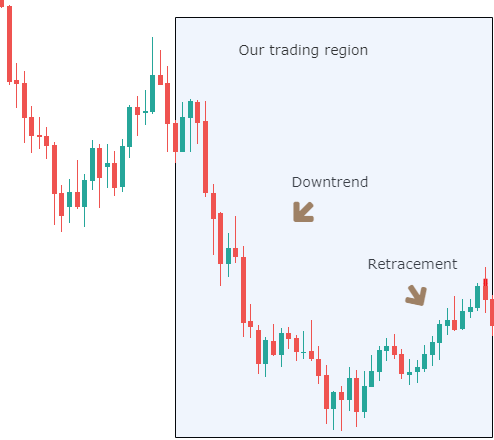
In the below chart, we can see the market has moved down quite swiftly from the swing high to swing low. This shows the strength of the underlying downtrend. Trading a retracement of a strong and big move on any side is always preferable. The next step is to plot the Fibonacci levels on the chart.

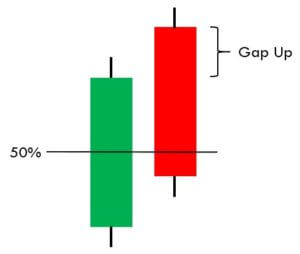
After the Fibonacci indicator is rightly plotted as shown in the below chart, let’s see what happens at the important Fibonacci levels, such as 50% or 61.8% level. In the chart below, we see that the last Red candle of the retracement exactly touches the 50% level and closes midway of the previous Green candle.

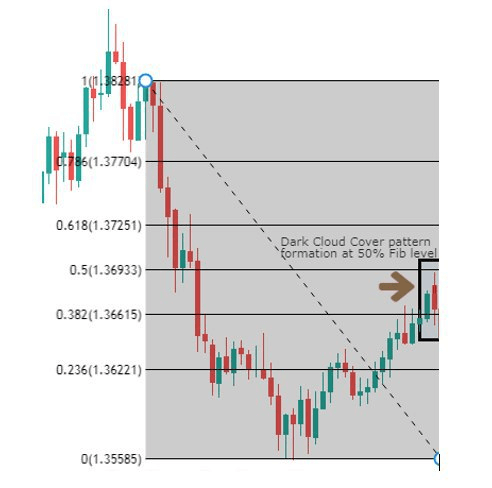
These two candles together remind us of one of the very well known candlestick patterns – The Dark Cloud Cover. More importantly, this pattern is formed exactly at the 50% Fib level. So if we get a confirmation to the downside, it could result in a perfect setup to go short on this pair.

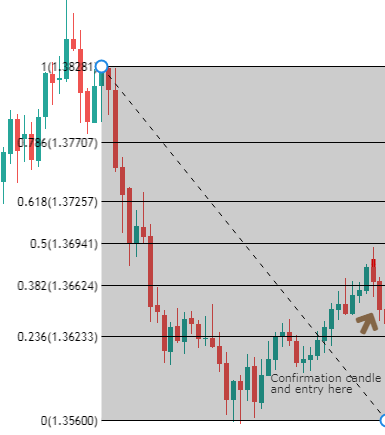
In the above picture, we can clearly see the formation of a bearish confirmation candle. So we can confidently take short positions in the market by placing a stop-loss near the 61.8% level with a target below the recent low.

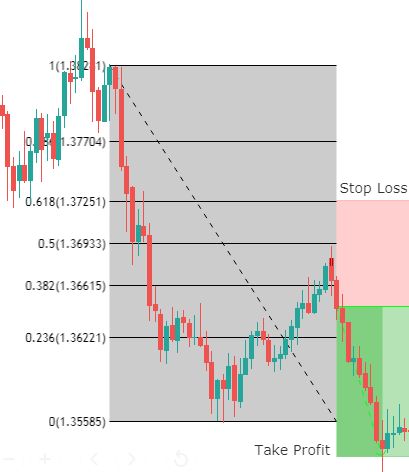
The above chart shows how the trade works in our favor by hitting our pre-determined ‘take profit.’ We can see that, right after the entry was made, the market moves so fast in the direction of the trend producing continuous red candles. This shows the accuracy of candlestick patterns when combined with indicators like Fibonacci. Since the market is still in a strong downtrend, aggressive traders can take profit at the second or third swing low of the trend, after crossing the initial ‘take-profit.

Conclusion

From the previous articles, we have seen how the Fibonacci tool can be used with support resistance levels, trendlines, and now even candlestick patterns. By this, we can be assured that the Fibonacci tool is potent and should never be underestimated. Instead, we recommend you to widen its usage in technical analysis to identify more accurate trading opportunities.

[wp_quiz id=”64541″]
Categories
Forex Course

55. Learning The Dual Candlestick Patterns – Part 2 (Reversal)

Introduction

In the previous lesson, we learned Continuous Dual Candlestick Patterns by taking examples of the two most traded patterns. In this lesson, we will see how to generate trading signals using Dual Candlestick reversal patterns. We will mainly look at the two widely used dual candlestick patterns – Engulfing and Dark Cloud Cover patterns. As the names suggest, both of these patterns consist of two candlesticks, and when we see them on a price chart, we should be anticipating a trend reversal shortly.

Engulfing Candlestick Pattern 

Engulfing is a two-candle trend reversal pattern. It got its name from the fact that the second candle completely engulfs the first candle, irrespective of its size. There are both Bullish Engulfing and Bearish Engulfing patterns. A Bullish Engulfing can be identified when a small (preferably) red candle of the downtrend is followed by a large green candle that overpowers the previous candle entirely. Vice-versa for a Bearish Engulfing Pattern.

Below is the picture of how the Bullish Engulfing pattern looks like on a chart.

Criteria for the pattern

  • The body of the second candle should be at least twice the size of the first candle.
  • Even though it is a dual-candlestick pattern, Bullish Engulfing gives the best reversal signals when the bullish candle engulfs the bodies of four or more previous candlesticks.
  • It is better if the Engulfing candle does not have any upper wicks. This shows the buying interest among investors and increases the likelihood of Green candles in the following days.

The Bullish Engulfing Pattern is a powerful reversal pattern that has the potential to reverse the current downtrend and turn it into an uptrend. Hence, traders always look out for this pattern and take big positions in the market by adding to their ‘long’ positions.

Dark Cloud Cover Candlestick pattern

The Dark Cloud Cover pattern is a bearish reversal candlestick pattern that is formed from two candles. In this pattern, the Red candle opens above the close of the prior candle and then closes below the midpoint of the previous green candle.

This pattern implies that buyers are trying to push the price higher, but sellers finally take over and push the price sharply down. A shift in momentum causes the trend to reverse, and this marks the beginning of a new downtrend.

Below is an image of the Dark Cloud Cover pattern that makes a reversal of the trend.

Criteria for the pattern

  1. The first requirement is to have an uptrend that is clearly visible on any chart.
  2. The second candle should be a gap up that, by the end of the day, comes down and closes as a bearish candle.
  3. The bearish candle needs to close below the midpoint of the previous bullish candle.

Traders usually wait for confirmation before taking aggressive short positions in the underlying Forex pair. The confirmation is just another Red candle following the first Red candle. On the close of the third candle, traders sell the currency and exit on the following days as the price continues to decline. They place stop-loss just above the high of the bearish candle.

Conclusion

The Engulfing pattern is a bullish reversal pattern, which is one of the easiest patterns to identify and trade. Talking about the bearish reversal Dark Cloud Cover pattern, it has the potential to identify the lower lows and lower highs, which is very rewarding on the downside. This was about the Dual Candlestick reversal patterns. Please explore more patterns of this kind to increase your exposure. In the next lesson, we will talk about the triple candlestick patterns and their types. Cheers!

[wp_quiz id=”60890″]
Categories
Candlestick patterns Forex Candlesticks

Candlestick Reversal Patterns: Refresh your Knowledge

After our last articles on candlestick reversal patterns, test your knowledge.

If you need to give a second read, these are the links:


Let’s begin


[wp_quiz id=”59882″]


Reference:

The Candlestick Course: Steve Nison