Introduction
In the previous lesson, we discussed some basic single candlestick patterns, which gave us trend continuation signals. In this lesson, we will look at reversal patterns that are formed by a single candlestick and how traders should perceive them.
These patterns are very important to learn as they indicate clear market reversals. So essentially, when we find these patterns on the charts, we should anticipate a reversal and take our trades accordingly.
The Hanging Man Candlestick Pattern
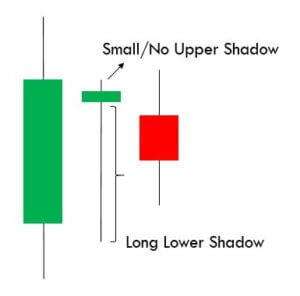
A Hanging Man is a single candlestick pattern that occurs during an uptrend. They give warning signals that markets are going to fall. This candlestick pattern is composed of a small body, a long lower shadow, and no upper shadow. Since it is a reversal pattern that reverses the current uptrend, The Hanging Man indicates the selling pressure that is starting to increase. Below is how the Hanging Man candlestick would look like.
 Below is a picture of how this pattern would like on the chart and how the trend reversal takes place.
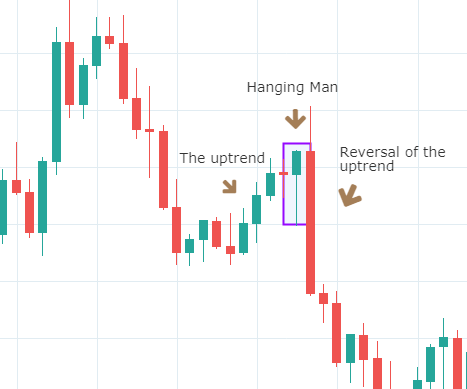
Pattern Confirmation Criteria
- Hanging Man is a single candlestick pattern that forms after a small rally in the price. The price rally can also be big, but it should at least be composed of few candles moving higher overall.
- The candle must have a small body and a lower shadow at least twice the size of the real body.
- This pattern is only a warning and a bearish candle after the formation of this pattern is highly desired. This is necessary for the Hanging Man pattern to prove to be a valid reversal. This is called confirmation.
The Hanging Man pattern is used by traders to exit long positions or enter into new short positions. After entering for a short position, stop loss can be placed above the high of the Hanging Man candle.
The Shooting Star Candlestick Pattern
A Shooting Star is a bearish single candlestick pattern which also indicates a market reversal. It has a long upper shadow with little or no lower shadow and a small body.
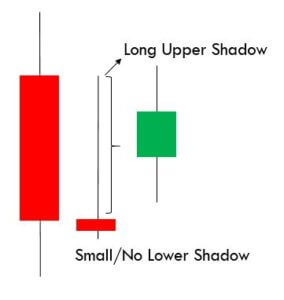
This pattern typically occurs after an uptrend and forms near the lowest price of the day. The Shooting Star pattern can be seen as the market creating potential resistance around the price range. It implies that the sellers stepped in, erasing all the gains, and pushed the price near the open. Basically, at the appearance of this pattern, buyers are losing control, and sellers are taking over.
Below is a picture of how the pattern would look like on a chart
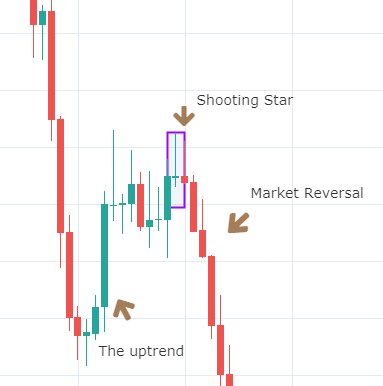
Pattern Confirmation Criteria
- The pattern must appear after an advance in price. The price must rally in at least alternate green and red candles if not in all green candles.
- The distance between the highest price of the candle and the opening price must be twice the length of the body of the candle.
- It is best if there is no shadow below the body of the candle.
Traders should not take immediate action after the formation of this pattern. They should wait to see what the next candle does following the Shooting Star. If they see a further price decline, they may sell or short that currency pair. However, if the price continues to rise, it means the uptrend is still intact. So traders must favor long positions over shorting.
The difference between the Hanging Man and the Shooting Star is in the length of upper and lower shadows along with the context. By now, we have understood how continuous and reversal single candlestick patterns work. In the upcoming lessons, we will be learning dual candlestick patterns and their implication. Cheers! [wp_quiz id=”60770″]

