Categories
Forex Course

69. Fibonacci Trading – Detailed Summary

Introduction

In the past eight lessons, we have learned many things about Fibonacci levels and ratios. We have understood various applications of these levels and identified many ways through which we can profit from these levels. In this article, we are going to summarize all the learnings related to Fibonacci. This article acts as a quick recap of what we have understood until now.

Taking a Trade Using Fibonacci Levels

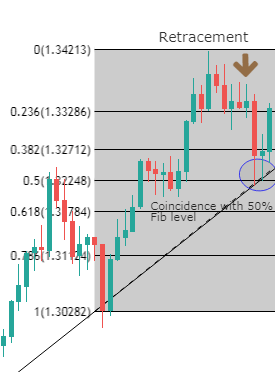
Entering a trade using the Fibonacci levels is pretty straight forward. We have to wait for the price to retrace and reach the appropriate Fib levels. In an uptrend, these Fib levels are 50% and 61.8%. In a downtrend, these levels are 50% and 38.2%. Hence, both 61.8% & 38.2% are known as Golden Fib ratios. Once the price reaches these levels, you can enter a trade after getting a confirmation. A detailed explanation of this can be found in this article.

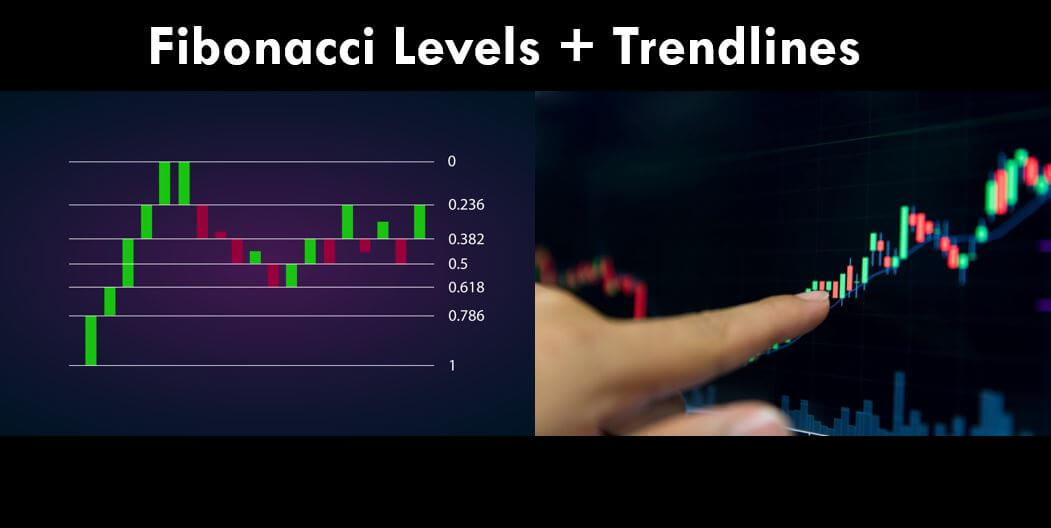
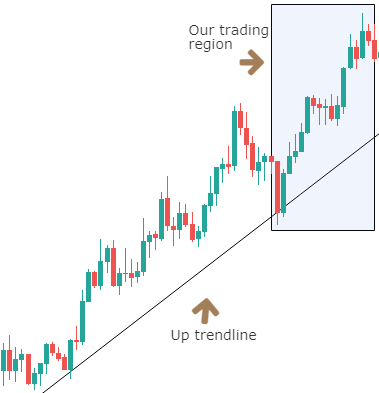
Pairing Fibonacci Levels With Other Technical Tools

Fibonacci levels can be used stand-alone to enter a trade. But it is always recommended to use other technical tools to be extra sure about your trades. This is because the Fib levels are not foolproof. That means the price may not respect these Fib levels 100% of the time. More about this can be understood here.

So, to be extra affirmative on what you are doing, make sure to combine the fib levels with other reliable indicators. Some of the tools we used to explain this concept are Support & Resistance levels, Trendlines, Candlestick Patterns, etc.

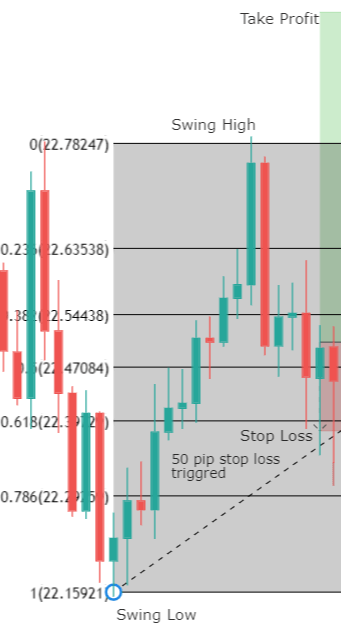
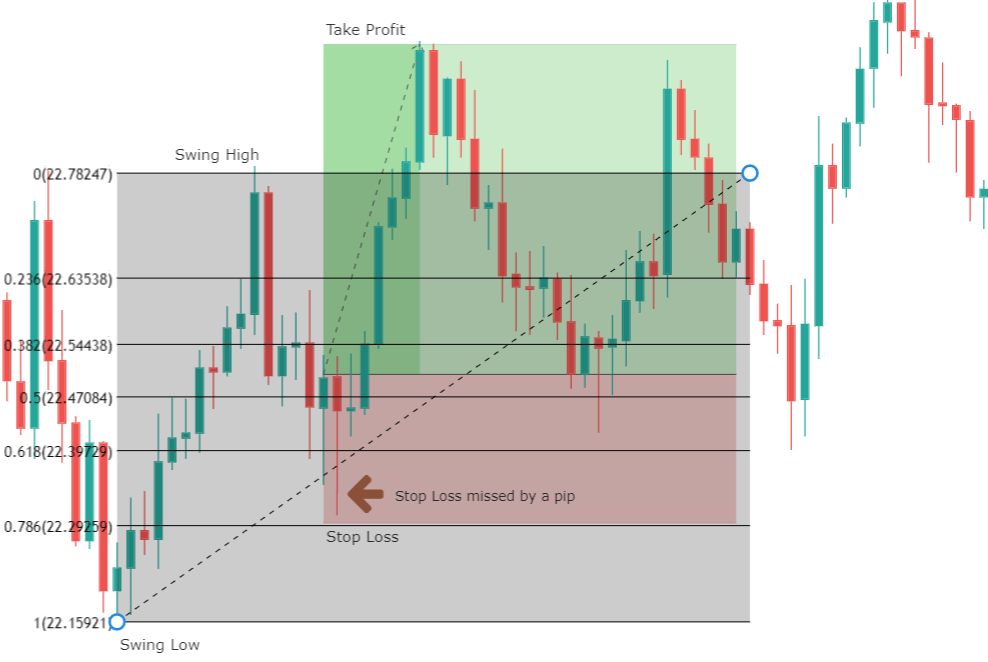
Using Fibonacci Levels For Risk Management

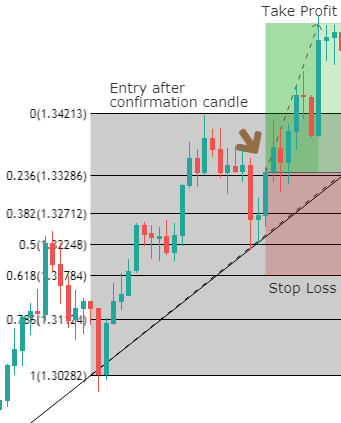
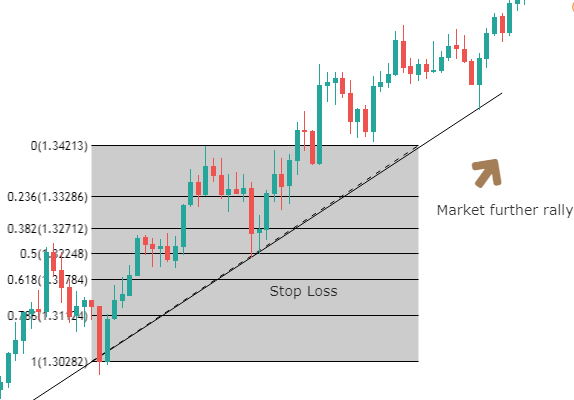
Not just for entires, Fibonacci levels can also be used for managing and exiting a trade. We know how important risk management is in trading. These levels will help us in managing risk and maximizing profit if used correctly. What we are trying to tell here is that Fib levels act as a perfect tool to place our Stop-Loss and Take-Proft orders accurately.

Fibonacci extensions must be used to decide the placement of various Take-Profit levels. To place accurate Stop-Loss, just used the Fib level, which is below the point of entry in an uptrend. Likewise, use the Fib level, which is above the point of entry in a downtrend. For a more detailed explanation, you can refer to the below articles.

Stop-Loss | Take-Profit

Downloading The Fibonacci Indicator

Fibonacci indicators these days are very well designed and readily available in the market for free. Almost all of the trading platforms are equipped with a Fibonacci indicator that can be accessed on to the charts with just a click. If you are using the TradingView platform, a comprehensive Fibonacci indicator is present in the left side panel. If you are a MetaTrader user, there are some default Fib indicators, but the best one is the Auto Fib, which can be downloaded here.

Other Applications Of Fibonacci Levels

The applications of the Fibonacci levels are not confined to the ones discussed above. There are many other places where these ratios & levels are used for various other reasons. For instance, to confirm almost all of the Harmonic patterns, we use Fibonacci levels. An example of one such article can be found here. In this example, we have confirmed the formation of the Butterfly pattern on the price charts by using Fibonacci levels alone. So every technical trader needs to know and learn how to use these levels to have the edge over financial markets.

That’s about Fibonacci levels. If you have any doubts, let us know in the comments below. In the upcoming course lessons, we will be discussing more technical tools like Moving Averages, Indicators, Oscillators, etc. Hence, stay tuned for more informative content.

Categories
Forex Course

68. Using Fibonacci Retracements To Place Appropriate Stop-Loss

Introduction

Until now, we have paired the Fibonacci levels with various technical tools to find appropriate trading opportunities. Some of them include support/resistance, trendlines, and even candlestick patterns. In the previous lesson, we also saw how to place appropriate ‘take-profit’ orders to maximize our profits. The uses of the Fibonacci levels do not end here. There is another incredible application of these levels, and that is to find the appropriate ‘stop-loss’ levels. ‘

As a trader, one should always use the ‘Stop-Loss’ orde as they are critical to avoid the risk of bearing huge losses. In some adverse situations, if this order is not used, it would result in a complete drain of trading capital where we can have the risk of losing everything in a single trade. Placing an appropriate stop-loss ensures that we do not expose ourselves to the unbearable risk.

However, placing the stop-loss order randomly might expose us to the risk of getting stopped out very early. So the proper placement of this order is crucial, and it can be hard for traders who aren’t experienced enough. So the Fibonacci tool can be a great help for us in determining accurate stop-loss levels.

Using Fibonacci Levels To Place Appropriate Stop-Loss Orders

In the below chart, we see a big initial move to the upside on which the Fibonacci levels are plotted using the Swing low and Swing high. Using the ‘Fibonacci strategy,’ we can notice a retracement that has reacted fairly well from the 61.8% Fib level, and now if the next candle is green, this could be a confirmation for us to go ‘long.’

We notice in the below chart that the next candle appears to be Green, and now with that confirmation, we can place our ‘buy’ trades with appropriate ‘stop-loss’ and ‘take profit.’ The traditional way of using a stop-loss order is to place it 50 pips away from the point of entry. Most of the novice traders use this method even today. This is said to be a layman’s approach with no suitable reasoning. When we use such methods, there is a high chance of we getting stopped out before the trade moves in our favor.

The below chart shows that how placing a 50 pip stop-loss can prove to be dangerous. We can see the stop-loss getting triggered by the immediate next candle after the entry was made.

Now let’s see how to place the stop-loss order using Fibonacci levels. The strategy is to place the stop-loss at the Fib level, which is below the Fib level from where the retracement reacts and gives a confirmation candle. Taking the above example, since the retracement touched the 61.8% Fib ratio and gave a confirmation candle, the stop-loss will be placed at the 78.6% Fib ratio. This seems to be very simple, yet most traders are not aware of this.

In the above chart, we can see how the price just misses our stop-loss placed at the 78.6 Fib level and later directly went to our take-profit. This shows the precision of stop-loss placement, which was established using the Fibonacci levels.

Conclusion

We must understand that stop-loss determination is a crucial step and has to be calculated mathematically using any reliable technical indicators. Indicators like Fibonacci have a mathematical approach in determining these levels. Make sure to use these levels before going to place your stop-loss levels next and let us know how they have worked for you. Cheers!

[wp_quiz id=”64961″]
Categories
Forex Course

66. Pairing The Fibonacci Levels With Trendlines

Introduction

In the previous articles, we learned how Fibonacci retracements give extra confirmations while trading the support & resistance levels. We also know that Fibonacci levels can be used as a confirmation tool to trade many candlestick patterns as well. Now we shall extend this discussion and understand how Fibonacci retracements can be traded using the trendlines.

Trendlines are a crucial part of technical analysis. They are primarily used to identify trends, be it up or down. Trendlines being such an important part of trading, when combined with the Fibonacci indicator, can produce trades that have the highest probability of winning. So let us see how this can be done.

Combining Fibonacci Levels & Trendlines

In the below chart, we have, firstly, identified an uptrend and drew a supporting trendline to it. The next step is to plot Fibonacci on the chart by identifying a swing low and a swing high. The marked area shows where all our trading is going to take place and the region in which we will find our swing low and swing high.

The traditional way of selecting a swing low is when the point intersects with the trendline, just as we have done in this case (below image). The swing high will be the point where the market halts and reverses for a while.

In the below chart, we have used the chosen a swing low and swing high to plot our Fibonacci indicator. In order to combine the Fibonacci with trendline, we must wait to see if the retracement from the swing high touches the 50% or 61.8% Fib level. After touching any of these levels, if the market gives a confirmation candle, it could be a perfect setup to go long. The retracement, in this case, touches the 50% level, which coincides exactly with the upward trendline. The next and final step is to look for a confirmation candle, if any.

We have gotten a confirmation sign from the market after the second green candle closes above the 23.6% Fib level (below image). Hence traders can now take risk-free positions on the ‘long’ side of the market with a stop-loss below the 61.8% Fib level and with an aggressive target above the recent high. This trade results in a risk to reward ratio of 1.5.

We should not forget that if the retracement does not take support at the 50% or 61.8% Fib level and goes further down, breaking all the levels, it could be a potential reversal sign. Thus the retracement that is coinciding with the trendline and reacting from 50% or 61.8% Fib level is the thumb of the rule of this strategy.

The above is a more widened image of the chart shows that the market continues to trend upwards, crossing our ‘take-profit‘ area. To take advantage of the market’s trending nature, we can place a trailing stop-loss order to maximize our profits.

Conclusion

When trends start to develop in the market, one should start looking for ways to go ‘long’ or ‘short’ by using necessary technical indicators that give a better chance of a profitable trade. The Fibonacci indicator is one such powerful tool to help traders find potential entry points. We hope you understood this concept clearly. Let us know if you have any questions in the comments below. Do not forget to take the quiz before you go. Cheers!

[wp_quiz id=”64779″]