Introduction
Until now, we have paired the Fibonacci levels with various technical tools to find appropriate trading opportunities. Some of them include support/resistance, trendlines, and even candlestick patterns. In the previous lesson, we also saw how to place appropriate ‘take-profit’ orders to maximize our profits. The uses of the Fibonacci levels do not end here. There is another incredible application of these levels, and that is to find the appropriate ‘stop-loss’ levels. ‘

As a trader, one should always use the ‘Stop-Loss’ orde as they are critical to avoid the risk of bearing huge losses. In some adverse situations, if this order is not used, it would result in a complete drain of trading capital where we can have the risk of losing everything in a single trade. Placing an appropriate stop-loss ensures that we do not expose ourselves to the unbearable risk.
However, placing the stop-loss order randomly might expose us to the risk of getting stopped out very early. So the proper placement of this order is crucial, and it can be hard for traders who aren’t experienced enough. So the Fibonacci tool can be a great help for us in determining accurate stop-loss levels.
Using Fibonacci Levels To Place Appropriate Stop-Loss Orders
In the below chart, we see a big initial move to the upside on which the Fibonacci levels are plotted using the Swing low and Swing high. Using the ‘Fibonacci strategy,’ we can notice a retracement that has reacted fairly well from the 61.8% Fib level, and now if the next candle is green, this could be a confirmation for us to go ‘long.’

We notice in the below chart that the next candle appears to be Green, and now with that confirmation, we can place our ‘buy’ trades with appropriate ‘stop-loss’ and ‘take profit.’ The traditional way of using a stop-loss order is to place it 50 pips away from the point of entry. Most of the novice traders use this method even today. This is said to be a layman’s approach with no suitable reasoning. When we use such methods, there is a high chance of we getting stopped out before the trade moves in our favor.
The below chart shows that how placing a 50 pip stop-loss can prove to be dangerous. We can see the stop-loss getting triggered by the immediate next candle after the entry was made.
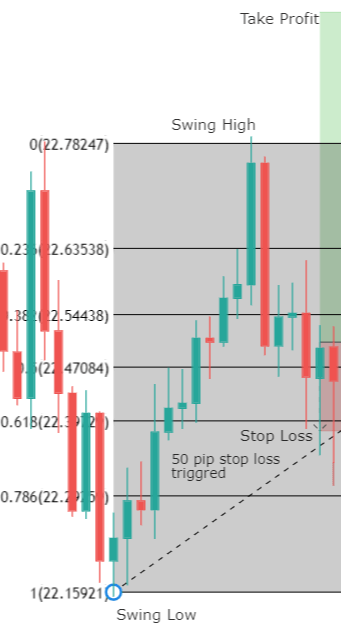
Now let’s see how to place the stop-loss order using Fibonacci levels. The strategy is to place the stop-loss at the Fib level, which is below the Fib level from where the retracement reacts and gives a confirmation candle. Taking the above example, since the retracement touched the 61.8% Fib ratio and gave a confirmation candle, the stop-loss will be placed at the 78.6% Fib ratio. This seems to be very simple, yet most traders are not aware of this.
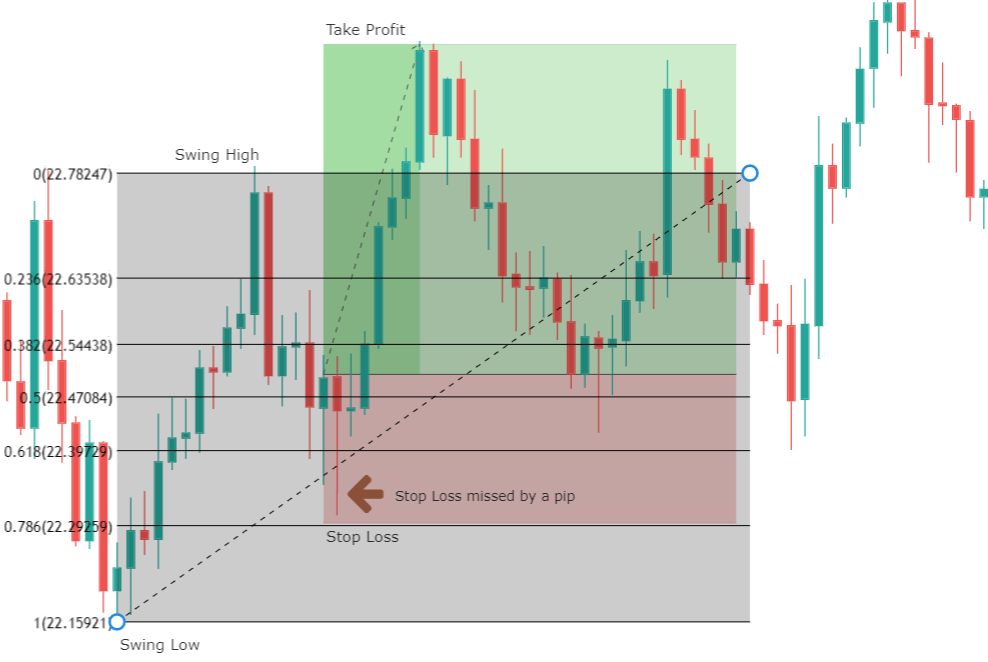
In the above chart, we can see how the price just misses our stop-loss placed at the 78.6 Fib level and later directly went to our take-profit. This shows the precision of stop-loss placement, which was established using the Fibonacci levels.
Conclusion
We must understand that stop-loss determination is a crucial step and has to be calculated mathematically using any reliable technical indicators. Indicators like Fibonacci have a mathematical approach in determining these levels. Make sure to use these levels before going to place your stop-loss levels next and let us know how they have worked for you. Cheers! [wp_quiz id=”64961″]