Introduction
The Ichimoku Cloud is a Japanese charting method and a trading system developed by Mr. Goichi Hosoda. This indicator consists of many different lines embedded in the price chart. Hence it might look complicated at first and might even make novice traders unforgettable reading the charts. But with enough experience, we can grab all the information presented by the indicator. The indicator consists of five Moving Averages and a cloud formed by two of those averages. The default settings of the indicator are 9, 26, and 52, and these settings are configurable according to the trader preference.

Components of the Ichimoku Cloud
This indicator consists of five lines in total, as discussed. They are a Red Line (Tenken Sen), Blue Line (Kijun Sen), Green Line (Chinoku Span), and Two Orange lines that make the cloud (Senkou Span A and B). Each line of the indicator is a moving average, so we can also look at the Ichimoku cloud indicator as a five moving average indicator.
The Basic Interpretations of the Ichimoku Cloud
When the price is above the cloud, it means the market is in a bullish trend. Contrarily, when the price is below the cloud, it means the market is in a bearish trend. When the price action is in the middle of the trend, it means that the market is in a consolidation phase.
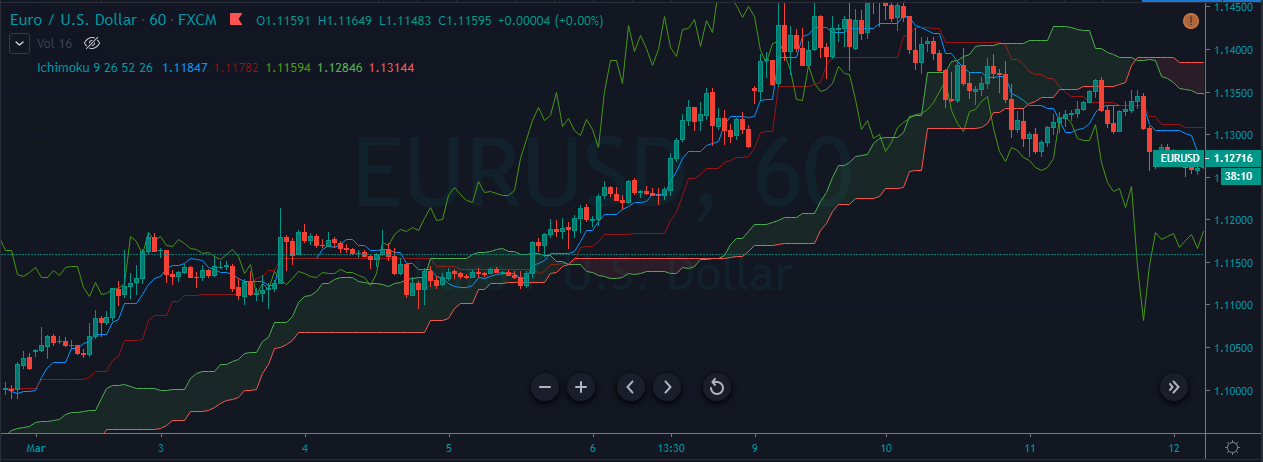
Below is how a Forex price chart looks when the Ichimoku cloud is plotted on it.
Ichimoku Cloud Trading Strategy – Buy
First of all, the price action must be above the cloud as it indicates that the market is in an uptrend. When the Tenken Sen (Red Line) crosses the Kijun Sen (Blue line) from below, it indicates a bullish signal, and we can go long.
Buy Example 1
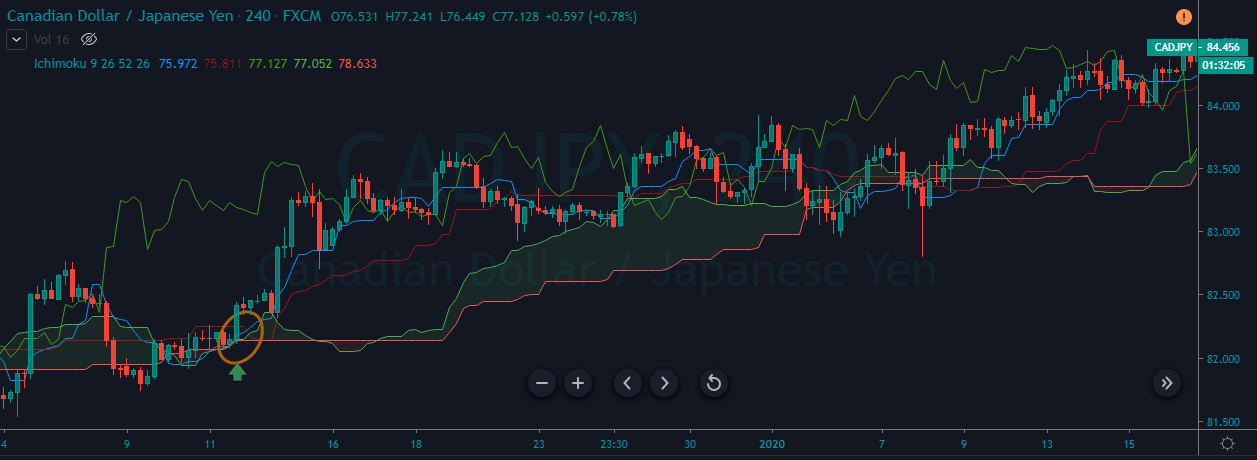
The image below represents a buying trade in the CAD/JPY Forex pair. We can see that the cloud goes below the price action, and it indicates that the trend is up. Soon after Tenken Sen (Red Line) crosses the Kijun Sen (blue line) below the price action, we know that the pullback is exhausted, and buyers are ready to resume the uptrend.
Buy Example 2
The image below belongs to the Weekly chart of the USD/CHF Forex pair. In Dec 2000, the Ichimoku indicator generated a clear buy signal when the cloud was below the price action, and the crossover of both the lines shows that it’s a perfect moment to go long in this pair.

Ichimoku Cloud Trading Strategy – Sell
The price action must be below the cloud as it indicates that the market is in a downtrend. Go short when the Tenken Sen (Red Line) crosses the Kijun Sen (Blue line) from above as it indicates a sell signal.
Sell Example 1
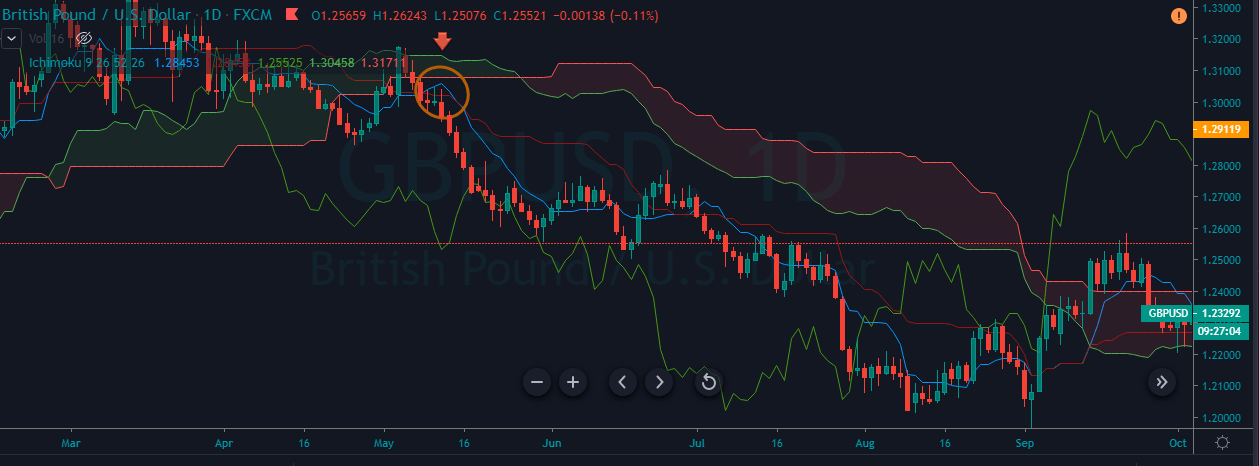
The below example is from the daily chart. It doesn’t matter which timeframe we trade; this strategy works well on all the timeframes. In the below image, at first, the market was in the consolidation phase. When the cloud goes above the price action, it’s a sign for us to prepare to go short soon in this pair. When the Tenken Sen (Red Line) crosses the Kijun Sen (Blue Line), it indicated that the sellers are now ready to print a new lower low.
Sell Example 2
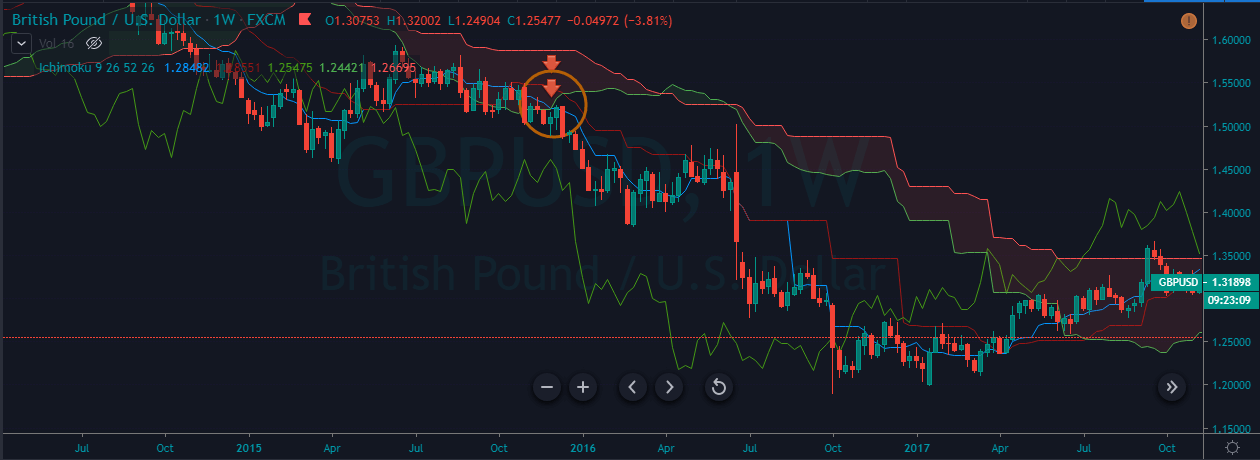
If you are an investor or a higher timeframe trader, the below example is for you. The Red arrows and the encircled area indicate that the price action is below the cloud. Also, the Tenken Sen (Red Line) crosses the Kijun Sen (Blue line), indicating a sell signal.
The example below we took was from 2016, and the price action continuously goes down for the complete year. We should be patient enough and have control over our emotions to ride longer moves. We have placed the stop-loss above the crossover of two lines and booked the profits when the cloud goes below the price action.
That’s about Ichimoku Cloud and relative trading strategies. There are many other ways through which the signals can be generated using this indicator, but the ones discussed above are the most basic yet reliable ones. Cheers. [wp_quiz id=”67661″]