Until now, we have defined two kinds of waves, motive and corrective. In this article, we will introduce the concept of “degree,” which will help us in the process of waves identification.
The concept of degree
Elliott defined a series of “degrees” to maintain a hierarchical waves order. This order is based mainly on the relationship that the wave develops over time. In other words, while higher is the time elapsed in the wave formation, greater will be the wave degree.
The term “degree” must be considered in relative terms about the price and time relationship. It should not be considered strictly according to the duration, for example, a day, a week, or a month.
The blue box shows a bullish impulsive wave developed over126 days which attained a 25.95% advance. This wave started from the low of December 26, 2018, when the price found support at 2,346.6 pts and ended on May 1, 2019, when it hit the top at 2,954.4 pts. If we remember the basic structure of a wave, we can see that the upward movement was developed in five waves.
In the red box, we observe a corrective wave sequence disclosed in three waves. This retracement began on May 1 and ended on June 3, 2019, when SPX plunged to 2,728.8 pts. The bearish move unfolded over 33 days and eased 7.67%.
R.N. Elliott, in his work “The Wave Principle” defined a series of degrees, with specific terminology and it’s as follows:
- Grand Super Cycle.
- Super Cycle.
- Cycle.
- Primary.
- Intermediate.
- Minor.
- Minute.
- Minuette.
- Sub-Minuette.
However, Prechter & Frost, in “Elliott Wave Principle” added six degrees:
- Supermillennium.
- Millennium.
- Submillennium.
- Micro.
- Submicro.
- Miniscule.
Despite the wide-spread degrees, Hamilton Bolton says that the most common degrees used are Minor, Intermediate, and Primary.
Wave Labeling
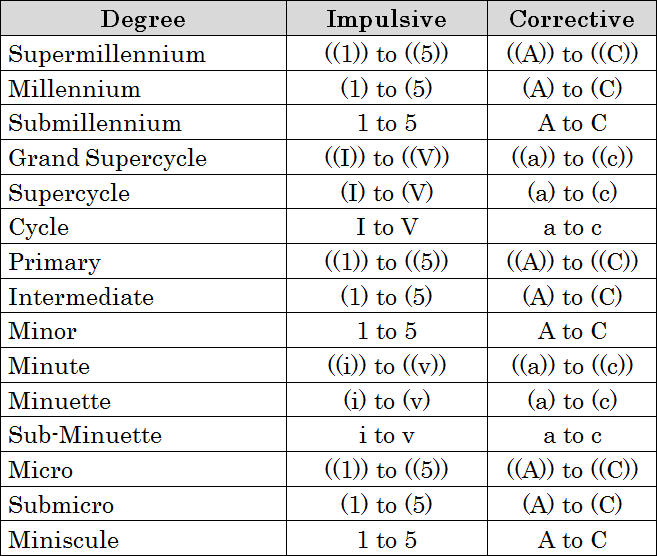
Labels are useful to keep the order in the wave analysis. It’s necessary to assign a symbol on each wave of each wave that is studied. In the Elliott Wave Theory there is a set of labels for each degree as follows:
The wave labels are essential to understand the current market position and will allow us to respond to the question “where goes the market?”.
The following chart corresponds to the application of waves labeling. In this case, the SPX daily chart developed a complete cycle of Intermediate degree.


