Introduction
In most economies globally, the GDP data is published by governments or government agencies quarterly. This would mean that analysts, economists, and households would have to wait for a full quarter to know how the economy is performing. Naturally, this long wait can be frustrating and, in some cases, inconveniencing. Therefore, having some form of estimate as to what the GDP might be can be quite useful.
Understanding Gross Domestic Product Estimate
As the name suggests, the GDP estimate serves to estimate an economy’s GDP before the release of the official government-published GDP report.
These estimates are arrived at by surveying the industries within the country. In the UK, for example, the following industries are surveyed; production, manufacturing, mining and quarrying, agriculture, construction, private services, and public services. Most estimates adopted globally use the bottom-up methodology.
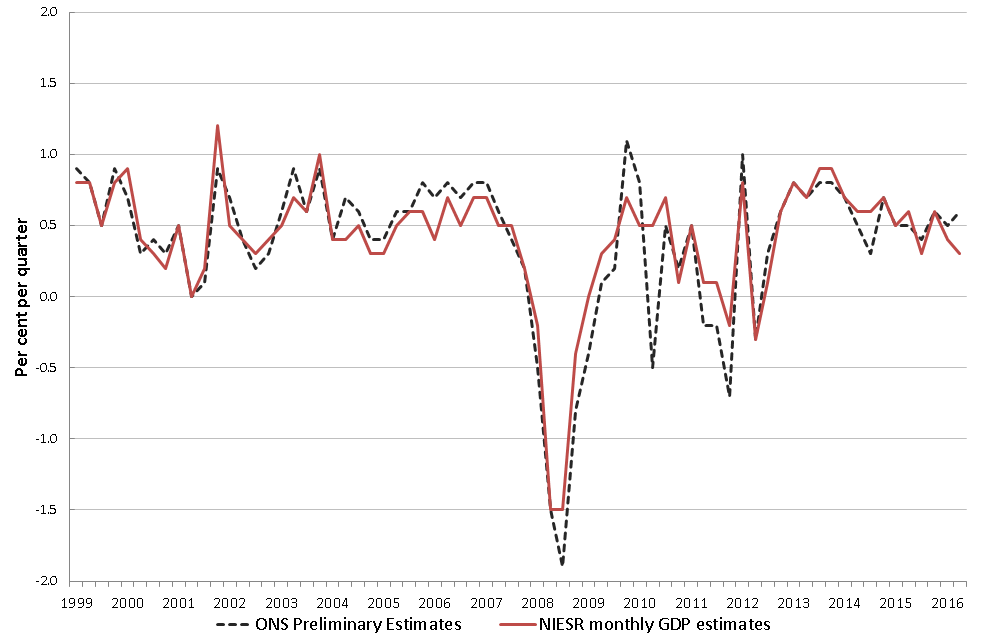
Source: National Institute of Economic and Social Research
In the UK, the National Institute of Economic and Social Research (NIESR) publishes a rolling monthly estimate of the GDP growth using the bottom-up methodology. Hence, its GDP estimate covers the preceding three months. Since the GDP estimates are published monthly, it means that NIESR releases at least four GDP estimates before the government’s publication. Using the bottom-up analysis to estimate the GDP, NIESR uses statistical models to aggregate the most recent trends observed within the GDP subcomponents. The statistical models are fed the latest trends, and they forecast the most probable outcome in these subcomponents. Note that these forecasts are only short-term.
While the GDP estimates are not always accurate to the exact decimal percentage, they provide an accurate GDP representation.
Using the Gross Domestic Product Estimate in Analysis
The GDP estimate data can be used in the timely analysis of economic performance. Here is how this data can be used.
In many countries, the macroeconomics policies are usually set more frequently than quarterly. However, since the economic performance is the centerpiece in any macroeconomic policy-making, it is vital to know the most recent GDP data. By tracking the trends of the top components of the GDP, the GDP estimates can provide the most recent data. Therefore, this will help the policymakers to implement more informed policies. Let’s see how the contrast between the GDP estimate and the actual GDP can make a difference in policy implementation.
For example, during the second quarter of 2020, governments and central banks wanted to implement expansionary fiscal and monetary policies. At this point, the only GDP data available to them is the actual GDP for the first quarter of 2020. But for most economies, the 2020 Q1 GDP showed economic growth. On the other hand, the more recent GDP estimates could show that contractions were already visible in the economy.
In this scenario, if policymakers were to use the actual data available to then – the Q1 GDP – they would have made undesirable policies. These policies would have further harmed the economy. On the other hand, if the GDP estimates would have been used to aid the policy implementation, chances are, the most suitable and appropriate monetary and fiscal policies would have been adopted. Here, the GDP estimate would have helped them make relevant policies and ensuring that these policies are implemented timely.
Furthermore, the GDP estimates can also be used to establish whether the policies implemented are working as expected. If expansionary policies are implemented, their primary goal is to spur demand and stimulate economic growth. Using the GDP estimate, policymakers can track to see if there are any changes experienced in the economy. Some aspects like inflation take a long time to adjust, but demand generated by households is almost instantaneous. Therefore, the GDP estimate can be used to gauge the effectiveness of the implemented policies. Take the stimulus packages adopted in Q2 2020 after the pandemic; they were meant to stimulate demand by households, which would lead to economic recovery. With the GDP estimate, we could tell whether the stimulus package worked or not.
When accurate, the advance GDP estimate can be a leading indicator of the actual GDP. Therefore, the GDP estimate data can be used to show the prevailing trends in the economy. For instance, it can be used to show looming periods of recession and any upcoming recoveries. Say that the trailing three months captured by the GDP estimate shows that the economy’s major subcomponents are struggling with demand and contracting. This data can be taken to mean that for that quarter, there is a higher probability that the overall economy would contract. Conversely, when the subcomponents being tracked show growth, it can be expected that the overall economy would have expanded in that quarter.
It’s not just the governments that can benefit from the GDP estimate data. The private sector as well can use the data to plan their economic activity. Take the example that the GDP estimate shows that a particular sector in the economy has been contracting for the previous three months. Investors in this sector can presume that the demand for goods or services from the sector is depressed. In this instance, to avoid venturing into loss-making businesses, investors can make informed decisions about where and when to invest their money.
Impact on Currency
When the GDP estimate shows that the short-term economy is expanding, the domestic currency will appreciate relative to others. A short-term expansion indicates that demand levels in the economy are higher, which implies that unemployment levels are low and households’ welfare is improving.
The domestic currency will depreciate if the GDP estimate shows that the economy is contracting. The primary driver of a contracting economy is decreased expenditure by households contributing almost 70% of the GDP. The decline in demand can be taken as a sign of higher unemployment levels.
Sources of Data
In the UK, the National Institute of Economic and Social Research publishes the monthly and quarterly UK GDP estimate.
How GDP Estimate Release Affects The Forex Price Charts
The most recent UK GDP estimate published by NIESR was on October 9, 2020, at 11.10 AM GMT and accessed at Investng.com. Moderate volatility on the GBP can be expected when the NIESR GDP estimate is published.
During this period, the UK GDP is estimated to have grown by 15.2% compared to 8.0% in the previous reading.
Let’s see how this release impacted the GBP.
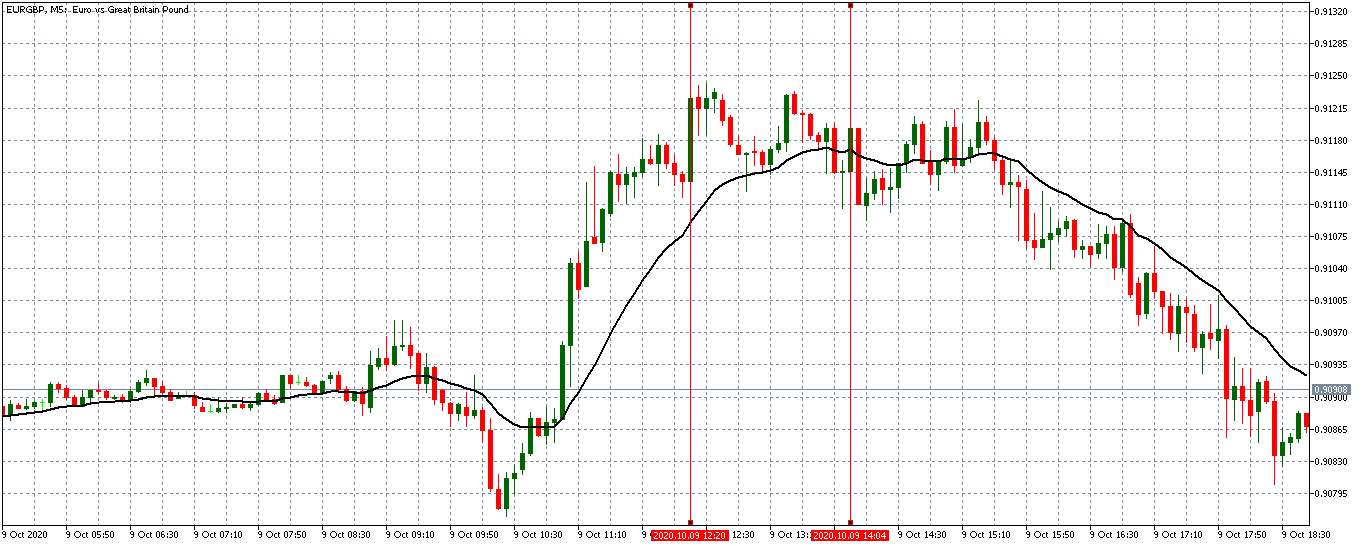
EUR/GBP: Before NIESR GDP Estimate Release on October 9, 2020,
just before 11.10 AM GMT
Before the release of the NIESR GDP Estimate, the EUR/GBP pair was trading in a subdued uptrend. The 20-period MA transitioned from a steep rise to an almost flattened trend with candles forming just above it.
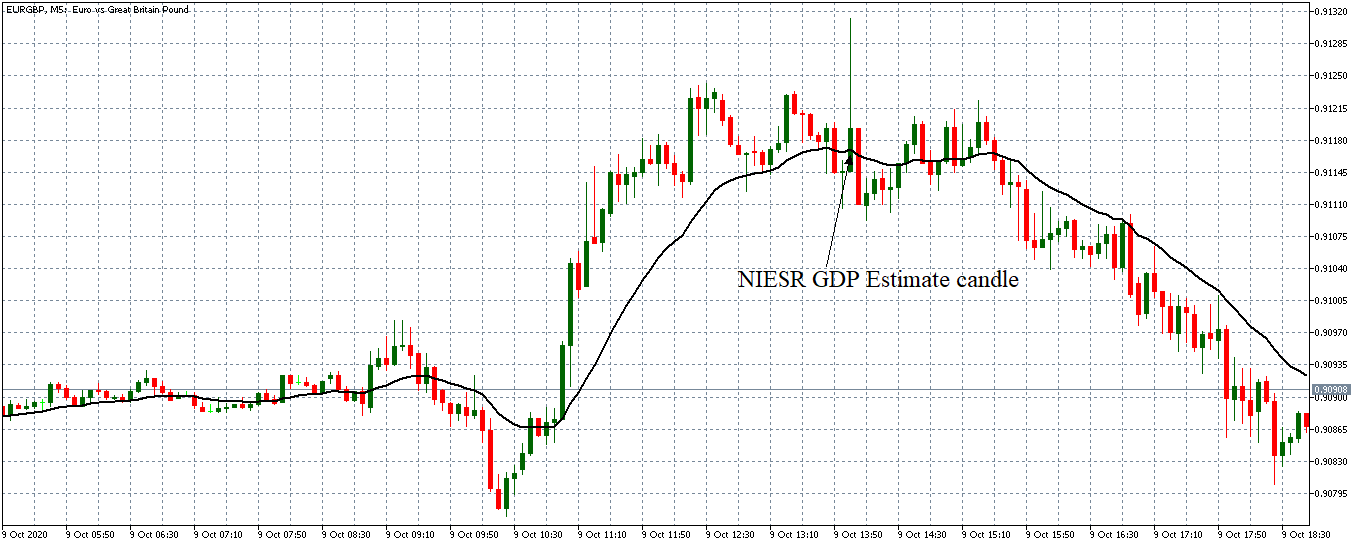
EUR/GBP: After NIESR GDP Estimate Release on October 9, 2020,
at 11.10 AM GMT
After the GDP estimate release, the EUR/GBP pair formed a 5-minute bullish ‘inverted hammer’ candles with a long wick. This candle represents a period of volatility in the pair as the market absorbed the data. Subsequently, the pair traded in a neutral trend before adopting a steady downtrend with the 20-period MA steeply falling.
Bottom Line
The GDP estimate is not just relevant to investors and policymakers; as shown by the above analyses, it can result in periods of increased volatility in the forex market when it is published. Cheers!


